Смотри обучающее видео по маркету на YouTube
Как купить торгового робота или индикатор
Запусти робота на
виртуальном хостинге
виртуальном хостинге
Протестируй индикатор/робота перед покупкой
Хочешь зарабатывать в Маркете?
Как подать продукт, чтобы его покупали
Платные технические индикаторы для MetaTrader 4 - 67
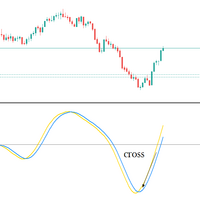
Upgraded version 1.5 , Arrow added on to indicate Buy and Sell Signal, The indicator is an ossicaltor that targets the highest buying and lowest selling levels , the signal indicated by the two lines crossing above and below zero line 0 HOW IT WORKS? Buying : you want to place your buy Entry when the yellow line is above the blue line ; stop loss just a few pips below the swing low , take profit when the lines cross again - A Buy arrow will also appear when the crossing appears Selling: yo
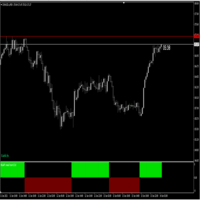
Follow Trend indicator , indicator works on Currencies , Indices ,Stocks Gold etc , good for follwoing trend on the markets suitable for scalping Buy Rules; When the histo changes to Blue you place buy order ,stop loss just below the previous swing low Sell Rules; When the histo changes to Red you place sell order ,stop loss just below the previous swing high Trade on a timeframe which best suits your trading style

This indicator calculates Correlation among currency pairs (Selected by user) to find the least and/or most correlated symbols in real time. Correlation ranges from -100% to +100%, where -100% represents currencies moving in opposite directions (negative correlation) and +100% represents currencies moving in the same direction.
Note The Correlation more than 80 (Adjustable) between two currency pairs, Shows that they are quite similar in the kind of movement and side. The Correlation less than

Day Trades Resistance and Support (daytradesSR) is an indicator composed of 1. The main line (support/resistance line), which shows i. either UP or DOWN trend ii. levels of dynamic support or resistance 2. A specific range defined by a line for range high and another line for range low. These lines serve as weak secondary support or resistance . 3. When the main line (support/resistance line) is first hit by the price after a detected trend reversal , either an UP ARROW (sup

Are you unhappy with the size of the main chart when using oscillators? You can add MACD, RSI, Stochastic, ATR and Momentum indicators using Main Chart Oscillators. Vertical Size : Vertical size of indicator's window Drawing Mode : Add Oscillators on same section or create a new section for any of them Draw Top Line : Draws a line in the top of indicator's section to separate it Top Line Style : Style of top line Top Line Color : Color of top line Top Line Width : Width of top line Show Indicat
Any Moving Average draws a moving average of * any indicator in a sub-window. Many Indicators included with MT4 are supported by default. You can add custom indicators as well. Settings Name Description Timeframe Select timeframe for calculation Source Indicator Select Indicator Custom Indicator Name Enter Custom Indicator Name ( when Source Indicator is set to Custom) Indicator Settings Source Indicator parameters ( separated by comma ) Moving Average Settings Moving Average parameters (

Hello Traders, A very simple but useful tool for an automatic traders. An indicator that allows you to adjust the speed of the strategy tester in a very simple way. Just drag the indicator into the chart before launching the strategy tester and adjust the speed manually, and that's all! Buttons can be located in any part of the chart as you like, just enter the x and y coordinates --------------------------------------------------------------------------------------------------------------------
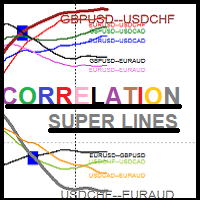
SUPER Correlation Lines for Symbols Multi timeframes Multi Currencies Indicator Each line indicates 2 symbols correlation based on Multi timeframes symbols strength calculations
5 symbols -> 10 correlation indicator lines Strategy:1 is based on selecting the NEW weaker/stronger correlation line : *****New Weaker Line Crossing DOWN the old weaker line : SELL SYMBOL1 && BUY SYMBOL2 *****New Stronger Line Crossing UP the old weaker line : BUT SYMBOL1 && SELL SYMBOL2
You close trades when

Perfect Entry Spotter Indicator with Alert is based on a combination of Support Resistance, Fractals, Alligator and Moving Average indicators, based on an intense research. It has alert included with option to enable/disable it. You can trade based on it with high accuracy. Recommended trading rules: 1. Buy - Wait for the Lime arrow to appear and trade in the direction of the trend (trend going up). 2. Sell - Wait for the Red arrow to appear and trade in the direction of the trend (trend going d

This indicator is customizable to whatever settings you preferred
you only buy above the ema, and sell only under the ema using the stochastic as an entry and the ema to filter bad trades DEFAULT SETTINGS: Stochastic(8,3,3) EMA (200) *Non-Repainting
*For Desktop MT4 Only
*Great For Scalping
*Great For Swing Trading
*Arrow Entry Alerts
*Mobile Alerts
*Works On Any Timeframe
*Works On Any Mt4 Pair
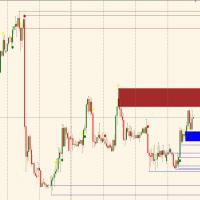
It automatically tracks the supply and demand zones and indicates the current trend. Once you have identified the trend on the main time frame just wait for the price on the operating time frame to arrive in the near future of a demand (buy) or supply (sell) zone and execute the trade. It is recommended to wait for the higher time frame trend and operational time frame to be aligned and operate exclusively on the areas indicated by the. Developed the right awareness you can achieve more and more
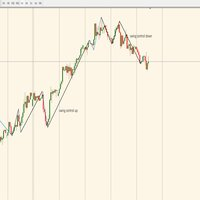
Indicator automatically translates control swings (trend-dominated market) and correction swings (retracing market); It is a simple indicator to be combined with your strategies in order to improve them and enter the market only when the trend is in control; Check on the largest time frame how the market is moving (swing black color control or swing blue color correction) from here, going down from time frame to set its operation in the direction of the trend. OPERATIONAL EXAMPLE: LOCATE DOWNWAR

We Trade Live Trend Max Our team of engineers have programmed a great tool which we have used to success and will aid you in making better decisions when placing a trade, we believe it is better than anything available on the market at the moment! try & Test Against other products and see for yourself how amazing this is. Our Main Objective is to help you as traders discover how you can take a simple trading setup and make consistent profits. We provide the fundamentals needed to trade the marke

This indicator identifies the major and minor swing high and low points on a chart. It then takes the most recent swing and draws a fibonacci pattern of retracement and extension levels to give you an idea of where price may move next. It allow allows you to set a pair of moving averages to help identify the direction of the overall trend. There are configuration parameters for the major and minor swing and the moving averages.
индикатор для бинарных опционов сигнал появляется вместе с открытием новой свечи сигнализирует на неё полное отсутствие перерисовки рекомендации сигнал на покупку синяя стрелка направлена вверх сигнал на продажу красная стрелка направлена в низ время экспирацыи рекомендуется 1 свеча используемого таймфрейма если сделка оказалась убыточной можно увеличить сумму и отрыть сделку ещё раз на следующем сигнале
инструмент прост в настройках всего два периода оптимальные настройки иже установле

LinearRegressionDecomposition ( LRD ) Linear Regression Decomposition has been calculated using a very complex method.
Basically, by examining the retractions of the price movements of the instruments on the Metatrader platform, it is aimed to decompose these movements linearly.
The indicator is shown on the graph with two separate lines.
The red line is our main indicator and handles the price divergence.
The blue line filters the red signal.
For example, for a buy signal to occur: the red

After Purchase, Please Contact
t.me/hakimsann
These Indicator are Mixed on All Logical Value Such As
Trend
Support and Resistance
Candle Pattern
Price Action
we Combine
2 Bollinger Band
6 Zigzag Periods
4 Relative Strength Index Period
1 MACD Trend
Support and Resistance
Price Action
Pattern Candle
Avoiding Doji On Market Can Be Applied On Every Market
24-7
Maksimum Martingale lv 5.
First stake 0.4% Balance

Murrey Math Multi Timeframe Indicator Support/Resistance
Murrey Math Lines are strong tools to plot the support and resistance levels.
Murrey Math Multi Timeframe Indicator draws multi timeframe MM lines on a smaller tf chart.
General Information: According to Gann, prices move in 1/8's, these 1/8's act as points of price support and resistance as an entity's price changes in time. Given this 1/8 characteristic of price action, Murrey assigns properties to each of the MML's in an a given

Индикатор Velocity of price change ( VP ) показывает среднюю скорость изменения цены на тех характерных промежутках времени, где эта скорость была приблизительно постоянной. Используемый в VP робастный алгоритм сглаживания цены от ее случайных скачков, обеспечивает надежность показания индикатора, который не реагирует на простую волатильность цены и её незначительные подвижки. Индикатор позволяет отслеживать тренды и моменты их разворотов , во время которых показ

Koala Trend Line Введение: Я сделал этот индикатор, чтобы помочь трейдерам лучше находить тренд, этот индикатор может показать вам текущую линию тренда. Как вы знаете, линия тренда должна проходить между двумя самыми высокими или самыми низкими точками. Итак, основная логика - найти самые высокие и самые низкие точки. Индикатор находит все самые высокие и самые низкие точки в истории и показывает их красными и синими точками. Эти самые высокие и самые низкие точки рассчитываются в соответствии

The ATR Levels Indicator For MT4 is an indicator that is built specifically for traders who use the Meta Trader 4 for their trading analysis, charting of different currency pairs and trading assets, doing their technical analysis and making trading decisions all through the trading day as they work.
One of the first major advantages of using the ATR Levels Indicator For MT4 is that it automatically helps the trader to spot very important levels in the markets based on the Average True Range In
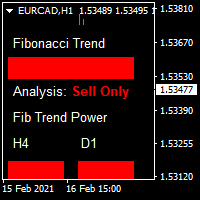
Our buy and sell indicator provides precise entry points, guiding you on when to buy and sell while indicating the trend bias. This tool minimizes drawdowns and increases your winning percentage by aligning with the trend. Buy signals are represented by blue boxes alongside candles, signaling optimal entry points. Conversely, red boxes indicate sell signals. Additionally, the secondary indicator, Fibonacci trends, further enhances decision-making by complementing the primary signals.
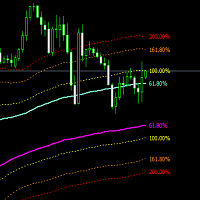
DYNAMIC CHANNEL Forex is a Metatrader 4 (MT4 (MT4)) indicator and the essence of this technical indicator is to transform the accumulated historical data. Forex DYNAMIC CHANNEL Indicator provides for an opportunity to detect various peculiarities and trends in price dynamics which are invisible to the naked eye. Based on this information, traders can assume further price movements and adjust their strategy accordingly.
Dynamic channel, which is calculated based on the maximum distance between

What Is Currency StrengtT Indicator?
A currency strengthT indicator is a graphical tool that shows the strength of a currency. Common indicators usually show the strength of a currency in relation to another currency, however, with some calculations it is possible to find the absolute strength of each individual currency.
Therefore, a currency strength matrix indicator (or meter) is a tool that tries to express the absolute strength of a currency, so that you can compare this strength with
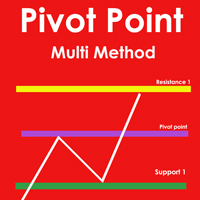
Pivot Point Multi Method is a fully automatic pivot point indicator and indicate support and resistances (S1,S2,S3,S4,R1,R2,R3,R4) based on four Methods that you can select on of them Pivot point detection and drawing support resistances Methods( Classic ,Camarilla ,Woodie ,Fibonacci)
Pivot Point Multi Method is working on all time frames and all currency pairs and gold silver and crypto currencies .
Recommended Setting : Pivot_Method select one of the methods ( Classic ,Camarilla ,Woodi

Торговая система разработана для работы с золотом на временных периодах: 30M, 1H. Индикатор позволяет подстраиваться под рыночную ситуацию.
Параметры для 1H : PERIOD=9F , FILTER=300 .
Параметры для 30M : PERIOD=22B , FILTER=450 .
Допускается небольшая подстройка под конкретного брокера .
При изменении количества отображаемой истории, также может потребоваться подстройка параметров.
Индикатор не перерисовывается .
В "Gold n XAU" используются разные правила для входа в
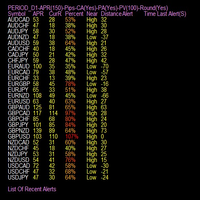
Indicator is able to alert by pop and acoustic alarm the achievement of the average price range of the last periods so as to be able to set our operation. It allows different percentage variables reached and periods of variation according to the parameters entered. Apply your reverse strategies to achieving that threshold so you get higher success rates. Indispensabile per le strategie reverse intraday.
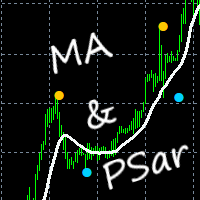
This indicator gives you PSar crossings in the form of blue and yellow dots on the chart, as well as a Moving Average. Parameters: MAPeriod (Change to your preference) Alerts PSarStep PSarShift PSarMaximum How to use: Simply attach to any chart with default settings. Sell on yellow dots, with white MA line above price. Buy on blue dots, with white MA line below price. Best results when checking the higher time frames before entering trades. Best results on Major Pairs, but can also be used on o

Распределение Коши является классическим примером распределения с толстыми хвостами. Толстые хвосты указывают на то, что вероятность отклонения случайной величины от центральной тенденции очень велика. Так, для нормального распределения отклонение случайной величины от ее математического ожидания на 3 и более стандартных отклонений встречаются крайне редко (правило 3 сигм), а для распределения Коши отклонения от центра могут быть сколь угодно большими. Это свойство можно использовать для модели

!!!!UPDATED VERSION!!!!
Multi Currency Strength Indicator is the ultimate simple multi-currency strength dash meter that consists of Signal provider and automated labelled levels, that is effective for beginners and seasoned traders to enhance their strategies. The Author coded the program for the aim of bringing simplicity yet effective indicator that is user-friendly for all who use it. Try it out , its worth a try. INDICATOR INCLUDES: 1.Push Notification to get notifications on MT4 App o

This indicator XX Power indicator.Indicator displays trend movement. Indicator helps to buy and sell.In dicator displays arrow and line. Features
FiltPer - displays indicator period.
How to understand the status: If the Trend color is green, trend is up. I f the Trend color is red, trend is down.
//////////////////////////////////////////////////////////////////////////////////////////////////////////////////////////////////////////////////// ///////////////////////////////////////
Start Signal один из самых надёжных инструментов для торговли на финансовых рынках С помощью Start Signal можно торговать как Бнарными Опционами так и на других рынках Таких как Форекс Изначально Start Signal разрабатывался для Бинарных Опционов Но в ходе торгов было принято решение что он так же хорошо подходит и для скальпинга При чем он предоставляет хорошую точность Отлично подойдёт как для новочков так и для опытных трейдеров Сигналы крайне просты и понятные Не нужно анализировать множе

индикатор разработан для торговли на финансовых рынках для скальпинга, пипсовки инструмент использует в своем алгоритме уровни поддержки и сопровождения Это собственная стратегия и уникальная разработка сигналы стрелка вверх покупка стрелка в низ продажа рекомендуется использовать на таймфреймах до м 15 можно торговать от сигнала к сигналу внимание выделяйте на сделку не более 2% от депозита
Хорошый и надёжный инструмент если соблюдать правила мани менеджмента Разработан по собственной стратегии на уникальном алгоритме Индикатор полностью заточен под бинарные опционы Binary Luck очень прост в работе настраивать ничего не нужно Просто добавляем на график и можно приступать к торговли Отлично подойдёт как для новачков так и для опытных трейдеров Сигналы простые и понятные. Стрелка вверх покупка. Стрелка в низ продажа. Рекомендуемое время експирацыи 1 свеча. На одну сделку не более 3
As a trader you are looking for to enter trades at the perfect time. This indicator takes advantage of any price action and indicates when a certain level has been made and a potential break out is going to be made. Check LTF (Check Long time frame) feature added to 5mins , 15mins, 30mins 1hr & 4Hr chart which will check the trend on all frames times in particular the 4hr trend. so if a alert is received to buy or sell and the trend is not correlating to long term 4hr trend . you will receive a

Fibonacci Magic Pivot Levels The Fibonacci Magic Pivot Levels is a powerful yet easy to use indicator . It continuously monitor s intra-day price action and uses complex algorithms to calculate and detect key support, resistance and pivot levels, using the D1 timeframe as a filter. The Fibonacci Magic Pivot Levels is optimized for H4, H1, M30, M15, M5 & M1 timeframes and can be used on ALL Currencies, Indices, Commodities, and Cryptocurrency pairs . Trade with improved confidence an

This indicator is a must have tool that scans the active chart for candlestick patterns. It labels each bar according the candlestick pattern(s) that it finds enabling you to more easily analyze price action and be more informed about your trading decision. There are 103 common and uncommon possible patterns plus 6 new patterns based on research that the indicator can identify. If a candlestick(s) meets the requirements for multiple patterns, the bar will be labeled with up to 4 patterns names f
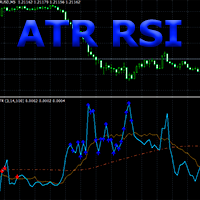
Композиция индикаторов ATR и RSI.
ATR RSI индикатор сопоставляет на одном графике два расчета индикатора ATR с периодами Fast и Slow, плюс линию среднего значения и зоны перекупленности (Overbought) и перепроданности (Oversold) индикатора RSI.
ATR по казывает значения изменения волатильности валютной пары в пунктах с учетом периода, задаваемого в качестве параметра. Точки входа, которые дает индикатор RSI показывают очень хорошее соотношение риск-прибыль на волатильных и трендовых рынках. AT

Follow a step-by-step system that detects the most powerful breakouts!
Discover market patterns that generate massive rewards based on a proven and tested strategy.
Benefits You Get On Indicator: Unique price action based algorithm. Powerful combination to any trading strategy. Auto-detects entry, exit, stop loss & take profit levels. Auto-calculates statistics of signals. Never repaints, never backpaints, never recalculates. Signals strictly on the "Close of the bar". Works in all symbol

XMaster Scalping NEW - простой индикатор определяющий начало и конец тренда. Очень хорошо можно сказать даже идеально подходит как для скальпинга так и для средне/долго срочной торговли. При нанесении на график располагается в подвале, что даёт вам возможность строить трендовые линии/уровни на цене и поглядывать в подвал на индикатор.
Как использовать: Всё просто. Желтый цвет продажи, зелёный покупки. Цвета можно изменить в настройках.
Дополнительная торговая информация: Лучше всего отр

The indicator helps the trader in identifying potential liquidity levels. The algorithm used in this indicator checks the behavior of the asset taking into account the price levels, momentum and volume analysis.
Features:- Parameters for signal optimization and alerts.
Usage:- The levels formed by the indicator can be helpful to traders in identifying potential entries, breakouts or reversals. it can assist traders of technical trading background or even pure price action trading. Examples o

Данный индикатор показывает свечную комбинацию, основанную на додж, додж и пин-бар. Логика паттерна состоит в том, чтобы стать на стороне силы, после неопределенности. Индикатор универсален и пригодится для торговли бинарными опционами(дополнительный материал также будет предоставлен), форекс, ETF, криптовалюта и многое другое. Индикатор поддерживает таймфреймы от М15 до МN включительно.
В индикаторе присутствует отправка уведомлений и поддержка Push-уведомлений.
МТ5 версия : https://www.mql
Индикатор для бинарных опционов Время экспирацыи 1 свеча Таймфеймами от м1 до м15 Отсутствие перерисовки
Можно использовать любой мани менеджмент Если это будет мартингейл то доходность увеличится Мартингейл использовать на маленьком счету не рекомендуется Сигналы Синяя стрелка вверх сигнал на покупку Красная стрелка вниз сигнал на продажу Рекомендуется избегать торговли во время выхода сильных новостей

All Candlesticks Library - это индикатор, который предлагает интеллектуальную систему распознавания образов с ДЕЙСТВИТЕЛЬНО широким диапазоном вариаций свечей! Существует более 100 свечных паттернов, от обычных доджи и вариантов консолидации до ряда хорошо известных моментумных свечей и свечей прорыва и до редких паттернов, которые мы не видим каждый день.
ПЛЮС, он поставляется со статистикой (НЕ 100% ТОЧНОЙ, но достаточно справедливой)! Вы можете видеть подсвечники, оба или ни один, изменить
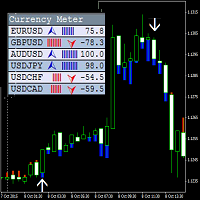
Данный индикатор рисует на графике стрелки, которые являются сигнала на вход и выход из сделки, а также в качестве фильтра индикатор окрашивает каждую свечу в синий и красный цвет. Дополнительно ко всему в левом верхнем окне показывается сила тренда и его направление по основным парам. У индикатора новая логика, которая существенно отличает его от множества аналогов. Он дает ранние сигналы на вход и на выход, свои значения не перерисовывает — то есть, если индикатор дал сигнал на вход в сделку,

The Perfect Supply & Demand Indicator for the MetaTrader 4 Platform ! It comes packed with the following features...
Supply & Demand Zones
The indicator charts Supply & Demand Zones on your favorite profiles. It works on all time frames and in all markets. Fresh & Used Zones
The indicator color codes each zone so that you know if it's fresh or not.
When the zone is no longer fresh it changes color, indicating that price have already traded at the level once or multiple times before. Stru
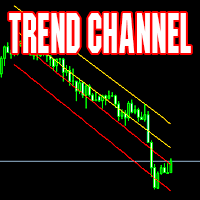
Индикатор каналов. Рассчитывается динамически. Подходит как для работы в направлении тренда, так и внутрь канала. Отличные результаты при работе на таймфреймах от 4Н по направлению в центр канала. Support: https://www.mql5.com/en/channels/TrendHunter Пример использования: при касании цены одной из крайних линий - открытие сделки в центр канала с тейк-профитом на ближайшей средней линии индикатора. Версия для МТ5 Индикатор можно использовать в советниках (4 буфера), получая данные стандартным с

Индикатор определяет самую важную составляющую любой торговой системы - возможную точку выхода из сделки.
По мере движения цены, в зависимости от рыночной ситуации, индикатор строит цели.
Цель становится актуальной, когда цена начинает движение в сторону цели.
Если движение сильное, то для его остановки или разворота может потребоваться некоторое количество целей. Скопление целей наиболее вероятно способно остановить цену.
Некоторые цели исполняются по нескольку раз.
Но графике о

Multi Information Panel designed to give alot more precision to both trade entries and exits and provide an instant snapshot of a currency pair’s movement. Multi Information Panel works on any currency or timeframe (or it should) and displays the following in the bottom right corner of the chart..
A graph of Stochastic Oscillators on timeframes M1 up to D1. An indication of the market trend using EMA’s on timeframes M1 to D1. The direction of the MACD on the current chart, and crossing of the

Volume, momentum, and market strength are key indications that price is about to move in a certain direction. The Volume-solution indicator is one indicator which can help traders objectively classify a momentum type of trade setup as one having volume and strength or not. What is the Volume-solution Indicator? The Trading Volume indicator is a custom technical indicator which works somewhat like a market sentiment indicator. It indicates the strength of the bulls and the bears of the market. Wh

Универсальный инструмент для определения трендов, флетов и торговли по графическим паттернам. Объединяет техники Гана, Эллиота, Мюррея.
Просто разместите его на графике и он покажет направление и скорость движения цены, выделит разворотные моменты.
Maltese cross поможет точно определять узловые моменты в истории, планировать торговые действия и сопровождать открытые сделки. Основные принципы Maltese Cross отображает линии Trend, Flat и Impulse до и после выбранного момента. Цена движется меж
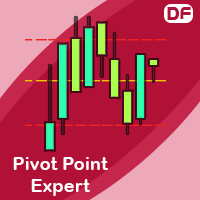
Pivot Point Expert Этот индикатор рассчитывает цены поддержки и сопротивления в мультитаймфреймах с различной формулировкой и рисует их на графике в том стиле, который вы выбираете. И, если хотите, индикатор может предупредить вас, когда текущая цена достигнет этих опорных уровней.
Временные рамки: ежечасно, ежедневно, еженедельно, ежемесячно
Формулировки: Классик, Камарилья, Вуди, Демарк, Пол, Фибоначчи
Параметры оповещения: отправить мобильное сообщение, отправить электронное пис

Action Alert indicator generates and writes data on the chart when performing any modification to the dead process. Expertise Properties: An audible alert is issued in the name of the operation and the labor that has been made You only need one chart Writes the processed operations in clear handwriting The font color can be controlled on the chart Setting Action Alert indicator
What is meant by it is to alert me any change in my deals of , it will reverse if any new deal comes out, a

With the purchase of the Auto-Harmonic Pattern Recognition Trading Software for MT4 , you will have access to: The Auto Harmonic Pattern recognition software is designed to take the heavy lifting out of a traders Harmonic trading strategy. The Software automatically Identifies and Projects Harmonic Pattern Completion Zones for the 6 most trade-able Harmonic Patterns. If the Pattern Completes in the projected zone, then there is a high probability of the resulting trade being successful. Pleas
The Better Volume indictator improves the comprehension on volume by coloring the classical histogram bars . The colors point out differents nature of volume . Further through two buttons and without change the main chart it is possibile to change the time frames and navigate among three symbols . The alerts will work accordingly. For each symbol can be choosed the LookBack and Ma periods . The possibility to show/hide the indicator allows you to focus on the price .
The subwindow can be hid
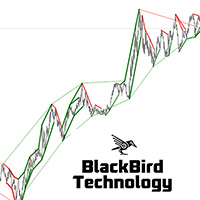
Multi Level Trend Direction is an indicator that identifies the most accurate buy/sell swing points with the highest probability, based on multi-level Zig Zag Swings. The indicator draws a color Zig Zag at the Higher Highs, Higher Lows, Lower Lows and Higher Lows in the chart, but based on two level Zig Zag Swing. If the fast price swing is in line with the trend of the slow price swing, then the buy/sell trend lines are bigger. If the price swing is against the trend, no lines are drawn to si

Представляем уникальный продукт для анализа эффективности стрелочных индикаторов !
С его помощью Вы сможете обработать сигналы любого стрелочного индикатора, узнать их эффективность, собрать статистику по успешным сигналам и подобрать лучшие параметры — все эти возможности заложены в настройках! Индикатор работает с сигналами стрелочных индикаторов, формируя из них сигналы. Arrow Trade собирает статистику сигналов: на табло отображается число и процент успешных и неуспешных. В наст

MA Bounce стратегия - это стратегия, которая направлена на открытие длинных позиций по валютным парам при сильном восходящем тренде, когда они отскакивают от своей поддержки в виде скользящей средней, и короткие позиции валютных пар при сильном нисходящем тренде, когда они отскакивают от сопротивления в виде скользящих средних. Лучшими подходящими периодами скользящих средних для этой стратегии являются 18, 30, 50. Этот индикатор помогает идентифицировать и находить место для потенциального вхо

This is a volume profile where you can customize the time period you want. You can do this with a line or choose automatic functions such as showing the volume from the last time period. The indicator also shows the maximum volume value (VPOC - VOLUME POINT OF CONTROL) and the average value, colors and settings you can adjust as you like, there are many possibilities. If you need an indicator that shows the constant volume time frames there is ...HERE... Volume Profile is an advanced charting
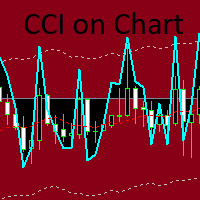
Индикатор CCi с динамическими уровнями на основе стандартной МА, взятой за основу отсчета уровней, и модифицированных данных стандартного CCi относительно МА. Входной параметр CutCCi если больше 0, ограничивает рисование графика CCi по вертикали, но не влияет на расчеты. Есть 3 варианта отображения стрелок: стрелки при пересечении уровней на выход из зоны уровней - тренд, стрелки на возврат после выхода из зоны уровней - реверс и пересечение нулевого уровня (красной линии МА). Можно отдельно
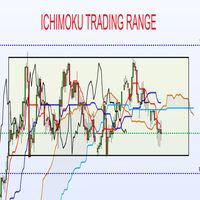
scanner de gamme commerciale Ichimoku: ne manqué plus le début d'une gamme. capable de suivre plusieurs paires cet indicateur surveille: les croisements de SSA et SSB (cela indique une forte possibilité de la mise en place d'un range) il identifie les bougies de retournements Il vous alerte quand les deux éléments apparaissent (croisement + bougies). vous pouvez ajouter le filtre du stochastique, ainsi l'alerte se fera seulement s'il y en compétemment le stochastique en surachat ou survente 80/

Concept of Market Profile was created at Chicago Board of Trade (CBOT) by trader Peter Steidlmayer and first published during the 1980s as CBOT product. Market profile by itself is not a stand-alone strategy, but a different way how you can view the market and make better trading decisions.
They have seen a market as an auction process which is affected by supply and demand the same way as every other auction, for example, development of prices of food, gas etc.
The price goes up as long

Индикатор строит "психологические уровни": уровни круглых чисел и промежуточные уровни круглых чисел.
Круглые числа играют важную роль в формировании уровней поддержки и сопротивления. Существует закономерность, при которой спад или рост цены может остановится на круглых числах.
Уровень, цена которого заканчивается на 0, является уровнем круглого числа первого порядка.
Промежуточный уровень, это уровень между двумя круглыми уровнями, например, между 10 и 20 это уровень 15.
В настр
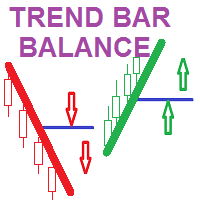
Trend Bar Balance Indicator Simple indicator based on trend detection and support resistance breakage It detects the major trend and the minor support and resistance levels *** a signal for UP /BUY is detected and alerted in a BULL trend and a resistance level break *** a signal for DOWN /SELL is detected and alerted in a Bear trend and a support level break THE POWER OF THIS INDICATOR I USE IT WHEN YOU COMBINE ITS DAILY SIGNALS FROM DIFFERENT CHART SYMBOLS AT SAME TIME AND CLOSE ALL ORDERS BY

ОПИСАНИЕ: Теория индикатора в том, что валюты, которые торгуются на европейской сессии - ночью спят. А проснувшись идут к золотой середине Фибоначчи, своим путем. Ночью формируется канал из которого они хотят выбраться, с утра с новыми силами в путь. Верхний уровень канала - зона покупки. Нижний уровень канала - зона продажи. Цели похода отмечены вверху и внизу цветами. Индикатор все параметры выдает в восемь буферов, которые можно прочитать програмно, для построения автоматических торговых сис

Many forex traders spend their time looking for that perfect moment to enter the markets or a telltale sign that screams "buy" or "sell". And while the search can be fascinating, the result is always the same. The truth is… there is no guaranteed way to trade the forex markets. As a result, traders must learn that there are a variety of indicators that can help to determine the best time to buy or sell a forex cross rate. Our indicator definitely does this! This strategy is created by traders fo
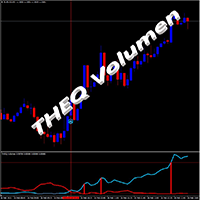
THEQ Volume отображает точный осциллятор громкости. Его можно использовать для торговли в соответствии с тенденциями или возможными изменениями тренда. THEQ Volume также включает в себя стрелки объема THEQ, индикатор с сигналами и предупреждениями, а также советник THEQ Volume EA для реального / демонстрационного использования, тестирования и оптимизации или создания собственной стратегии. Дополнительный индикатор и советник-робот отправляются отдельно после оплаты. THEQ Volume не перерисовывает
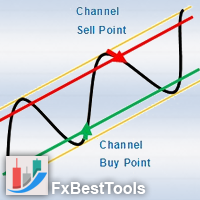
Channels Indicator is an All-In-One Indicator with a powerful calculation engine. The Indicator contains 4 different and usual methods for finding channels on the market. Indicator is powered by a visual interface and with various selections of alerts and notifications.
Testing Indicator : Strategy Tester does not respond to your clicks on panels (This is metatrader tester limitation). Thus input your desired settings on the indicator pre-settings and test.
Using Indicator :
Display
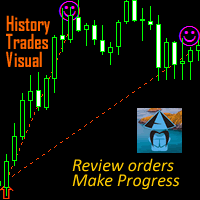
Name: History Trades Visual Purpose: Show history orders' open&close time&price ,drawing the route. You can review the trades, help analyzing and getting progress. Advantage: Easy to use, small and stable, no interference with other indicators and objects on charts.
Step of using: 1. List the history orders in account history page in MT4. 2. Click this indicator from the directory, then the history traders will be shown in the main chart for current symbol. 3. For better visual display acc

This indicator, Bull Bear Easy MTF, summarise the strength color graphic and percentage of power for both Bull and Bear in current market emotion stage which will show you in multi time frames and sum of the total Bull and Bear power strength which is an important information for traders especially you can see all Bull and Bear power in visualized graphic easily, Hope it will be helpful tool for you for making a good decision in trading.
MetaTrader Маркет - уникальная площадка по продаже роботов и технических индикаторов, не имеющая аналогов.
Памятка пользователя MQL5.community расскажет вам и о других возможностях, доступных трейдерам только у нас: копирование торговых сигналов, заказ программ для фрилансеров, автоматические расчеты через платежную систему, аренда вычислительных мощностей в MQL5 Cloud Network.
Вы упускаете торговые возможности:
- Бесплатные приложения для трейдинга
- 8 000+ сигналов для копирования
- Экономические новости для анализа финансовых рынков
Регистрация
Вход
Если у вас нет учетной записи, зарегистрируйтесь
Для авторизации и пользования сайтом MQL5.com необходимо разрешить использование файлов Сookie.
Пожалуйста, включите в вашем браузере данную настройку, иначе вы не сможете авторизоваться.