Смотри обучающее видео по маркету на YouTube
Как купить торгового робота или индикатор
Запусти робота на
виртуальном хостинге
виртуальном хостинге
Протестируй индикатор/робота перед покупкой
Хочешь зарабатывать в Маркете?
Как подать продукт, чтобы его покупали
Платные технические индикаторы для MetaTrader 4 - 57

El MACD ponderado, tiene las mismas caraterísticas del MACD simple, sólo que la diferencia es que se usan medias móviles ponderadas (LWMA) en lugar de simples (SMA) o exponenciales (EMA). Dibuja histograma. Dibuja una línea principal. Es especialmente útil para detectar divergencias alcistas y divergencias bajistas. También es muy útil para detectar divergencias alcistas y divergencias bajistas ocultas.
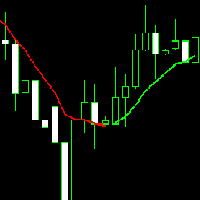
Linear Weighted Moving Average o Media Móvil Ponderada Lineal, es una media móvil que calcula los promedios de manera ponderada. Esta versión, además de las características regulares que poseen las demás Linear Weighted Moving Average o Medias Móviles Ponderadas Lineales, tiene también la propiedad de cambiar de color según las preferencias del usuario; puedes elegir un color para cuando la media móvil sea alcista y otro color cuando la media móvil sea bajista, o de lo contrario se puede elegir

Morning Stars points price reversals with high degree of accuracy and it is great for scalping on the 15 min time frame. Buy and sell arrows are shown on the chart as for entry signals. They do not repaint but confirmation entries .
*Non-Repainting *For Desktop MT4 Only *Great For Scalping *Great For Swing Trading *Arrow Entry Alerts *Arrow Signals alert Strictly On The "Close Of The Candle" *Works On 15Min Timeframe *Works On Any Mt4 Pair *Perfect For New Traders And Expert Traders
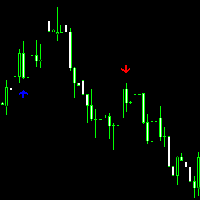
Este es un indicador que te avisa mediante flechas, cuando las medias móviles ponderadas (LWMA) de los periodos que hayas elegido, se crucen entre sí. Puedes elegir el color que quieras para cada una de las flechas, incluso puedes elegir un sólo color para las dos flechas. Cuando hay un cruce de medias alcista, sale una flecha hacia arriba, y cuando hay un cruce de medias bajista, sale una flecha hacia abajo. Como comenté al inicio, también puedes elegir el periodo de cada media móvil ponderada

TrendWavePattern an another way to trade with a harmonic pattern, a maestro classic pattern . I made some improvements and combinations with my own strategy. Trend direction, buy-sell signal ,hi-low area and pivot line. These will be helpful for trader to read the current market condition. So it is not blindly following the pattern itself but also following other informations from the market. Readable chart appearance . Designed to be user friendly even you are a new trader. BUY-SELL zone, Ta
Moving Averages Of ATR This indicator shows you Average of Average true Range. You can use this indicator for your own experts with iCustom() ATR is in the buffer ( 0 ) and moving average is in the buffer ( 1 ) there are afew parameters for using this indicator on different currencies and different time frames. you can test it and optimize it . Input Parameters: ATRPeriod: default is 13 SignalMaPeriod : default is 28 SignalMAMode : default is SSMA

This is a Multi-Time-Frame Zigzag indicator You can change parameters of Zigzag, include Zigzag Depth, Zigzag Deviation, Zigzag Backstep. You can choose which Time Frame to display Zigzag by turn ShowXXX to true or false (ShowXXX = ShowM1, ShowM5, ShowM15...). Noted: Lower Time Frame Zigzag will not display on Higher Time Frame. Example: Your current Time Frame is H1, you can not see Zigzag of M1 to M30 even you turn them on.

Nexxt Indicator This indicator shows you trend and also how strenght it is together. You can use this indicator for your own experts with iCustom() BlueBuffer is in the buffer ( 0 ) and GoldBuffer is in the buffer ( 1 ) there are afew parameters for using this indicator on different currencies and different time frames. Best Results are in M15 , H1 and H4 ( depends on currencies ) you can test it and optimize it . Input Parameters: Nexxt1: default is 7 Nexxt2: default is 14

Whatever you are expert class Forex trader or not, you must know how to make correlation analysis between different timeframes of the same symbol, and furthermore between different symbol. Now, open one or several symbols with different timeframes, apply this smart multi-timeframe mapping tool, drag and move the vertical anchor line to the destination bar position. Then you will see the correlation of Forex market clearly. Supports multiple timeframes synchronization and multiple symbols synchro
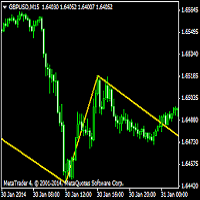
The Zig Zag indicator plots points on the chart whenever prices reverse by a percentage greater than a pre-chosen variable. Straight lines are then drawn, connecting these points. The indicator is used to help identify price trends. It eliminates random price fluctuations and attempts to show trend changes. L'indicateur Zig Zag peut être utilisé pour filtrer les mouvements de prix ... 1 Minute Indicators Used: RSI (30 / 70) Fibonacci (1 - 0.784)

T his system never paints. This system created by using Calculates the Standard Deviation indicator. This indicator is only working in M1 period. This system is for short term and profitable. BUY and SELL Orders Target is 30 Pipes. When the Market Order Reaches the Target or an order in the Reverse Direction is opened, the Pending Limit order is Closed. Signals are shown as arrows. as an optional limit orders. You can set a voice alarm or email notification. You can fins our

THIS IS DEFINITELY THE BEST INDICATOR ON THE MARKET Please book an appointment on our facebook page (www.facebook.com/wetrainfx)
Fantastic for scalping, swing trading and Intra-day tradering Arrows show direction ! You also get an early warning that a move is about to happen.
Mobile and desktop alerts.
Effective on any traded pair
Effective on any timeframe.
Perfect for new and old traders
THIS IS THE MT4 VERSION.
HOW TO USE 1. Open a few charts in 15min TF. 2.
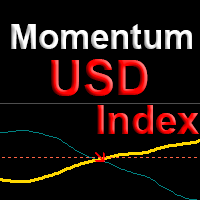
Индикатор показывает точки на продолжение тренда по валютным парам с участием доллара USD с вероятностью более 80%. Работа алгоритма основана на сравнении моментума текущей валютной пары с моментумом индекса доллара DX в текущий момент времени. Использование индекса доллара позволяет оценивать не только текущую пару, а целиком полную картину по всем мажорным валютам сразу. Данный подход увеличивает достоверность и уменьшает количество ложных срабатываний, позволяя строить новые стратегии с высо

Nexxt2 Indicator This indicator shows you trend and also how strenght it is together. You can use this indicator for your own experts with iCustom() BlueBuffer is in the buffer ( 0 ) and GoldBuffer is in the buffer ( 1 ) Strategy can be like this; Blue and Gold cross till Blue touch to level 1 or -1. These levels show us must be ready close position. It depends on you. there are afew parameters for using this indicator on different currencies and different time frames. Best Results are in H4 (
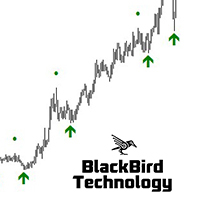
Multi Level Trend Swing is an indicator that identifies the most accurate buy/sell swing points with the highest probability, based on multi-level Zig Zag Swings. The indicator paints arrows at the Higher Highs, Higher Lows, Lower Lows and Higher Lows in the chart, but based on two level Zig Zag Swing. If the fast price swing is in line with the trend of the slow price swing, then the buy/sell arrows are biggest. If the price swing is against the trend, dots are displayed to signal a Higher High

This system never paints. This system uses 30 standard MT4 indicators. This indicator is only working in M5 period. This system is for long term and profitable. Signals are shown as arrows. as an optional limit orders. You can set a voice alarm or email notification. You can fins our other products from link : https://www.mql5.com/en/users/drbastem/seller Also, you can ask all your questins from email : haskayafx@gmail.com or mobile : +90 530 867 5076 or @MehmetBastem on teleg

This EA is an extension for the free trade indicator Trend Mate . https://www.mql5.com/en/market/product/50082
The main idea is to support your decision to trade according to the current trend. It is possible to configure alert and push notification to receive when entering to first candle for bull / bear trend.
For this extension of the free indicator now it is possible to filter the current trend info with other timeframes. For example show trend for timeframe M5 considering also timefra
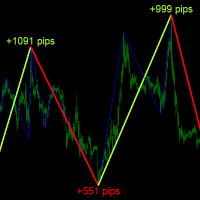
Описание
ABC Trend Detector - индикатор, который идентифицирует на рынке импульсы и тренды, и отображает их наличие на ценовом графике. Найденные паттерны рисуются в виде цветных соединительных линий между их максимумами и минимумами. Над/под каждым экстремумом отображается значение диапазона (количество пипсов) тренда.
Рекомендации
Вы можете использовать данный индикатор для определения тренда и соответственно для определения направления открытия позиции или закрытия противоположной
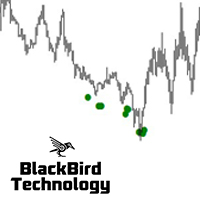
Multi MA Distance Signal Indicator is a no-nonsense, no delay, no repaint indicator ! Moving Average distance together with a trend filter is a 'simple', but very powerful and reliable signal. The current moving average distance for both a slow and a fast moving average is compared with the past MAD values. For two moving averages, all the distances between the Close price and the moving average (MAD) over a selected period of time are compared with the current MAD "Moving Average Distance". If

Fibonacci fast drawing tool with 4 outstanding features 1. Quick action by clicking on the candle 2. Draw the bottom of the selection exactly 3. Include Standard Fibo levels and display prices at levels 4. Draw extended fibo to identify the price zone after break out
Please see video clip below for more details. Free download link of FiboCandleClick indicator inside youtube.
Наклон скользящей средней Quants - очень мощный индикатор, указывающий направление и импульс. Индикатор не перерисовывается, можно эффективно рассчитать угол ma и найти тренд.
Подсчет прибыли начинается после закрытия сигнальной свечи. Так что это точные результаты, которые были бы вживую.
Предлагаемый таймфрейм использует его на H1. Все параметры индикатора доступны для редактирования.
Подсказки: торгуйте на колебаниях и в направлениях прорыва тренда. фракталы, ренко-бары и ленты Болин
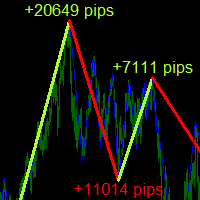
Описание
ABC Trend Detector Pro - индикатор, который идентифицирует на рынке импульсы и тренды, и отображает их наличие на ценовом графике. Найденные паттерны рисуются в виде цветных соединительных линий между их максимумами и минимумами. Над/под каждым экстремумом отображается значение диапазона (количество пипсов) тренда.
Рекомендации
Вы можете использовать данный индикатор для определения тренда и соответственно для определения направления открытия позиции или закрытия противоположной

FBO Trend Admiral is a professional yet simple to use trend following system. It detects the prevailing trend and gives entry points as arrows. To determine the trend it uses a unique filtering algorithm. Suitable for defining entry points for scalping as well as for intra-day trading. Features Works with the prevailing market trend. Suitable for all markets (currency pairs, metals and indices). Ideal for short time trading on the M1, M5 and M15 time frames. Does not redraw/repaint the arrows

FREE DOWNLOAD Understanding Support & Resistance Support and Resistance are critical levels used by market participants in making decisions. This level is used to determine whether the price will continue or reverse direction. If this Support and Resistance is combined with candlestick forms, it is believed that it will be able to determine the next movement. Economic support can be interpreted as a level where supply begins to decrease and demand increases so that if that happens, prices will
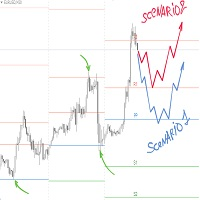
Pivot Point is a technical tool widely used by traders to predict major support and resistance price levels by calculating previous history and to predict the current price reversal points. Traders want to determine about the swing point from which there should be much possibility that the market price will be getting back, in such analysis pivot point plays an important rule. Different site explaining the logic of pivot point as:
A technical analysis indicator used to determine the overall t

The indicator displays 05 important parameters for traders 1. Display Bid -ASK price in big font 2. Display currency pair name and large time frame 3. TradeTick parameters 4. Swaplong and SwapShort 5. Point parameters used to calculate the price of SL or TP Indicators include 02 files supporting MT4 and MT5, You can download the link below. And follow the instructions of the video.
Инверсия тенденции DYJ обычно достигает высокого значения на дне рынка после панической продажи, которая привела к резкому падению цен.
Низкие значения этого индикатора обычно появляются на вершине крупного баланса и в течение длительного периода консолидации.
DYJ AtrTrendReversal можно интерпретировать на основе тех же принципов, что и другие индикаторы колебаний.
Принцип прогнозирования, основанный на этом показателе, может быть сформулирован следующим образом: чем выше значение индик

Трейдер использует индикатор Trend for Neuro для определения рыночной ситуации. Это трендовый алгоритм, который удобно скачать, установить и использовать. Алгоритм с приемлимой точностью генерирует входные сигналы и уровни выхода. Стратегия для торговли по тренду, фильтрация и все необходимые функции, встроенные в один инструмент! Запустив индикатор, пользователь увидит всего два типа стрелок, которые могут менять цвет на синий во время восходящего тренда, на красный во время нисходящего состаян

Для данного индикатора разработан новый алгоритм определения тренда. Алгоритм с приемлимой точностью генерирует входные сигналы и уровни выхода. Стратегия для торговли по тренду, фильтрация и все необходимые функции, встроенные в один инструмент! Принцип работы индикатора заключается в том, чтобы при размещении на график автоматически определять текущее состояние рынка, анализировать исторические данные, на основании исторических данных и выводить на экран трейдеру указания к дальнейшим действия

Индикатор Perspective Trend отслеживает рыночный тренд с очень высокой надежностью. Все точки пересечения будут идеальными точками, в которых изменяется направление тренда. Игнорируются резкие колебания цены, а также шумы вокруг усредненных цен. Сигнальные точки, места где изменяется цвет, можно использовать как точки потенциального разворота рынка. Алгоритм индиувтора реализует разновидность технического анализа, основанную на идее о том, что рынок имеет циклическую природу. Данную разработку

IntradayMagic прогнозирует характер ATR и тиковых объёмов на 1 сутки вперёд. Индикатор не перерисовывается и не отстаёт. Используя Intraday Magic вы можете значительно повысить качество торговли и избежать излишних рисков. По его показаниям можно детектировать кризисные состояния рынка и моменты разворота тренда, уточнять моменты и направления входов. Принцип действия индикатора
Периодические события, биржевые расписания, график работы банков, экспирации и прочие подобные события формируют стру

This indicator supports fast drawing of trendlines 1. Support drawing the next peak higher than the previous peak 2. Support drawing the lower peak after the previous peak 3. Support drawing the lower bottom of the bottom. 4. Support to draw the lower bottom higher than the previous bottom. 5. Support drawing trendline across the price zone. Peak connected vertex 6. Support drawing trendline across price range. Bottom connected Link to download and use for free. Including 02 files s

Вы уже устали от постоянных взлетов и падений? Не стоит становится жертвой неустойчивых движений рынка, пора уже как-то от этого избавиться! Уже сейчас вы можете воспользоваться решениями Business Trend, чтобы сбалансировать анализ ценового движения и получить более ясную картину поведения цены.
Business Trend - это трендовый индикатор для торговой платформы MetaTrader 4. Данный индикатор позволяет находить наиболее вероятные точки разворота тренда. Индикатор авторский такого вы больше не где

Henry - Индикатор по которому можно определять уровни и тренд. Индикатор рассчитывает уровни насыщенности ценового графика. Сигнал на выход из области перепродажи является сигналом на покупку. Сигнал на выход из области перекупки является сигналом на продажу. Обычно нужно задать относительные величины для уровня перекупленности и перепроданности Bottom и Top - для данного индикатора.
Чаще всего хороший тренд виден на ценовом графике визуально. Но опытный трейдер перед входом должен четко пон

High-accuracy trend indicators, please use in 1H timeframe,Try not to use it in other cycles,Can be used on any currency pair. This indicator is a trend indicator, which can accurately judge the trend. Can be combined with other indicators to increase accuracy. Can be used as a good entry point, will continue to optimize if you have any questions, please contact the author.
Channel Master - уникальный индикатор для автоматического поиска каналов. Этот индикатор полностью настраивается пользователем. Пользователь также может поместить больше экземпляров мастера канала на один график с другим размером канала для лучшей фильтрации тренда.
Для получения дополнительной информации посетите веб-сайт 747Developments.
Функции Простота использования (просто перетащите на диаграмму) Полностью регулируемый Доступно через функцию iCustom Возможность использования с любым т
LINEAR QUADRATIC ESTIMATION OF VELOCITY OSCILLATOR Linear quadratic estimation (LQE) is an algorithm that generates predictions of unknown variables observed over time using statistical noise and other inaccuracies and predicts a single measurement more accurately than those based on it. linear quadratic estimation of velocity oscillator shows trend. You can use this oscillator all pairs and on all timeframes. Better results are H1 and H4.
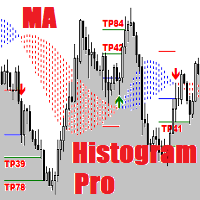
MA Histogram Pro is an expensive version of the indicator. It is equipped with the second Take Profit (TP) and is more equipped ( has a positive optimization method) than its cheaper brother. Simple and effective system with automatic optimization. See my forecasts .
MA Histogram are used primarily as trend indicators and also identify support and resistance levels.
Equipment:
Take Profit 1 Take Profit 2
Stop Loss Automatic optimization Result R/R Consecutive losses

Kalman Filter Velocity Oscillator Kalman filter is an algorithm that uses a series of measurements observed over time, containing statistical noise and other inaccuracies. The filter was originally designed to work with noisy data. Also, it is able to work with incomplete data. Another advantage is that it is designed for and applied in dynamic systems; our price chart belongs to such systems. This Oscillator works all pairs, all timeframes, on separete windows and zero based oscillator.
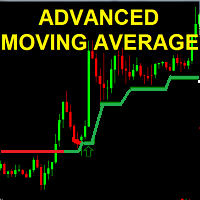
the Advanced MOVING AVERAGE indicator This is a formula of moving average based on support and resistance levels Two Colors indicator : UP trend --> Green Down trend -->Red Arrows UP/Down are shown for trend reversal indication ALERTS and mobile Push NOTIFICATIONS Simple Strategy : BUY on price over new green line Sell on price under new red line
Works on any TIMEFRAME MAin Input for calculation : index = 20.. 50..100..500 ... 1000 (Lower time frame -> Hi

TWO PAIRS SQUARE HEDGE METER INDICATOR Try this brilliant 2 pairs square indicator It draws a square wave of the relation between your two inputs symbols when square wave indicates -1 then it is very great opportunity to SELL pair1 and BUY Pair2 when square wave indicates +1 then it is very great opportunity to BUY pair1 and SELL Pair2 the inputs are : 2 pairs of symbols then index value : i use 20 for M30 charts ( you can try other values : 40/50 for M15 , : 30 for M30 , : 10 for H1 ,

Индикатор показывает ключевые объёмы, подтверждённые движением цены.
Индикатор позволяет анализировать объёмы по направлению, по частоте появления, по их значению.
Есть 2 режима работы: с учётом тренда и без учёта тренда (если параметр Period_Trend = 0, то тренд не учитывается; если параметр Period_Trend больше нуля, то в объёмах учитывается тренд).
Индикатор не перерисовывается .
Настройки History_Size - размер рассчитываемой истории. Period_Candle - период волатильности. Mult_RS -

With this indicator, you can easily make price regions in all time zones. In addition, with the automatic supply demand finder, you can ensure that the new regions are found automatically. You can increase your transaction quality by reaching more accurate operations with this auxiliary Tool and indicator.
I share your trial version of EURUSD for free with you. If you want to buy the working version in all parities, you can contact me. +New version Gap Bar Add ( Press G keyboard ) +Redsword

OscillatorMotion - индикатор выполнен в виде осциллятора и показывает направление движения цены. Для удобства пользования и более точной настройки индикатора можно изменять период, количество предыдущих свечей или баров, которое индикатор берет для анализа. Так же есть функции alert и push-уведомлений. Индикатор работает на любой валютной паре и на любом таймфрейме. Входные параметры: period - количество предыдущих баров для анализа AlertSignal - включить функцию да/нет PushSignal - включить фун

Индикатор MT4 для профессионалов. Задача индикатора - определить будущее поведение цены. Он определяет и рисует на графике: вершины и низинки волн в выбранном диапазоне цен линии прогнозируемых каналов на которых задерживается цена зоны вероятного горизонтального канала( флета) уровни Фибоначчи уровни на круглых значениях цены уникальные линии по вершинам волн. процент коррекции или импульса текущей и предыдущей волны время до окончания текущего бара. Принцип работы основан на разработанной но
Индикатор разработан для Рынков форекс Алгоритм основан на Moving average и нескольких фильтрах. Когда входить в сделки Синяя стрелка это сигнал на покупку Красная стрелка это сигнал на продажу Рекомендуемые параметры установлены по умолчанию Бля фильтрации сигналов можно использовать Moving average Period 30 Method linear Weighted Apply High Так же можно использовать Alligator, Bollinger bands, RSI...

MostTransactions - индикатор анализирует какие транзакции преобладают на рынке в данный момент покупки или продажи. Как правило если большинство трейдеров продает, то цена идет вверх, если преобладают покупки, то цена идет вниз. Таким образом крупные игроки заставляют обычных трейдеров терпеть убытки. Этот индикатор призван решить данную проблему. Если количество сделок на покупку превышает определенное среднее значение, то на графике появляется зеленая точка и следует ожидать движения вниз, есл

The principle of this indicator is very simple: detecting the trend with Moving Average, then monitoring the return point of graph by using the crossing of Stochastic Oscillator and finally predicting BUY and SELL signal with arrows, alerts and notifications. The parameters are fixed and automatically calculated on each time frame. Example: If you install indicator on EURUSD, timeframe M5: the indicator will detect the main trend with the Moving Average on this timeframe (for example the Moving
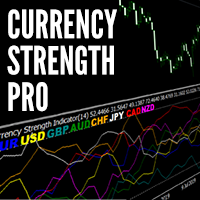
The Currency Strength Meter is the easiest way to identify the strongest and weakest currencies in the market. It works by applying clever calculations to 28 Forex pairs to establish which currencies are the driving force behind price action. By trading strength against weakness, we can greatly increase our chances of success and find some of the highest probability trends to trade. Technical Information
The strength meter uses the relative strength meter which is applied to all 8 major curren

The principle of this indicator is very simple: detecting the trend with Moving Average, then monitoring the return point of graph by using the crossing of Stochastic Oscillator and finally predicting BUY and SELL signal with arrows, alerts and notifications. The parameters are fixed and automatically calculated on each time frame. Example: If you install indicator on EURUSD, timeframe M5: the indicator will detect the main trend with the Moving Average on this timeframe (for example the Moving

BPS Panel
Breakout Pro Scalper Solution Panel
This indicator is part of the RPTrade Pro Solutions systems. BPS Panel is a daily trend indicator using Price Action, Dynamic Support and Resistances. It's designed to be used by anyone, even the absolute beginner in trading can use it. NEVER repaints . Indications are given from close to close . Designed to be used alone , no other indicators are required. Gives you the trend and potential Take Profit at the beginning of the day.
How
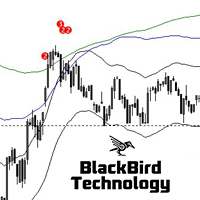
Multi MA Band Signal Indicator is a no-nonsense, no delay, no repaint indicator !
Moving Average bands together with a RSI filter is a 'simple', but very powerful and reliable signal.
Five "moving average bands" generate the signals. By default : MA25, 50, 100, 200 and 400. This can be changed in the parameters as well as the MA mode and the MA band deviation. The signal indicates the number of moving average bands that are crossed. The higher the value the stronger the signal. Two signal l

Scalping Line - это усовершенствованная средняя которую мы создали для применения в своей торговой стратегии. Суть нашей торговой стратегии заключается в том, чтобы открывать сделку на покупку, когда линия синего цвета, а цена опускается ниже линии. Или открывать сделку на продажу, когда цена поднимается выше линии, а цвет линии красного цвета. Таким образом мы открываем сделки когда цена на небольшое расстояние идет в противоположенную от общего тренда сторону. Закрываем сделку при получении м

This is a small and simple indicator for MetaTrader 4. It displays necessary information for current symbol such as : Symbol name. Total of sell volumes (lots). Total of buy volumes (lots). Total profit or loss. Some properties of this indicator such as 'Font Size', 'Text Color', 'Position', etc are customizable for your best experience. Hope this indicator helps you succeed in your trade.

Это торговая система построена на рыночных импульсах разной сложности.
Для формирования сигнала, индикатор использует моменты, когда направление импульса и необходимого участка тенденции совпадают. А также индикатор учитывает волатильность рынка в текущий момент. Метки Stop_Loss можно установить с параметром "0" или "1", тогда Stop_Loss будет учитывать волатильность на рынке.
Метки Take_Profit можно установить с параметром "0", тогда Take_Profit будет учитывать волатильность на рынке
Индикатор для бинарных опционов и скальпинга на рынках форекс рекомендуемое время експирации 1-2 свечи таймфреймы до M30 сигналы когда появится синяя точка это сигнал на покупку когда появится красная точка это сигнал на продажу сигналы появляются вместе со свечой сигналы не исчезают индикатор разработан на эксклюзивном алгоритме такого вы не встретите нигде рекомендуется избегать торговли во время выхода сильных новостей
The brand new trading indicator Trendline Tunnel is presented by KING.Ai. This indicator were built base on the the theory of Latest Up and Down Trend line . Latest Trend are difficult can by seen by human eye. Indicator can help to identical the Trend . KING.Ai Forex trader mainly use this strategy to "See Through" market . We do believe that it is a powerful method to show the latest trend and do the breakout trade strategy . General speaking, Trendline Tunnel have following using: Method
Trend Direction Estimation * Please use the free demo before renting or buying. This indicator works in all kinds of frames and presents you the trend in the time period you choose. This trial period (Rental for 1 month) offered for promotion is valid for a limited number of copies. At the end of the trial period, longer term rental and unlimited purchase options will also be opened in it's new prices. My expert advisor work is continuing for the strategies I have been developing for the Trend

Trend Direction Arrows * Please use the free demo before renting or buying. This indicator works in all kinds of frames and presents you the trend in the time period you choose. You can try to enter the bars in the bars where the arrows are formed or it helps you to understand the trend direction in the time period you look at. This trial period (Rental for 1 month) offered for promotion is valid for a limited number of copies. At the end of the trial period, longer term rental and unlimited pu
Описание
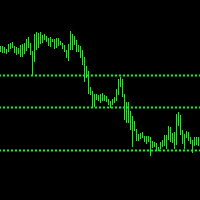
ABC Trend Levels Pro - индикатор, который идентифицирует на рынке тренды и важные трендовые уровни поддержки и сопротивления.
Рекомендации
Вы можете использовать данный индикатор для определения тренда и соответственно для определения направления открытия позиции или закрытия противоположной позиции.
Параметры
===== _INDICATOR_SETTINGS_ ===== - настройки расчета индикатора Maximum History Bars - максимальное количество баров истории для расчета индикатора. Average True Range

Fourteen plus nine What is it for? Applying Tom DeMark’s TD Sequential serves the purpose of identifying a price point where an uptrend or a downtrend exhausts itself and reverses. . What are the main components of TD Sequential? TD Sequential has two parts – TD Setup and TD Countdown. The first phase of TD Sequential starts with a TD Setup and is completed with a 9 count. When the 9 count is completed, it is at that point, a price pause, price pullback, or reversal is likely. It is also at tha

Индикатор Unexpected на удивление прост в использовании. Вы оцените простоту индикатора в первые же дни торговли. Если правильно определить начало тренда, результат сделки буде соответственный. Торговля на основе показателей тренда самая простая и, зачастую, самая эффективная. Если же вы используете в качестве базы живой график бинарных опционов, шансы на успех становятся еще выше.
Данный индикатор может отследить устойчивое движение цены в определенном направлении. При этом само движение мо
Mean Reversion Probability indicator is a tool based on a mathematical theory of mean reversion . As the markets very often shows the behavior of diverging from its mean, up to a certain distance, and then start to converge its mean again. This is a very well known phenomenon in stochastic processes and the price series is also a stochastic variable so we apply certain mathematical and statistical procedures to estimate the turning point .
Using Mean Reversion indicator, traders could potential
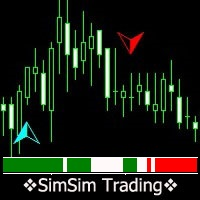
Индикатор просчитывает и суммирует данные от 25-и стандартных индикаторов. В результате расчета получаем текущий уровень сигнала. Во входных параметрах указываем минимальный уровень сигнала. Этот уровень отображается в виде гистограммы (основной индикатор ) и стрелки индикатора (второй индикатор). Положительные значения сигнала говорят о возможной покупке, отрицательные о продаже. В индикаторе реализована система тестирования, которую можно опробовать, скачав демонстрационную версию. И основно
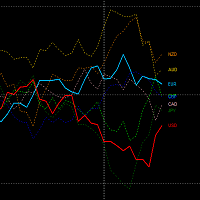
Этот индикатор позволит вам отслеживать относительную силу отдельных валют во всей денежной корзине.
Получение информации о силе валют будет простым и немедленным, равно как и выявление любых различий.
Можно иметь три разных режима отображения. Фактически, можно выбрать отображение всех валют, валют текущего символа в качестве доказательства по сравнению с остальной частью корзины, или выделить и отобразить только валюты символа, на котором мы находимся.
Он работает на всех таймфреймах, н

The principle of this indicator is very simple: detecting the trend with Moving Average, then monitoring the return point of graph by using the crossing of Stochastic Oscillator and finally predicting BUY and SELL signal with arrows, alerts and notifications. The parameters are fixed and automatically calculated on each time frame. Example: If you install indicator on EURUSD, timeframe M5: the indicator will detect the main trend with the Moving Average on this timeframe (for example the Moving

Индикатор разработан для бинарных опционов и коротко срочных сделок на форекс В ходить в сделку когда появился сигнал синяя стрелка вверх покупать красная стрелка в низ сигнал на продажу Для форекс входить по сигналу выходить по противоположному сигналу или тейкпрофиту Для бинарных опционов Входить на 1 свечу эсли сделка зашла в минус ставим догон на следующей свечи Работает на всех таймфреймах Если применить фильтра На пример Rsi получится хорошая надёжная стратегия.. Алгоритм находится на ста

This indicator will draw monthly, weekly, and daily pivot. Pivot line will be calculated automatically again when the period ends. Auto Pivot Metatrader 4 Indicator The Auto Pivot indicator for Metatrader 4 automatically updates the pivot point (PP), support (S1,S2,S3) and resistance levels (r1,r2,r3) every day. Price above the pivot point means positive while price below the pivot point means negative. S3 indicates extremely oversold while price above resistance r3 means extremely overbought.

Индикатор. "Индикаторные Волны ".
Используя 23-и стандартных индикатора и авторский алгоритм, рассчитываются уровни покупок (от 0 до +100) и продаж (от 0 до -100).
Далее используя рассчитанные уровни, "Индикатор Волны" рисует волну с 21 средними скользящими.
Номер волны равен периоду усреднения, рассчитанных уровней.
Волны 1 - 7 быстрые скользящие средние
Волны с 8 -14 средние скользящие средние
Волны с 15-21 медленные скользящие средние
Глядя на фигуры, которые
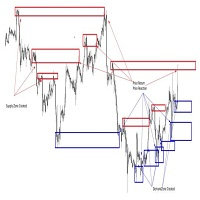
While most traders use various technical indicators, the price action is basically determined by the buying and selling activity. This is how support and resistance levels, which are commonly used terms in technical analysis is formed.
Traders know that when price reaches a support level, price can bounce off this support. This is also known as a level where this is high demand. A high demand area forms when there are more buyers than sellers.
In trading, investors tend to buy at the suppo
MetaTrader Маркет - торговые роботы и технические индикаторы для трейдеров, доступные прямо в терминале.
Платежная система MQL5.community разработана для сервисов платформы MetaTrader и автоматически доступна всем зарегистрированным пользователям сайта MQL5.com. Ввод и вывод денежных средств возможен с помощью WebMoney, PayPal и банковских карт.
Вы упускаете торговые возможности:
- Бесплатные приложения для трейдинга
- 8 000+ сигналов для копирования
- Экономические новости для анализа финансовых рынков
Регистрация
Вход
Если у вас нет учетной записи, зарегистрируйтесь
Для авторизации и пользования сайтом MQL5.com необходимо разрешить использование файлов Сookie.
Пожалуйста, включите в вашем браузере данную настройку, иначе вы не сможете авторизоваться.