Conor Mcnamara / Perfil
- Informações
|
2 anos
experiência
|
7
produtos
|
5
versão demo
|
|
0
trabalhos
|
0
sinais
|
0
assinantes
|
I started learning C programming in 2010. From there I picked up many languages.
I'm working on several indicator projects and EA concepts.
Conor Mcnamara
The answer is 2, it's still going down.
Because THAT is known as a liquidity trap which traps a lot of novice traders.
Conor Mcnamara
Trading quiz.
Where do you think the price is going?
1. Support is found, it's going up again
2. Still going down
Where do you think the price is going?
1. Support is found, it's going up again
2. Still going down
Conor Mcnamara
My next project is to create a system that allows you to buy and sell manually in the actual EA strategy tester. I don't even know if this works yet. But I think that if we could test our strategy AT SPEED it would be good.
Conor Mcnamara
Publicado o código Indicator loader for strategy testing
Um sistema para testar até quatro indicadores ao mesmo tempo no testador de estratégias
Compartilhar nas redes sociais
347
988
Conor Mcnamara
Publicado o código Zigzag Custom Timeframe
É o ziguezague clássico com uma entrada de período de tempo para exibir um ziguezague HTF em um gráfico LTF
Compartilhar nas redes sociais · 1
420
901
Conor Mcnamara
Publicado o código OHLC Candles with extreme tick price tracking
Esse é um gráfico de velas OHLC que registra a maior oferta de compra e a menor oferta de venda em cada nova barra
Compartilhar nas redes sociais
387
674
Conor Mcnamara
Publicado o código OHLC Candles with Ask and Bid
Um gráfico de velas que conecta o preço de venda e o preço de compra com a máxima e a mínima das velas
Compartilhar nas redes sociais · 1
316
587
Conor Mcnamara
Conor Mcnamara
2025.10.11
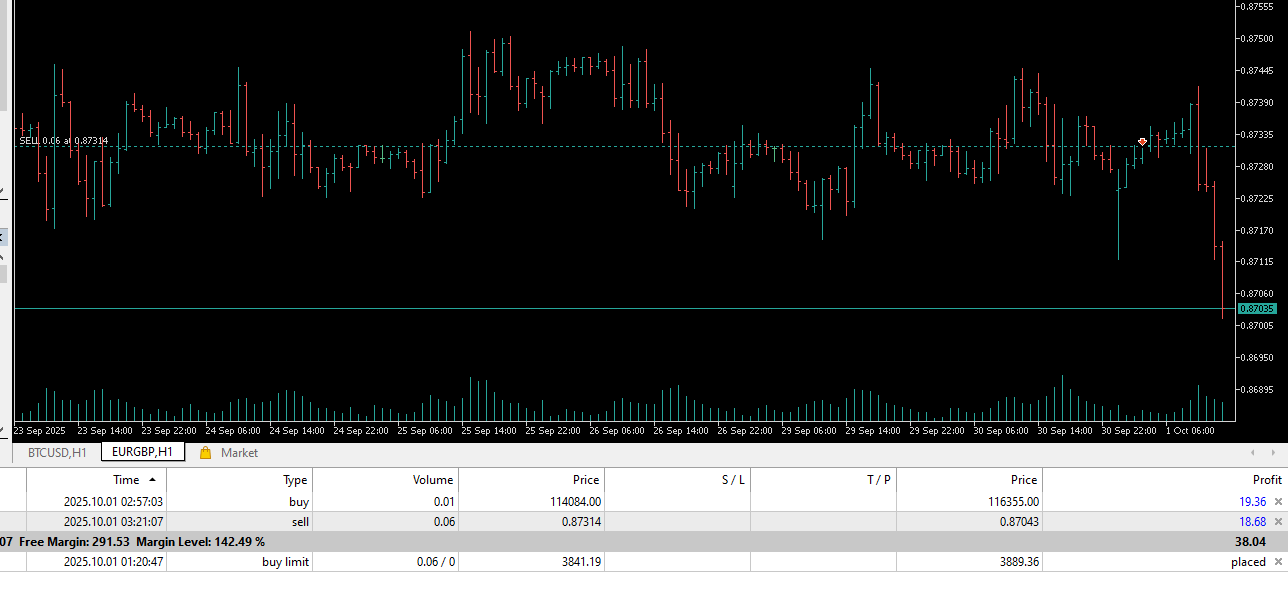
This was a manual trade. It was a Sell Limit placed at the daily vwap price when the dollar gained strength again. I would say this trade was a bit of luck too to get such a bid price
Conor Mcnamara
Publicado o código Trading Session Mapping
Uma ferramenta para alinhar os nomes das sessões de negociação com o horário do servidor da corretora e o horário local
Compartilhar nas redes sociais
344
840
Conor Mcnamara
Publicado o código Volatility Step Channel
Um canal que calcula as máximas e mínimas locais com linhas ajustadas à volatilidade
Compartilhar nas redes sociais · 1
376
846
Conor Mcnamara
this was another entry on the VWAP price
the way I see it, whether you buy or sell at this price, there's some profit there eitherway
I am on a demo account performing these tests where I put indicators into live testing
the way I see it, whether you buy or sell at this price, there's some profit there eitherway
I am on a demo account performing these tests where I put indicators into live testing
Conor Mcnamara
this entry was the VWAP price at the time I placed the buy limit, it seems like a good indicator to me, and it's downloadable on the codebase
Conor Mcnamara
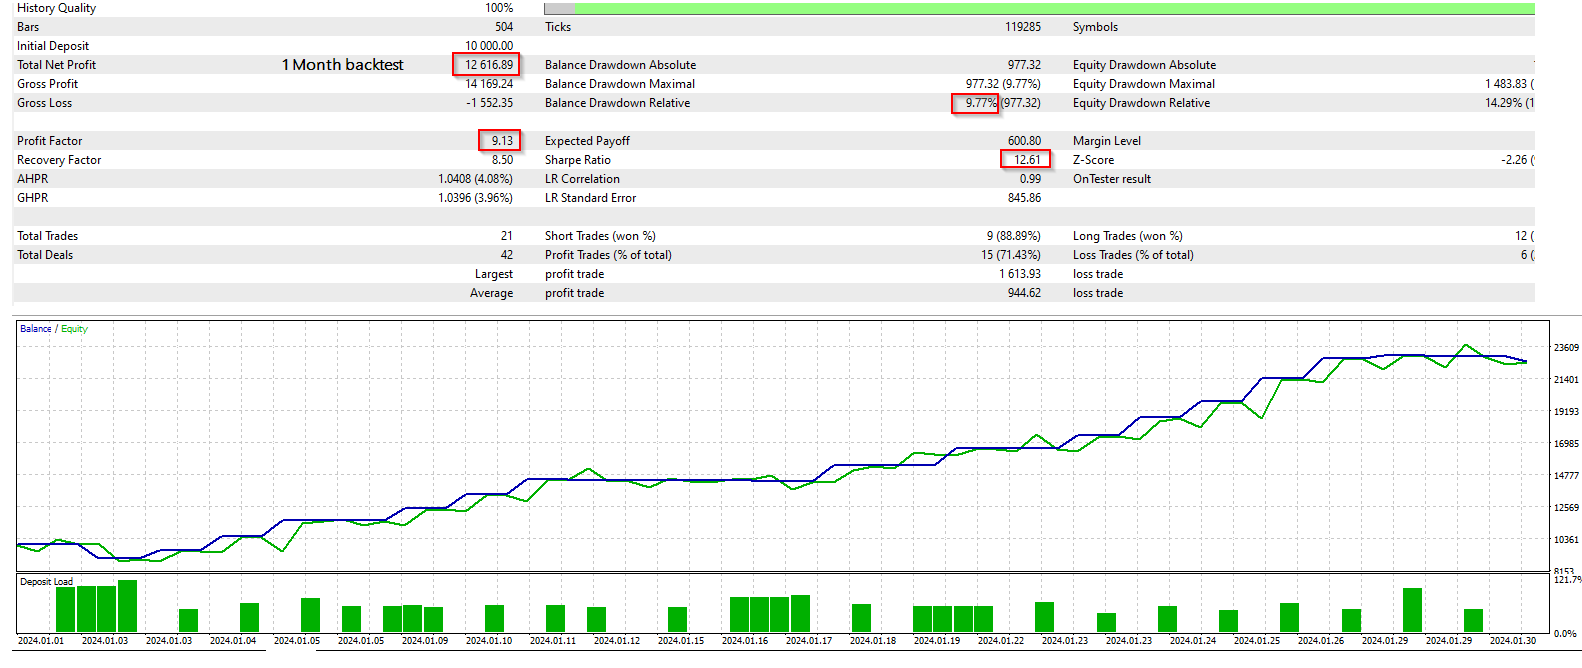
I used to think that from a 10K account and 1:33 leverage, a 1 month profit of 1 - 2K would be very good. But this current strategy is showing much greater alpha in one month.While I know that not every month can be the same, and that one month historical backtest means nothing for the future, it gives me an indication that this strategy has substance if it can show results like that. This is the power of ATR.
Conor Mcnamara
By not immediately executing a trade upon a signal...you can refine entries using states. It's just a bit more work.
Conor Mcnamara
It's crazy to think that technical analysis in financial markets borrowed from mechanical engineering, electrical engineering, statistics and probability theories, geospatial engineering, thermodynamics, neuroscience....the list goes on
Conor Mcnamara
A promising work underway..
- Candles are colored based on IDWMA price cross, noise, momentum, and doji patterns
- Extreme channel to calculate extreme prices on the last 30 bars
- ATR bands from the IDWMA price
Buy:
Previous and current green candle
Bid price is below the midpoint of the extreme channel
Bid price is above the 50 period EMA
Position stop loss trails on ATR band
Sell:
Previous and current red candle
Bid price is above the midpoint of the extreme channel
Bid price is below the 50 period EMA
Position stop loss trails on ATR band
- Candles are colored based on IDWMA price cross, noise, momentum, and doji patterns
- Extreme channel to calculate extreme prices on the last 30 bars
- ATR bands from the IDWMA price
Buy:
Previous and current green candle
Bid price is below the midpoint of the extreme channel
Bid price is above the 50 period EMA
Position stop loss trails on ATR band
Sell:
Previous and current red candle
Bid price is above the midpoint of the extreme channel
Bid price is below the 50 period EMA
Position stop loss trails on ATR band
[Excluído]
2025.10.03
[Excluído]
Aleksandr Poluchin
2026.07.21
I see that some of the trades are not done exactly as described. and it would be interesting to know what indicators are in this setup
Conor Mcnamara
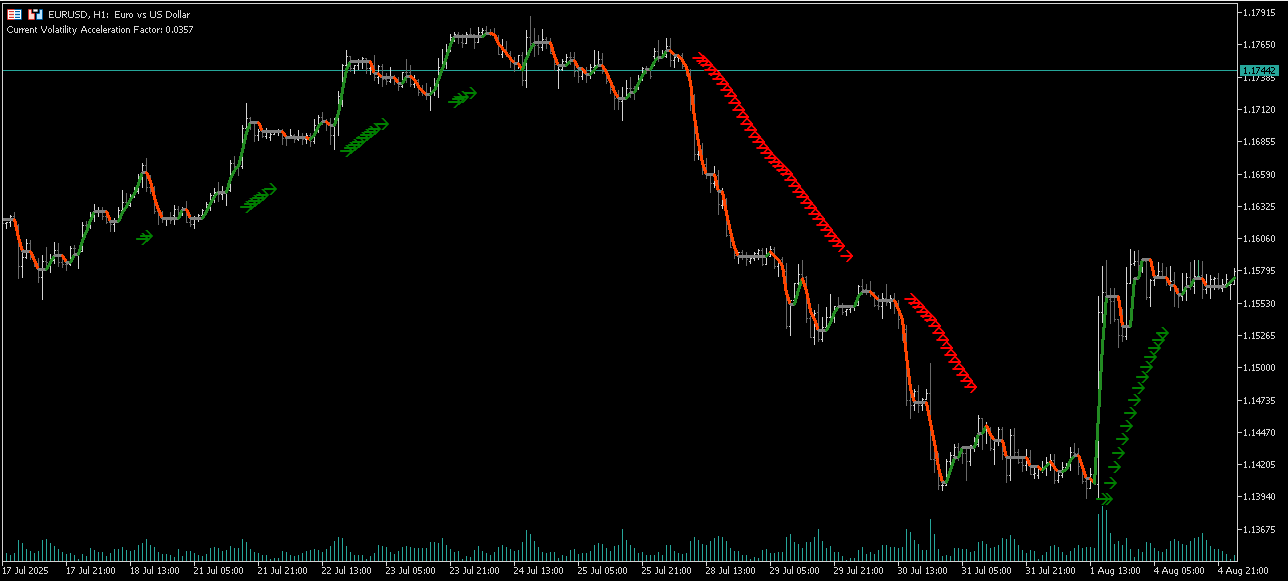
There are some shortcomings in the Parabolic SAR.
It traditionally used a fixed acceleration factor and didn't account for volatility, and this made it give bad signals in choppy markets. It also didn't care about price momentum, so it always had a signal while disregarding the fact that sometimes it's not good to trade.
I'm building a Custom SAR which is accelerating based on volatility (fully dynamic acceleration factor), and looking for valid momentum. If there is no valid momentum, the signal is removed on these bars.
It traditionally used a fixed acceleration factor and didn't account for volatility, and this made it give bad signals in choppy markets. It also didn't care about price momentum, so it always had a signal while disregarding the fact that sometimes it's not good to trade.
I'm building a Custom SAR which is accelerating based on volatility (fully dynamic acceleration factor), and looking for valid momentum. If there is no valid momentum, the signal is removed on these bars.
Conor Mcnamara
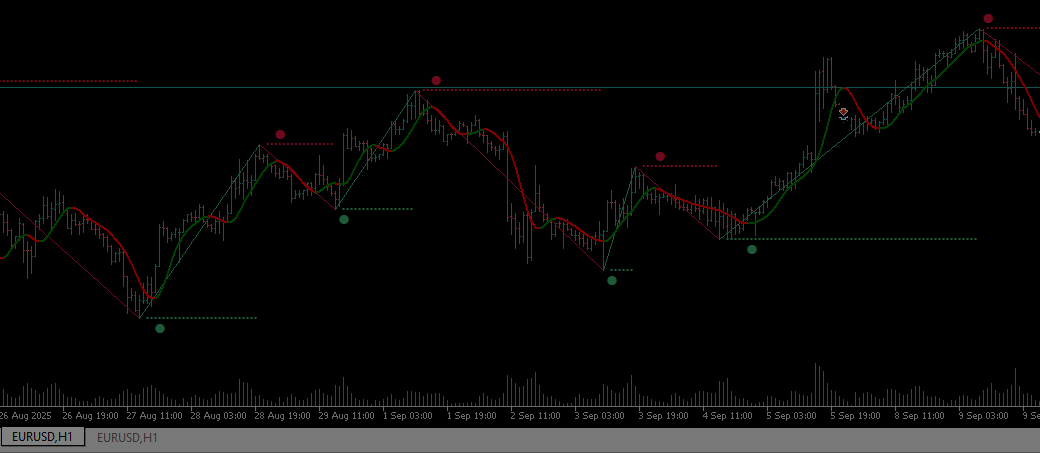
How can we calculate the trend change on time from extreme pivots?
- Zigzag algo extended to find when the leg stops moving
- When the leg stops moving, the trend change is analysed from a non lagging moving average
- Now it is calculating only the moving average trend changes relating to pivots
- All other fleeting moving average trends are ignored
- Zigzag algo extended to find when the leg stops moving
- When the leg stops moving, the trend change is analysed from a non lagging moving average
- Now it is calculating only the moving average trend changes relating to pivots
- All other fleeting moving average trends are ignored
: