Young Ho Seo / Perfil
- Informações
|
10+ anos
experiência
|
0
produtos
|
0
versão demo
|
|
4
trabalhos
|
0
sinais
|
0
assinantes
|
Harmonic Pattern Indicator - Repainting + Japanese Candlestick Pattern Scanner + Automatic Channel + Many more
https://www.mql5.com/en/market/product/4488
https://www.mql5.com/en/market/product/4475
https://algotrading-investment.com/portfolio-item/harmonic-pattern-plus/
Non Repainting and Non Lagging Harmonic Pattern Indicator – Customizable Harmonic + Japanese Candlestic Pattern Scanner + Advanced Channel + Many more
https://www.mql5.com/en/market/product/41993
https://www.mql5.com/en/market/product/41992
https://algotrading-investment.com/portfolio-item/profitable-pattern-scanner/
Supply Demand Indicator – Multiple Timeframe Scanning Added + Non Repainting + Professional Indicator
https://www.mql5.com/en/market/product/40076
https://www.mql5.com/en/market/product/40075
https://algotrading-investment.com/portfolio-item/ace-supply-demand-zone/
Momentum Indicator – Path to Volume Spread Analysis
https://www.mql5.com/en/market/product/30641
https://www.mql5.com/en/market/product/30621
https://algotrading-investment.com/portfolio-item/excessive-momentum-indicator/
Elliott Wave Indicator for the Power User
https://www.mql5.com/en/market/product/16479
https://www.mql5.com/en/market/product/16472
https://algotrading-investment.com/portfolio-item/elliott-wave-trend/
Forex Prediction - Turn Support and Resistance to the Advanced Strategy
https://www.mql5.com/en/market/product/49170
https://www.mql5.com/en/market/product/49169
https://algotrading-investment.com/portfolio-item/fractal-pattern-scanner/
MetaTrader 4 and MetaTrader 5 Product Page: https://www.mql5.com/en/users/financeengineer/seller#products
Free Forex Prediction with Fibonacci Analysis: https://algotrading-investment.com/2020/10/23/forex-prediction-with-fibonacci-analysis/
Free Harmonic Pattern Signal: https://algotrading-investment.com/2020/12/17/harmonic-pattern-signal-for-forex-market/
============================================================================================================================
Here are the trading education books. We recommend reading these books if you are a trader or investor in Forex and Stock market. In the list below, we put the easy to read book on top. Try to read the easy to read book first and try to read the harder book later to improve your trading and investment.
First Link = amazon.com, Second Link = Google Play Books, Third Link = algotrading-investment.com, Fourth Link = Google Books
Technical Analysis in Forex and Stock Market (Supply Demand Analysis and Support Resistance)
https://www.amazon.com/dp/B09L55ZK4Z
https://play.google.com/store/books/details?id=pHlMEAAAQBAJ
https://algotrading-investment.com/portfolio-item/technical-analysis-in-forex-and-stock-market/
https://books.google.co.kr/books/about?id=pHlMEAAAQBAJ
Science Of Support, Resistance, Fibonacci Analysis, Harmonic Pattern, Elliott Wave and X3 Chart Pattern (In Forex and Stock Market Trading)
https://www.amazon.com/dp/B0993WZGZD
https://play.google.com/store/books/details?id=MME3EAAAQBAJ
https://algotrading-investment.com/portfolio-item/science-of-support-resistance-fibonacci-analysis-harmonic-pattern/
https://books.google.co.kr/books/about?id=MME3EAAAQBAJ
Profitable Chart Patterns in Forex and Stock Market (Fibonacci Analysis, Harmonic Pattern, Elliott Wave, and X3 Chart Pattern)
https://www.amazon.com/dp/B0B2KZH87K
https://play.google.com/store/books/details?id=7KrQDwAAQBAJ
https://algotrading-investment.com/portfolio-item/profitable-chart-patterns-in-forex-and-stock-market/
https://books.google.com/books/about?id=7KrQDwAAQBAJ
Guide to Precision Harmonic Pattern Trading (Mastering Turning Point Strategy for Financial Trading)
https://www.amazon.com/dp/B01MRI5LY6
https://play.google.com/store/books/details?id=8SbMDwAAQBAJ
http://algotrading-investment.com/portfolio-item/guide-precision-harmonic-pattern-trading/
https://books.google.com/books/about?id=8SbMDwAAQBAJ
Scientific Guide to Price Action and Pattern Trading (Wisdom of Trend, Cycle, and Fractal Wave)
https://www.amazon.com/dp/B073T3ZMBR
https://play.google.com/store/books/details?id=5prUDwAAQBAJ
https://algotrading-investment.com/portfolio-item/scientific-guide-to-price-action-and-pattern-trading/
https://books.google.com/books/about?id=5prUDwAAQBAJ
Predicting Forex and Stock Market with Fractal Pattern: Science of Price and Time
https://www.amazon.com/dp/B086YKM8BW
https://play.google.com/store/books/details?id=VJjiDwAAQBAJ
https://algotrading-investment.com/portfolio-item/predicting-forex-and-stock-market-with-fractal-pattern/
https://books.google.com/books/about?id=VJjiDwAAQBAJ
Trading Education Book 1 in Korean (Apple, Google Play Book, Google Book, Scribd, Kobo)
https://books.apple.com/us/book/id1565534211
https://play.google.com/store/books/details?id=HTgqEAAAQBAJ
https://books.google.co.kr/books/about?id=HTgqEAAAQBAJ
https://www.scribd.com/book/505583892
https://www.kobo.com/ww/en/ebook/8J-Eg58EDzKwlpUmADdp2g
Trading Education Book 2 in Korean (Apple, Google Play Book, Google Book, Scribd, Kobo)
https://books.apple.com/us/book/id1597112108
https://play.google.com/store/books/details?id=shRQEAAAQBAJ
https://books.google.co.kr/books/about?id=shRQEAAAQBAJ
https://www.scribd.com/book/542068528
https://www.kobo.com/ww/en/ebook/X8SmJdYCtDasOfQ1LQpCtg
About Young Ho Seo
Young Ho Seo is an Engineer, Financial Trader, and Quantitative Developer, working on Trading Science and Investment Engineering since 2011. He is the creator of many technical indicators, price patterns and trading strategies used in the financial market. He is also teaching the trading practice on how to use the Supply Demand Analysis, Support, Resistance, Trend line, Fibonacci Analysis, Harmonic Pattern, Elliott Wave Theory, Chart Patterns, and Probability for Forex and Stock Market. His works include developing scientific trading principle and mathematical algorithm in the work of Benjamin Graham, Everette S. Gardner, Benoit Mandelbrot, Ralph Nelson Elliott, Harold M. Gartley, Richard Shabacker, William Delbert Gann, Richard Wyckoff and Richard Dennis. You can find his dedicated works on www.algotrading-investment.com . His life mission is to connect financial traders and scientific community for better understanding of this world and crowd behaviour in the financial market. He wrote many books and articles, which are helpful for understanding the technology and application behind technical analysis, statistics, time series forecasting, fractal science, econometrics, and artificial intelligence in the financial market.
If you are interested in our software and training, just visit our main website: www.algotrading-investment.com
Young Ho Seo
EURUSD Market Outlook
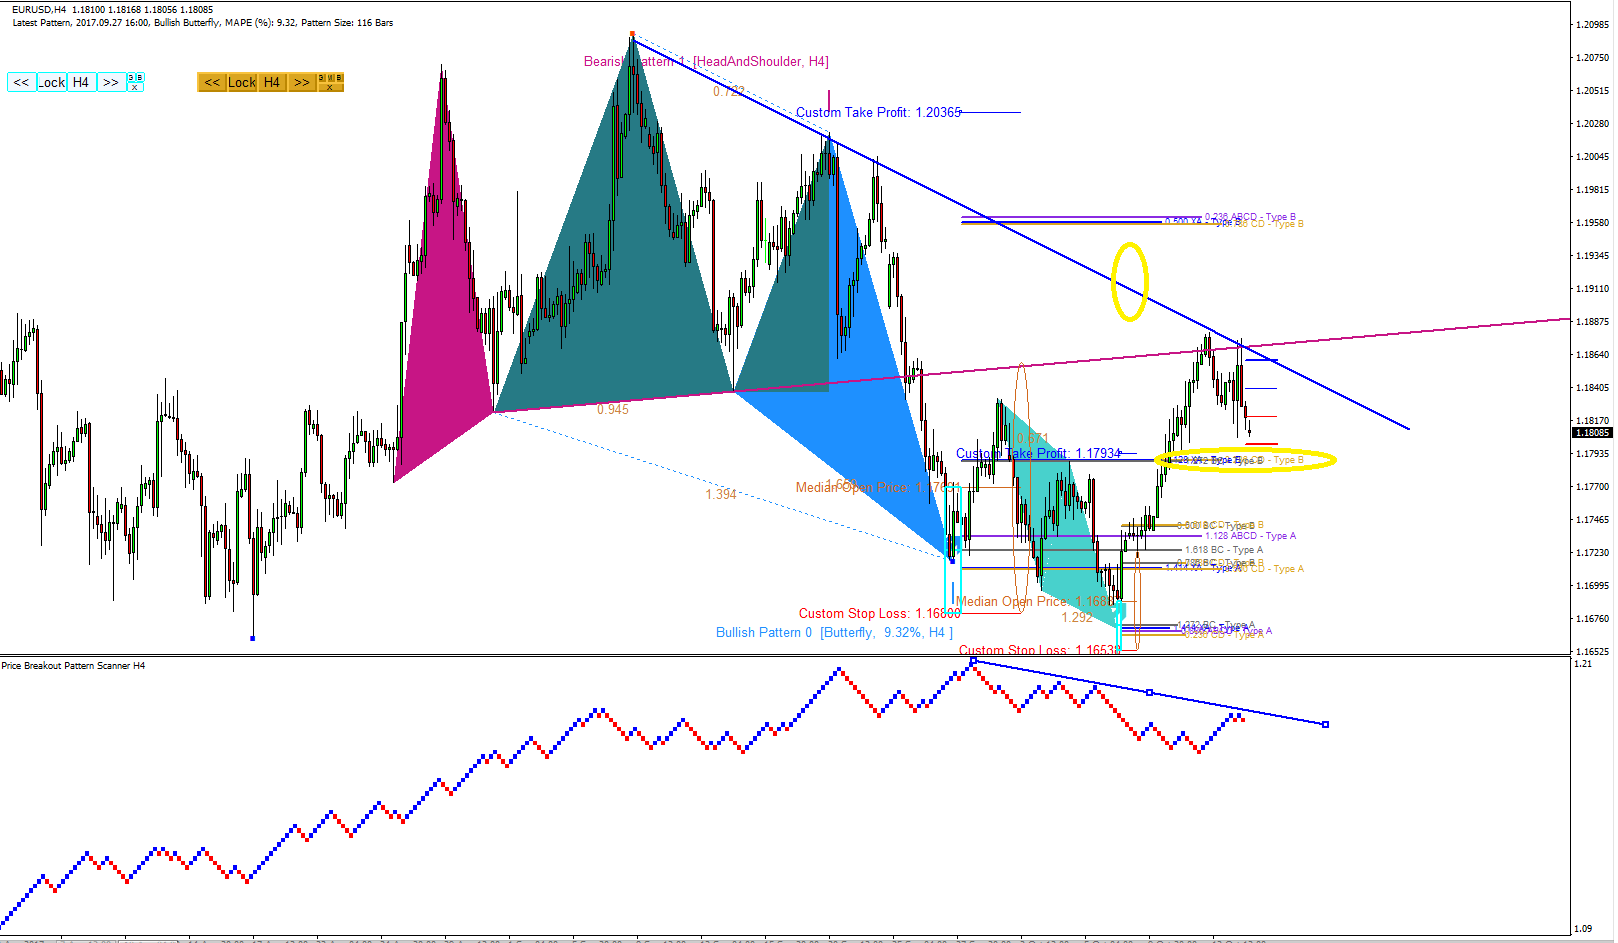
In regards to our last analysis, EURUSD have been retested the diagonal slope once more. Currently it is just 20 pips above from the PRZ Type B levels (circled in yellow). In addition, EURUSD have made a first down brick after it tested the diagonal slope last Friday. EURUSD is only 7 pips away from next down brick formation.
Visit our website for powerful trading tools and strategy.
http://algotrading-investment.com/
https://www.mql5.com/en/users/financeengineer/seller#products

Young Ho Seo

Written Instructions and Video Tutorials
Our website offers you the dedicated written instruction and video tutorials for trading and investment. Please make the best of our website for your trading and Investment.
1. Link for Written instructions:
http://algotrading-investment.com/manuals/
2. Link for video tutorials:
http://algotrading-investment.com/videos/
3. Link for articles and eBooks related to Price Action and Pattern Trading
http://algotrading-investment.com/price-action-and-pattern-trading-articles/

Young Ho Seo
Remote Trade Copier Intro Video releaed
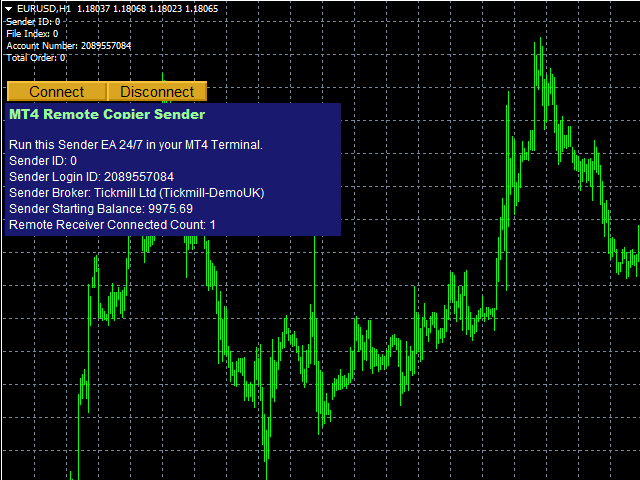
Remote Trade Copier Intro Video was released. The video explain how to install and how to apply the Remote Trade Copier for two computers located in two different countries. Here is the link for the intro video:
https://www.youtube.com/watch?v=G6sGkykij3E
Visit this link for more information about our Remote Trade Copier:
http://algotrading-investment.com/portfolio-item/remote-trade-copier-mt4-mt4/
if you have any questions about Remote Trade Copier, please feel free to write @ customer.support@algotrading-investment.com
https://www.youtube.com/watch?v=G6sGkykij3E

Young Ho Seo
GBPUSD Market Outlook
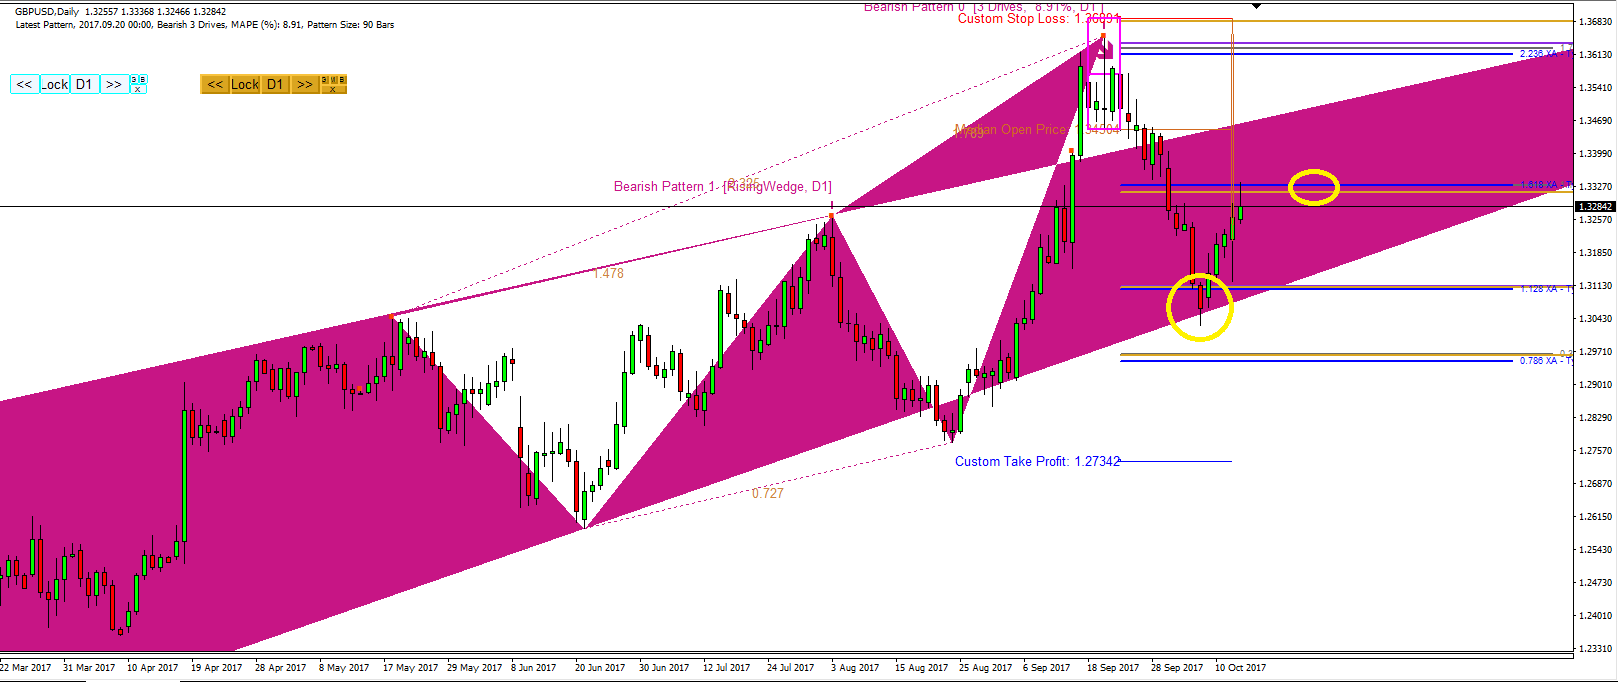
GBPUSD could not penetrate bottom of rising wedge pattern once again. GBPUSD is making correction after the bearish movement continued on the formation of the 3 Drives pattern. Currently GBPUSD tested the second PRZ Type B levels but could not penetrated at the first time.
https://www.mql5.com/en/users/financeengineer/seller#products
http://algotrading-investment.com/

Young Ho Seo
EURUSD Market Outlook
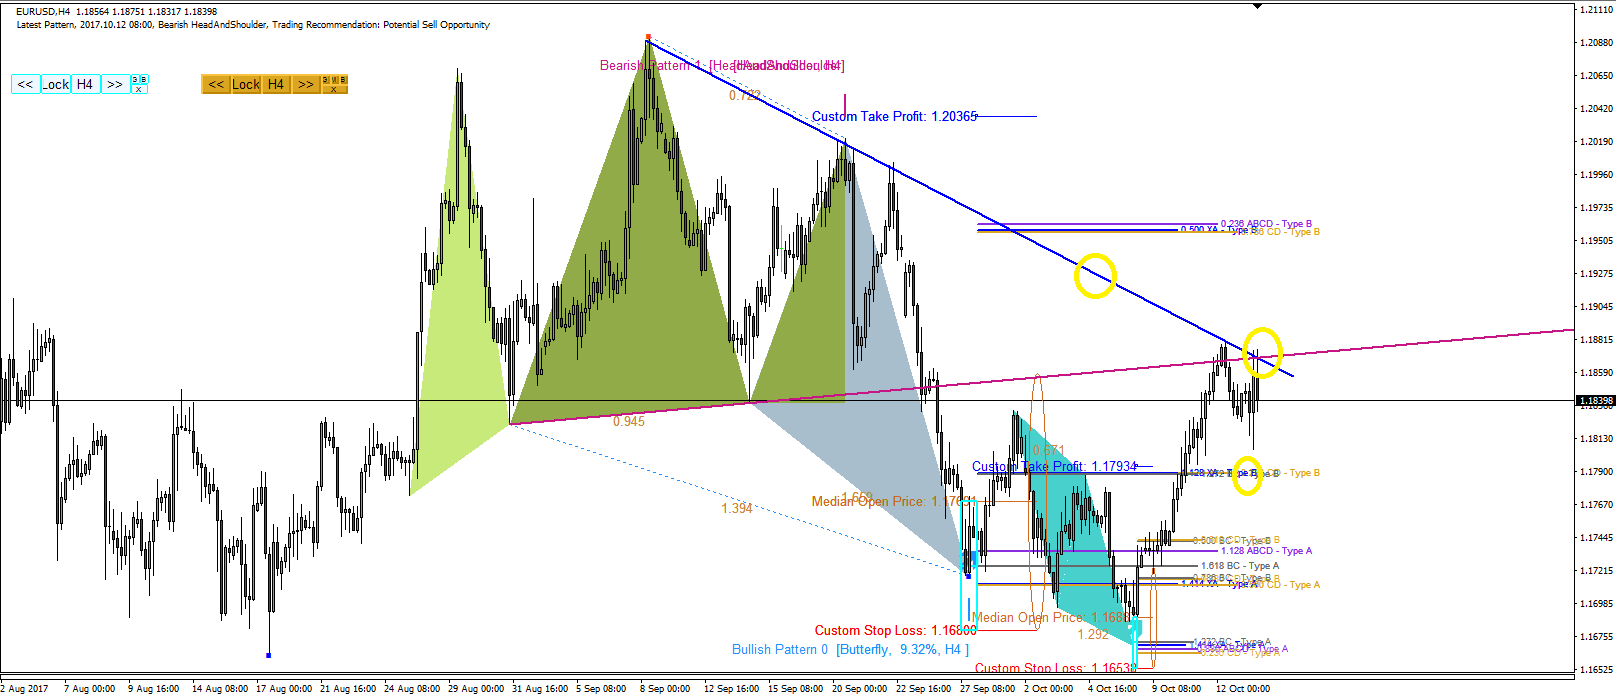
EURUSD attempted to retest the critical resistance level again. However it was not able to penetrate the resistance line. EURUSD is likely to come down to test the PRZ Type B level in the near future. Currently EURUSD is 50 pips away from the PRZ Type B level (circled in yellow).
Visit our site for powerful trading tools and strategy
https://www.mql5.com/en/users/financeengineer/seller#products
http://algotrading-investment.com/

Young Ho Seo
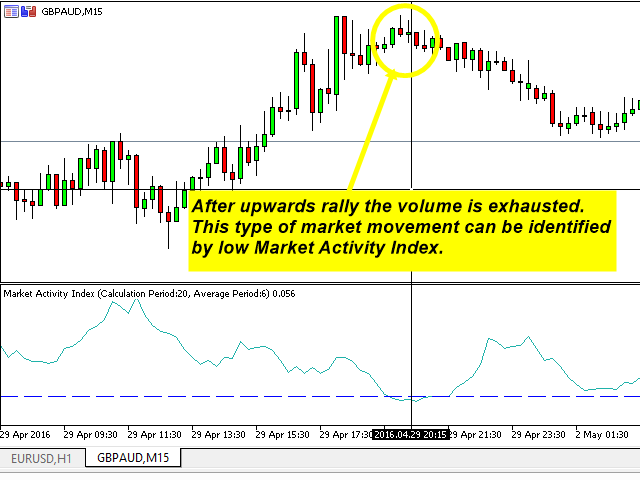
Market Activity Index to detect quite market
If your trading strategy requires to differentiate the volatile market from quite market, then Market Activity Index is probably the best tool for such a task.
In fact, Market activity index is comparable to Average True Range and Average Directional Movement Index. However, Market Activity Index is better than those because it gives a definite low volatility threshold at 0.05 or 0.10, which is identical to the statistical significance level. You can choose most of 0.05 or 0.10 for its threshold value.
Also Market Activity Index often spots the turning point quite successful after it hit the low Volatility market.
Here is the code line to call it from iCustom from your MetaTrader. Please use this code line for the references only because this may not work in the different testing environment.
input int CalculationPeriod = 20; // Calculation Period
input int AveragingPeriod = 6; // Averaging Period
input bool UseWeightedAverage = true; // Use Weighted Average
input double IndexCriticalLevel = 0.05; // Index Critical Level Value
input int IndexCriticalLevelWidth = 1; // Index Critical Level Width
input color IndexCriticalLevelColor = clrBlue; // Index Critical Level Color
input bool UseSoundAlert = false; // Use Sound Alert
input bool UseEmailAlert = false; // Use Email Alert
input bool UsePushNotification = false; // Use Push Notification
double value = iCustom(symbol, PERIOD_H4, "\\Indicators\\Market\\Market Activity Index MT4 v3.1.ex4", true, CalculationPeriod, AveragingPeriod, UseWeightedAverage, IndexCriticalLevel, IndexCriticalLevelWidth, IndexCriticalLevelColor, UseSoundAlert, UseEmailAlert, UsePushNotification, 0, 1);
Here is the link for the market activity Index
https://www.mql5.com/en/market/product/16189
https://www.mql5.com/en/market/product/16223
Also visit our website for many other powerful trading system and tool.
http://algotrading-investment.com/

Young Ho Seo

EURUSD Market Outlook
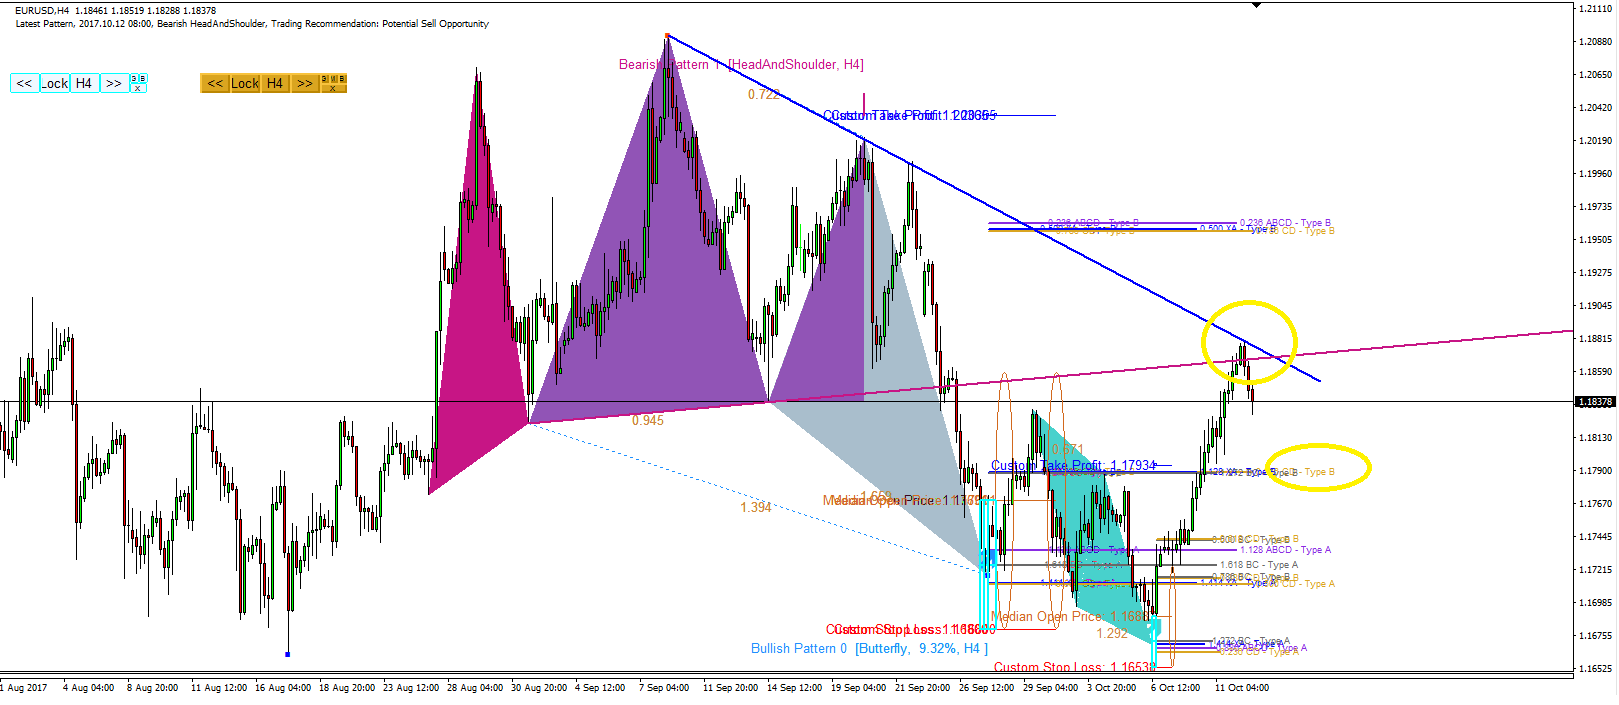
EURUSD made a down turn at the critical level we have outlined earlier. Currently it is down by nearly 45 pips. We have PRZ type B level from butterfly pattern, which can be act as another strong support levels in the future. The butterfly pattern are pattern from H4 timeframe whereas ABCD pattern are from H1 timeframe.
You are looking at H4 timeframe from the screenshot.
http://algotrading-investment.com/
https://www.mql5.com/en/users/financeengineer/seller#products

Young Ho Seo
Fast Remote Trade Copier Released
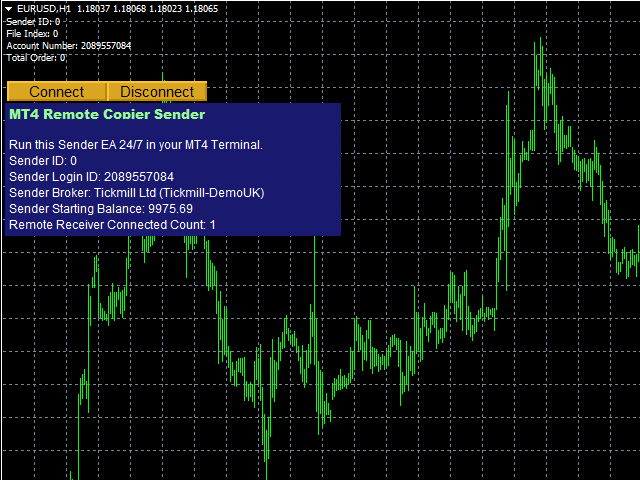
We have released Fast Remote Trade Copier. The copying speed is as fast as the local trade copier. With this remote trade copier, you can copy your trades across internet. Does not matter how far your computers are located from each other geographically. our Remote trade copier can copy your trades in the fraction of one second. The copying speed of the Remote Trade Copier is as fast as your local trade copier amazingly.
Our Remote Trade Copier is exclusively available on our website only.
Read more about our remote trade copier. Also it is extremely simple to use.
http://algotrading-investment.com/portfolio-item/remote-trade-copier-mt4-mt4/
Also visit our website for powerful trading system and strategy.
https://www.mql5.com/en/users/financeengineer/seller#products
http://algotrading-investment.com

Young Ho Seo
EURUSD Market Outlook
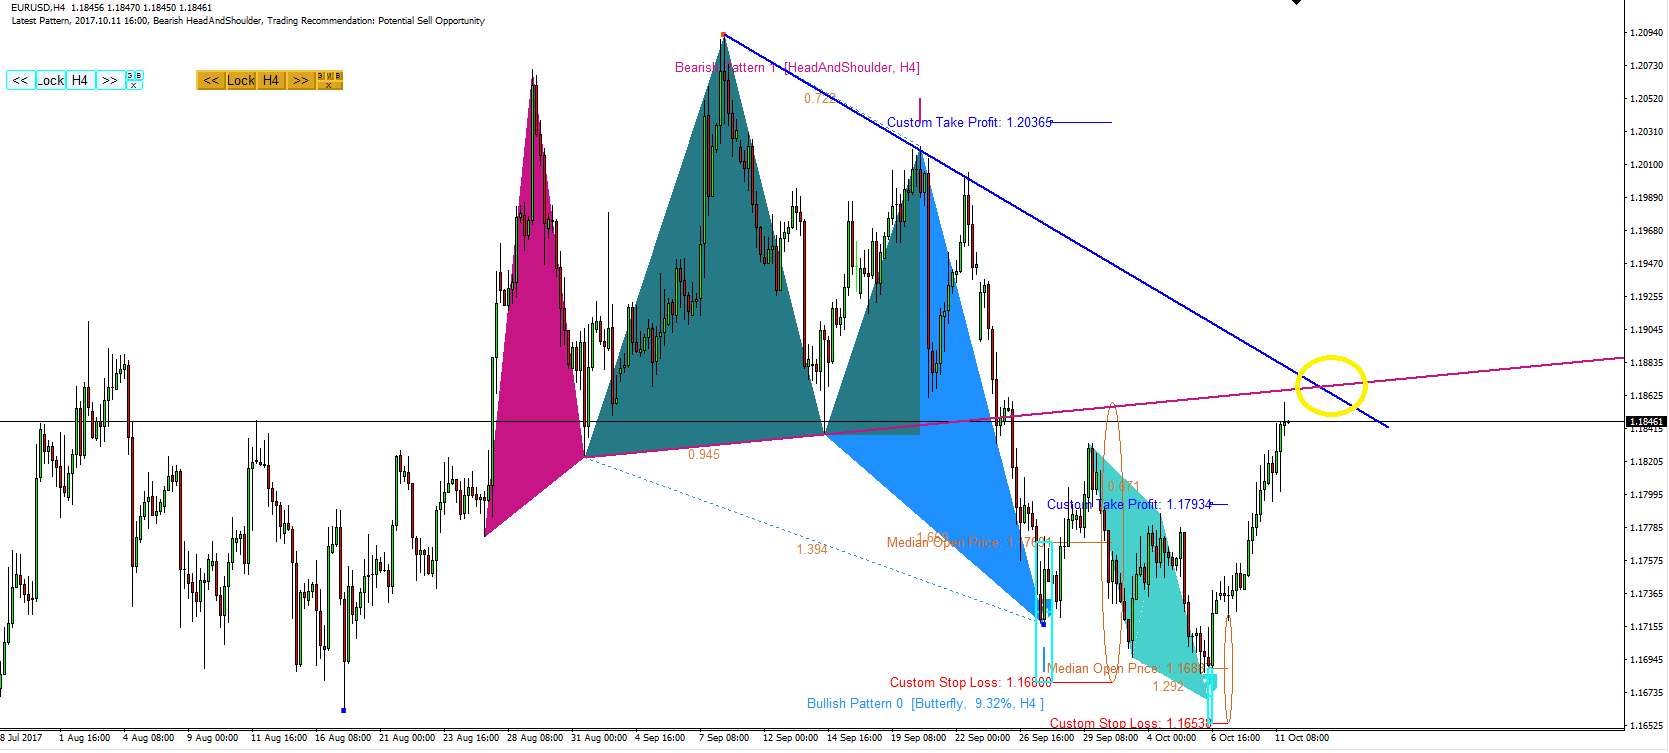
It was another day for EURSUD to rise about 50 pips. In regards to our previous analysis, EURUSD have reached to its near critical level made from the head and shoulder complex. The screenshot below are generated from our Price Breakout Pattern Scanner and Harmonic Pattern Plus.
http://algotrading-investment.com/
https://www.mql5.com/en/users/financeengineer/seller#products

Young Ho Seo
EURUSD Market Outlook
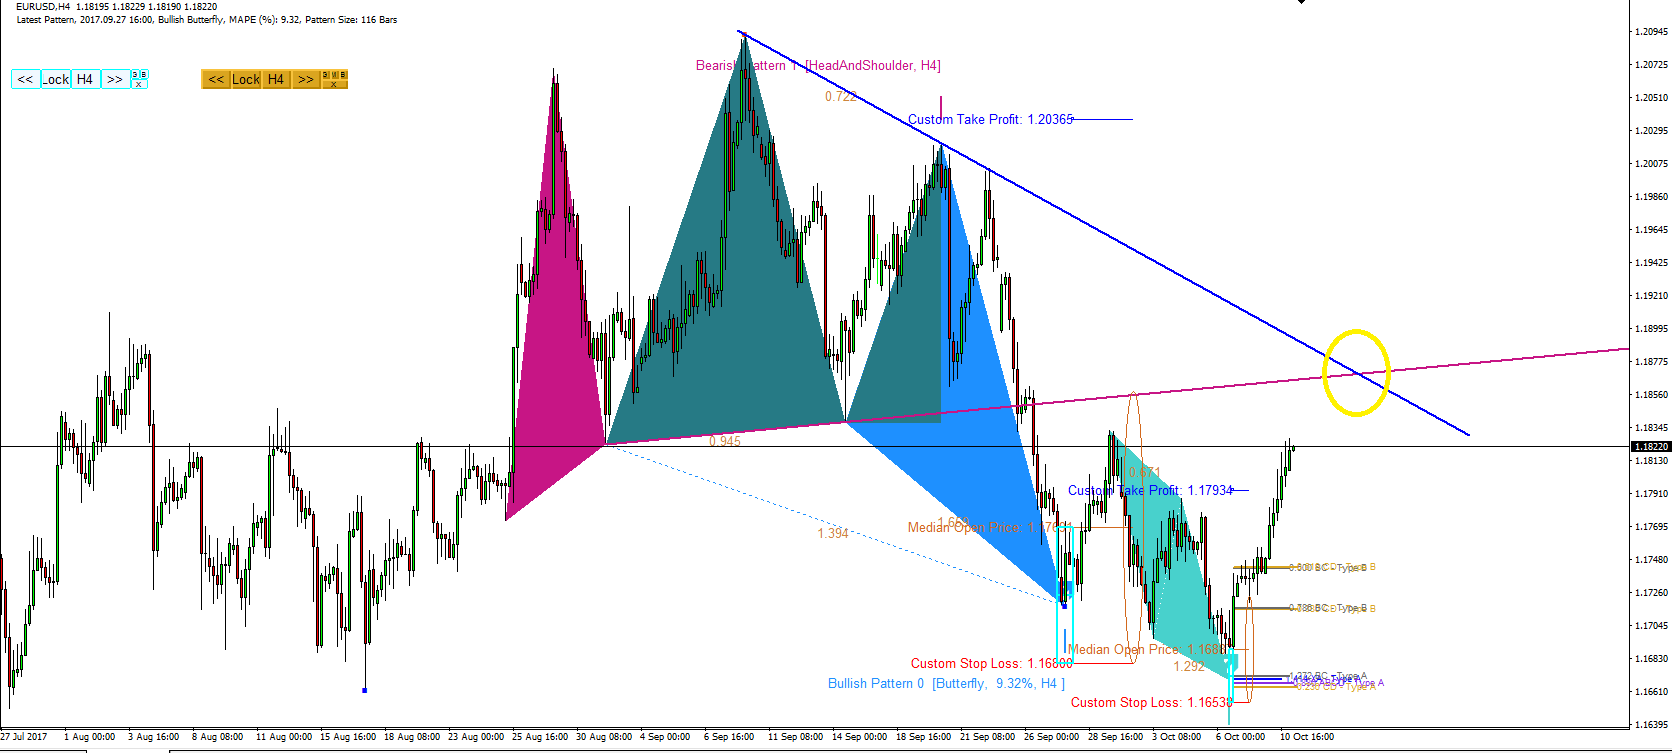
EURUSD is making correction after the formation of ABCD pattern last Friday. Currently it is up about nearly 150 pips. EURUSD is approaching to retest the neckline again shortly. We have outlined the important geometry in the screenshot below for your trading.
Visit our site for powerful trading system and range of local and remote account copier.
http://algotrading-investment.com/
https://www.mql5.com/en/users/financeengineer/seller#products

Young Ho Seo
Fast Remote Trade Copier Released
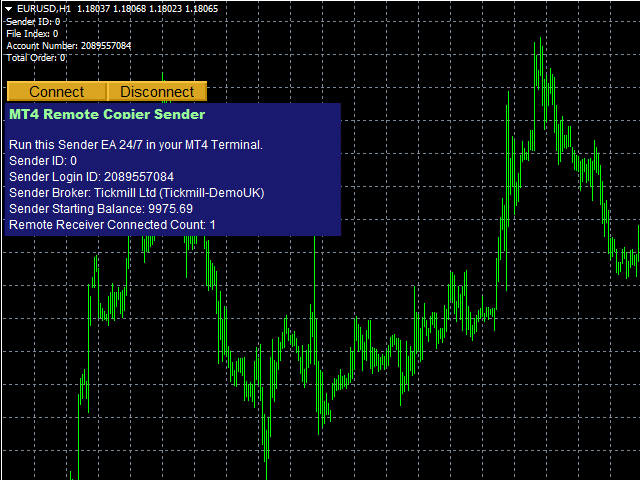
We have released Fast Remote Trade Copier. The copying speed is as fast as the local trade copier. With this remote trade copier, you can copy your trades across internet. Does not matter how far your computers are located from each other geographically. our Remote trade copier can copy your trades in the fraction of one second. Remote Trade Copier is exclusively available on our website only.
Read more about our remote trade copier. Also it is extremely simple to use.
http://algotrading-investment.com/portfolio-item/remote-trade-copier-mt4-mt4/
Also visit our website for powerful trading system and strategy.
https://www.mql5.com/en/users/financeengineer/seller#products
http://algotrading-investment.com

Young Ho Seo
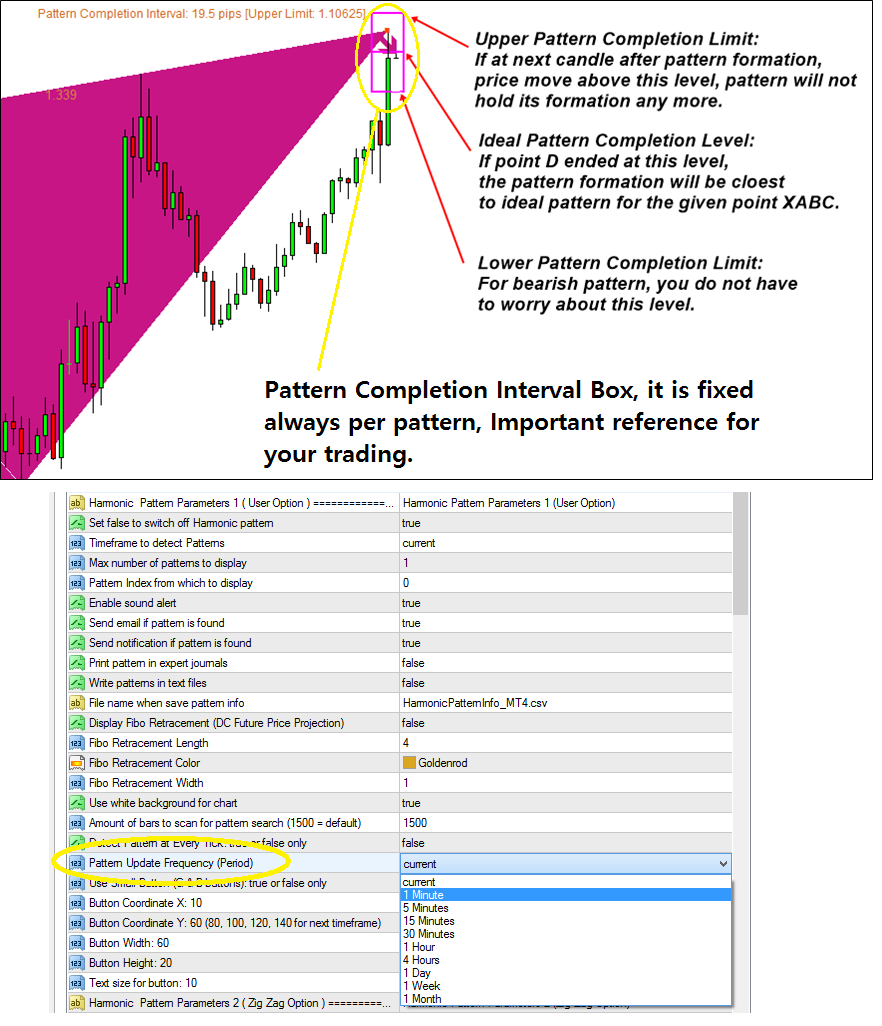
Tactical Use of Pattern Completion Interval
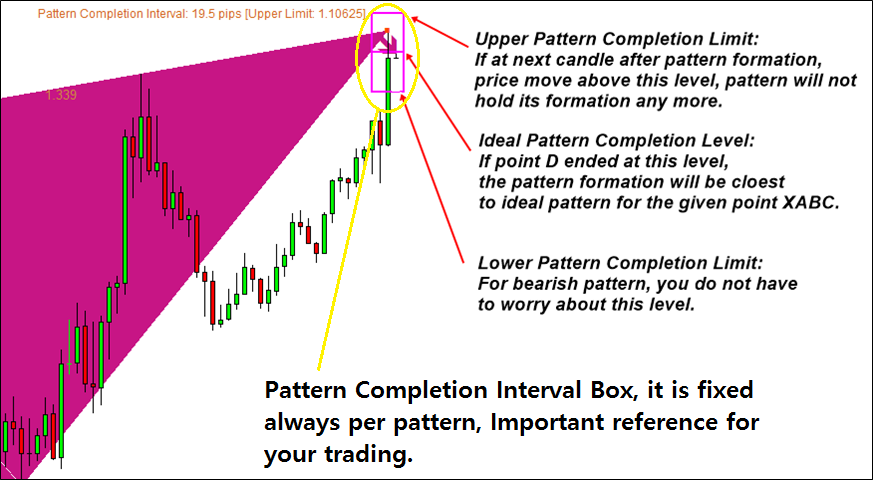
Our Harmonic Pattern Plus and Harmonic Pattern Scenario Planner exclusively uses the Pattern Completion Interval for your tactical trading.
Sounds complicated but not. Simply, if the price is inside the PCI box, then the pattern will stay alive. If the price move outside the PCI box, then the pattern is invalid. (We barrowed this concept from prediction interval or confidence interval from multiple regression techniques).
Maybe it is the view you need to see not the technical language. It is the PCI box that you will calculate your entry + your risk management. Inside PCI, your will pick up the good timing for your entry based on your risk management. Everything should be happen inside PCI. Otherwise, your reward/risk does not have too much merit.
Secondly you might need to use some secondary confirmation for final buy and sell decision. Remember the very advantage of manual trading is about combining information. It does not have to be fundamental data for this purpose. In our case, we exclusively uses geometric based tools and we have nearly got rid of all the technical indicator for trading. But you can use some technical indicator like RSI, Bollinger bands and Fibonacci retracement etc.
Once you are sure about the trading and entry and risk management, then you will lock the pattern for your trading. Just click the lock button in your chart to do so.
Visit our site for powerful trading system and strategy.
http://algotrading-investment.com/
https://www.mql5.com/en/users/financeengineer/seller#products

Young Ho Seo
Product License Viewer for simple Product installation + simple products update
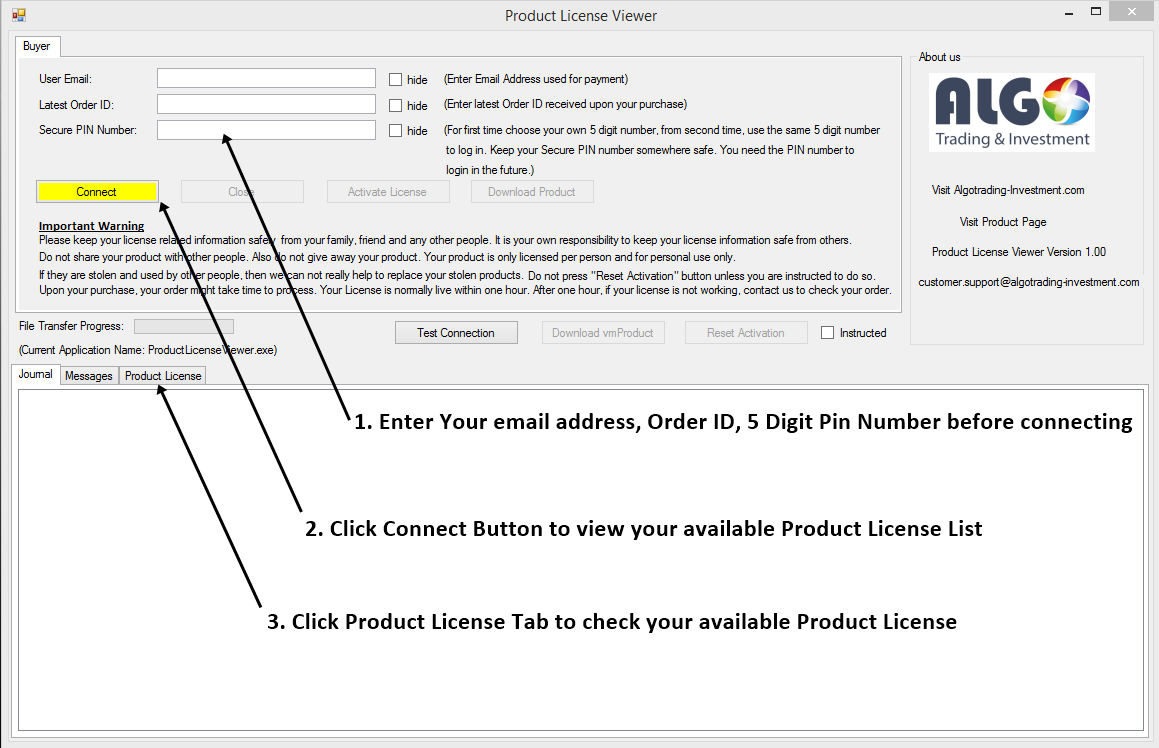
At the moment, we have fully utilized the Product License Viewer for our Market Place at: http://algotrading-investment.com.
Literally this Product License Viewer can help you a lot with your product installation when you purchased our products from algotrading-investment.com. Not only for the installation. When we have released new version of our products, you can also download and install new version from our Product License Viewer with one button click. So this is all about the convenience.
Also indicator and expert advisor loading times are much faster now. Once the product is installed, you do not have to enter your email address any more. Once the activation is done in your computer, you can use our products for any brokers. The amount of brokers you can use are not limited by numbers.
Here we have outlined the step by step guide on how to use our Product License Viewer to manage your products here for you. It take no more than 3 minutes to start with.
http://algotrading-investment.com/product-installation-guide/
Or watch this 3 minutes video tutorial.
https://www.youtube.com/watch?v=kR4hRqv4N6Y
The Product License Viewer is really easy to use, however, if you have any questions in using the Product License Viewer, please contact us by clicking the link below:
http://algotrading-investment.com/customer-support/
Note that there is no need to use Product License Viewer when you have purchased our products from mql5.com since mql5.com have their own license control system.

Young Ho Seo
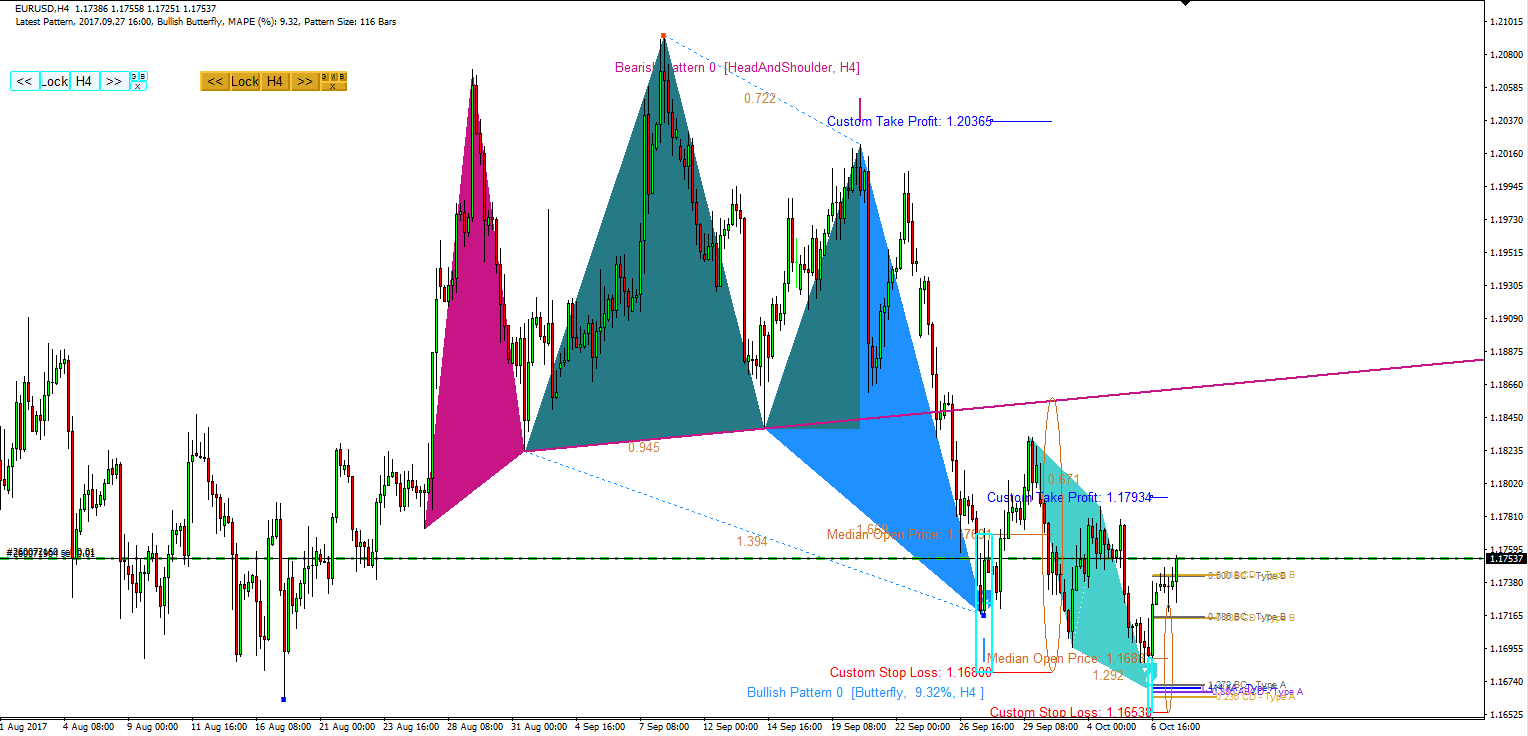
EURUSD Market Outlook
EURUSD continued for its correction on Monday. From last Friday, ABCD pattern was coincide with the turning point at its correction phase. Currently Market reacted for about 80 pips.
http://algotrading-investment.com
https://www.mql5.com/en/users/financeengineer/seller#products
EURUSD continued for its correction on Monday. From last Friday, ABCD pattern was coincide with the turning point at its correction phase. Currently Market reacted for about 80 pips.
http://algotrading-investment.com
https://www.mql5.com/en/users/financeengineer/seller#products

Young Ho Seo
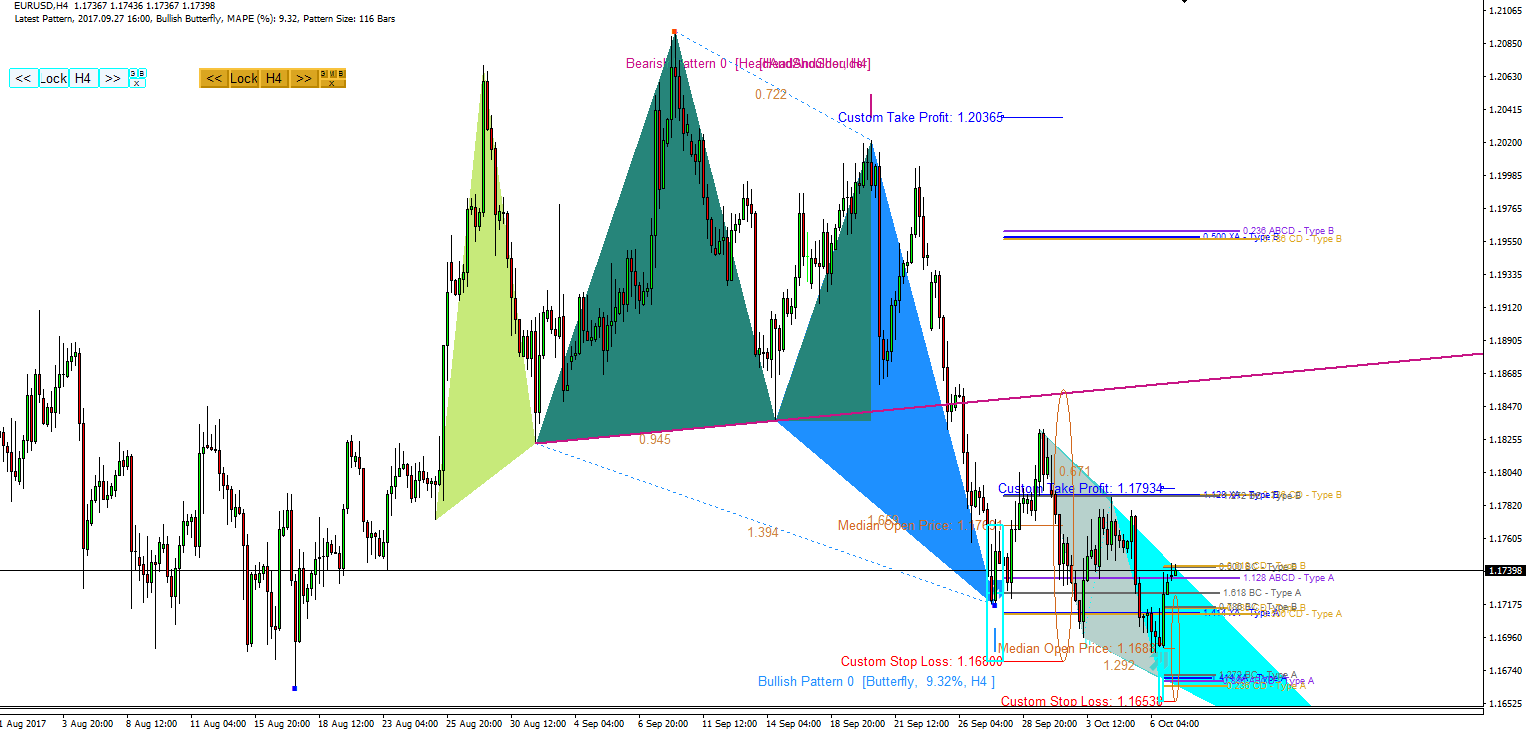
EURUSD Market Outlook
Asian session just kicked off. EURUSD is currently at the boundary of the wedge.
The screenshot below are generated from multiple timeframe pattern analysis of Price Breakout Pattern scanner and Harmonic Pattern Plus.
http://algotrading-investment.com/
https://www.mql5.com/en/users/financeengineer/seller#products

Young Ho Seo
Pattern Detection Timing for Harmonic Pattern Plus
Harmonic Pattern Plus will detect the pattern when the price enter the Pattern Completion Interval Box for first time. So it will detect pattern at Point D.
For how fast you want to detect the pattern, there are several options you can control from your input setting. Typically this will be set for current chart timeframe. For example, if you are using H1 timeframe, then the pattern will be detected every 1 hour period when the new bar is opened.
If you wish, you can make it to detect pattern at every 1 minutes regardless of the timeframe. So this setting will detect pattern at the intra bar timing. Some traders may prefer this option or some traders may prefer the other options.
The thing is that you have the full choice with our Harmonic Pattern Plus.
Just remember that if the pattern is detected more frequently, then it is heavy for your computer. So which option you want to choose is entirely depending on your preference + your computing power.
Visit our website if you are looing for powerful trading system and strategy.
http://algotrading-investment.com/
https://www.mql5.com/en/users/financeengineer/seller#products

Young Ho Seo
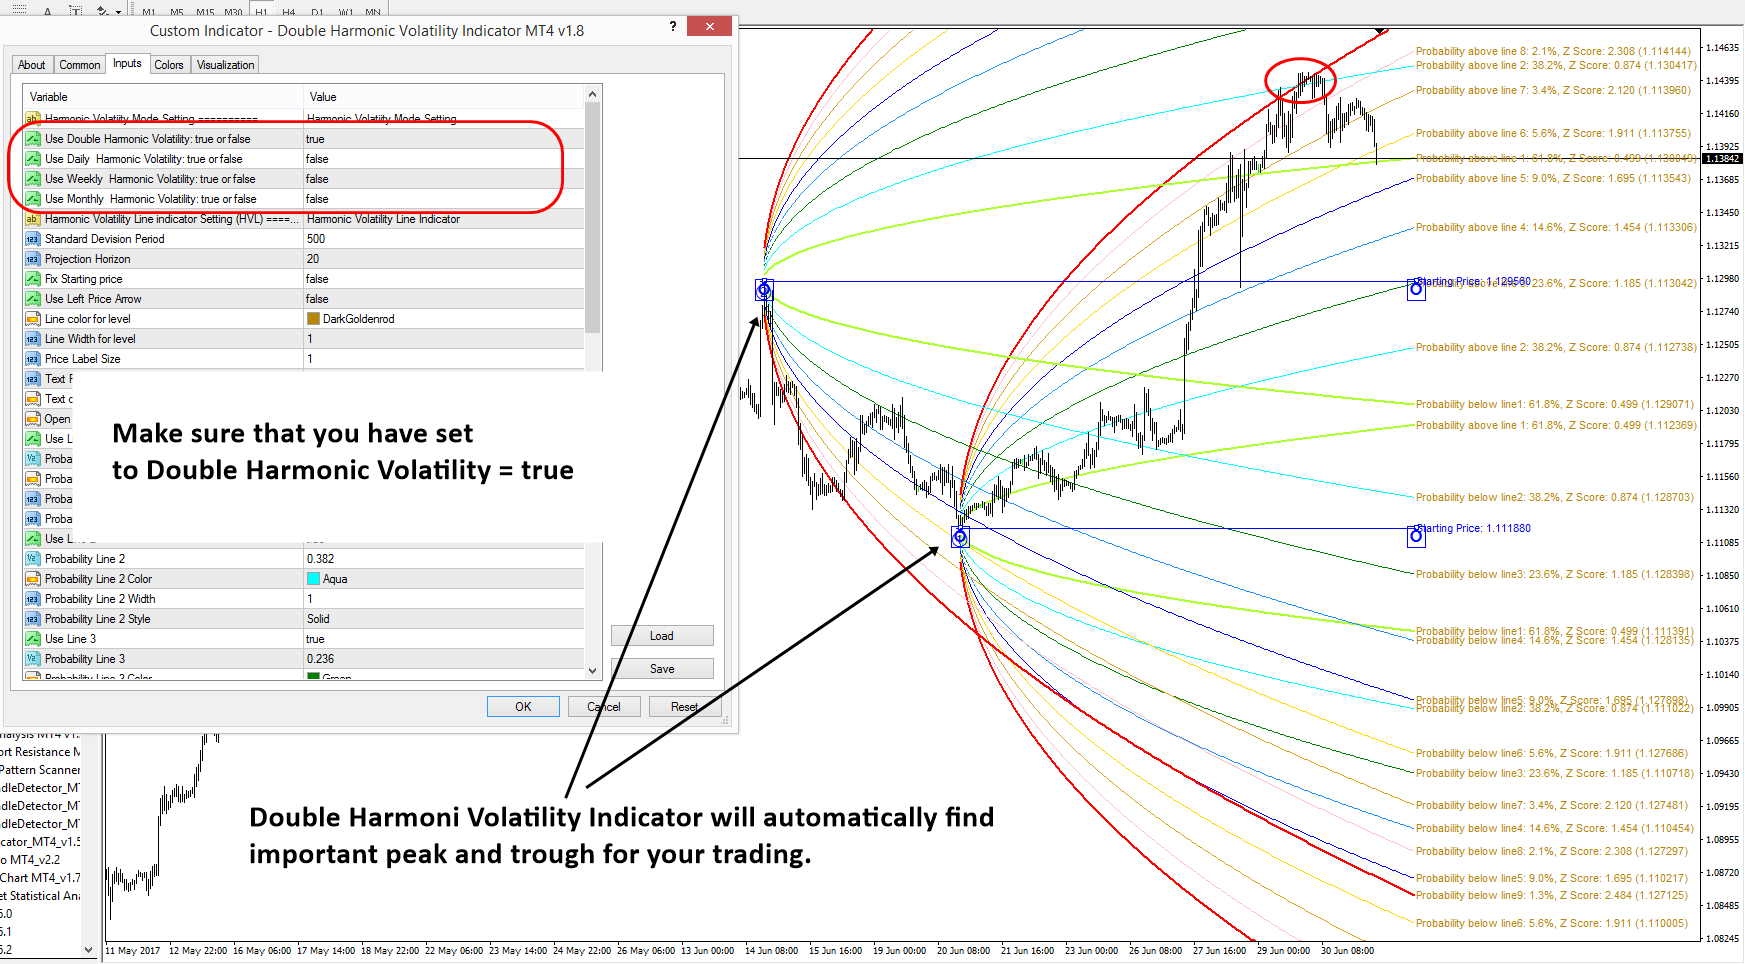
How to use the Peak -Trough Based Double Harmonic Volatility Mode
In our last post, we have shown you how to run the Harmonic Volatility indicator in the time based Double Harmonic Volatility Mode. Ok, that is not the last capability of our Double Harmonic Volatility Indicator. As we have mentioned that you can run the Double Harmonic Volatility indicator in more than four different mode.
Why you should use it? We have already mentioned that trading without having full picture of market volatility is really bad for your trading. Neither simple tool like ATR indicator or Bollinger Bands will never give you the full picture of the Market Volatility. Retail traders in general do not have an access to many professional Market Volatility monitoring tools like Modified Value At Risk, GARCH, etc. So you can use our Double Harmonic Volatility Indicator for simple and efficient monitoring of Market volatility as well as for your decision making.
Harmonic Volatility Indicator can be applied to the peak and trough like Gann’s Angle (or Gann’s Fan). The peak-trough based Double Harmonic Volatility mode is simply placing two harmonic Volatility lines at one peak and trough. In the screenshot we show them. Most of time, it is pretty automatic. If you like to place the Harmonic Volatility Mode in the peak and trough for your own preferences, then just use our Peak-Trough Analysis tool, which is free of charge for anyone.
http://algotrading-investment.com
https://www.mql5.com/en/users/financeengineer/seller#products

Young Ho Seo
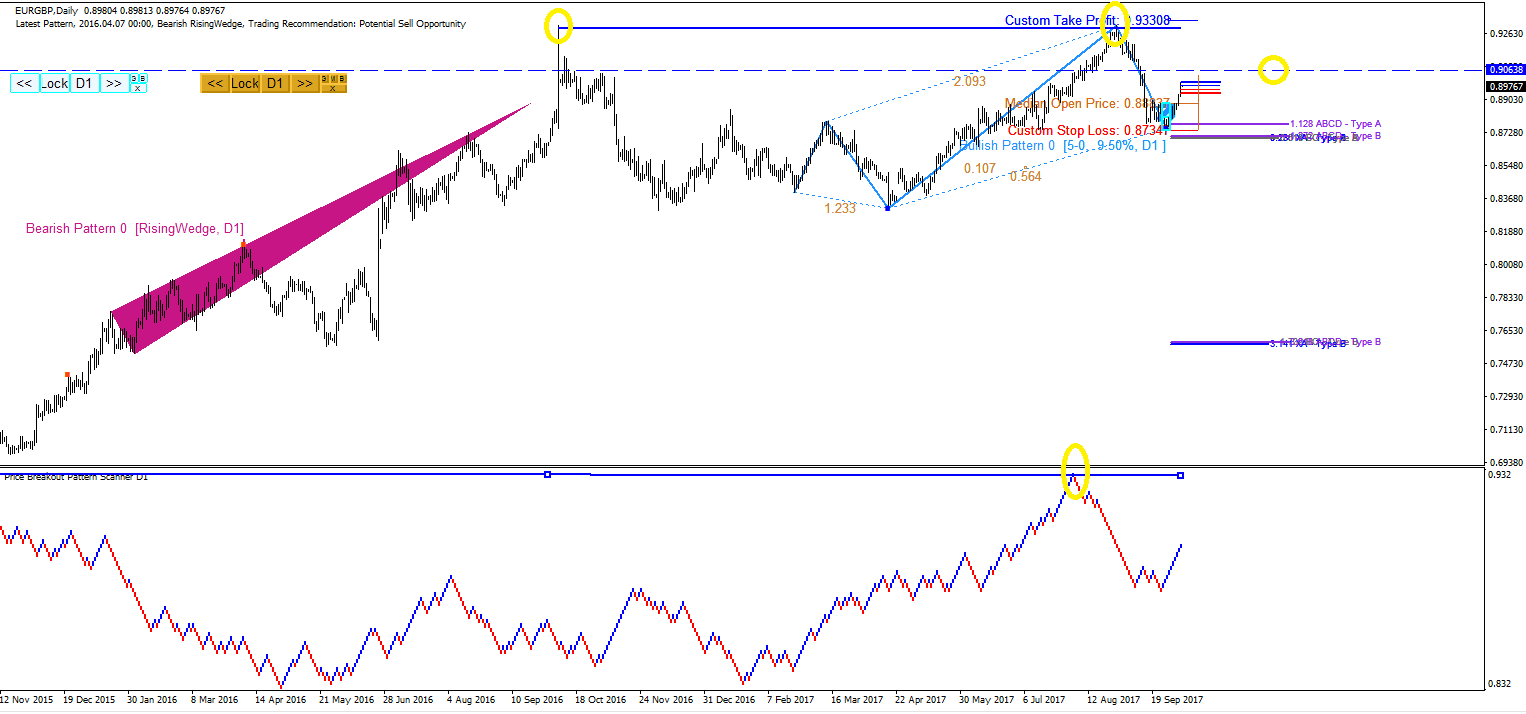
EURGBP Market Outlook
0.9000 level was an important level last 6 years for EURGBP. After the brutal penetration of 0.9000 level, EURGBP had made a correction for about a month. With the formation of 5-0 pattern, EURGBP ended nearly one month of corrective movement. It started to make its first bullish movement. It seems that 0.9000 level will become the tactical level once again for your trading in the near future.
http://algotrading-investment.com/
https://www.mql5.com/en/users/financeengineer/seller#products

Young Ho Seo
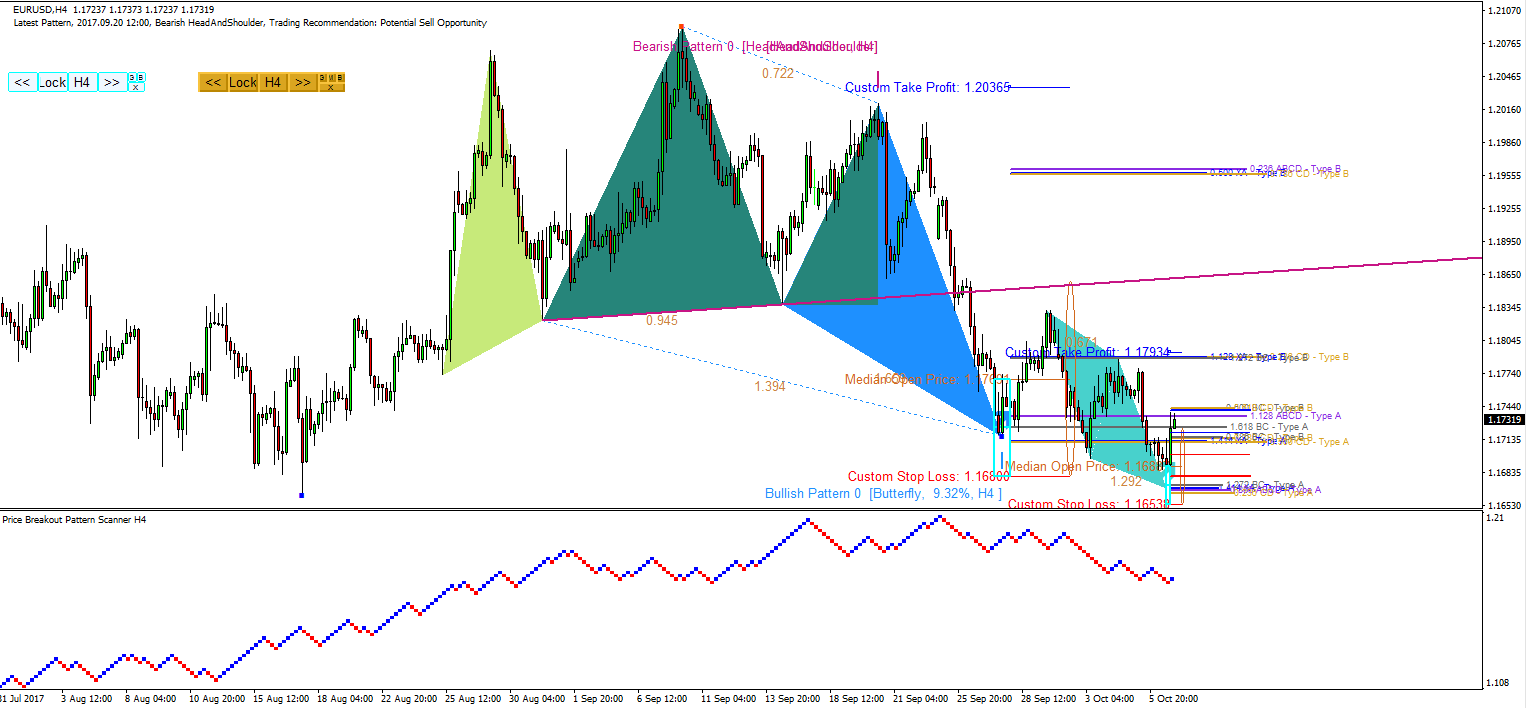
EURUSD Market Outlook
EURUSD accomplished with another bearish pressure last week. However, it was milder than the previous one. Currently EURUSD nearly made its complete head and shoulder pattern breaking nearly 200 pips from its neckline. Before the end of the market close, we had an ABCD pattern which was coincided with the corrective phase of EURUSD.
Looking for powerful trading system and strategy, do not miss to visit our website:
http://algotrading-investment.com/
https://www.mql5.com/en/users/financeengineer/seller#products

Young Ho Seo

Making your income with our Affiliate Program
With Algo Trading & Investment, you can generate stable but easy income by joining our ATI Affiliate Program. To start to generate your income with us, all you need is good internet connection and your own computer. That is all. So what are you exactly earning from us? You can earn up to 30% of the referral commission on our products. Below is the referral commission table summarizing your payment structure from us.
Algotrading-Investment-Affiliate Commission Table
You can be ready to receive the payments in less than 10 minutes by following the few steps below. If anything is unclear to join our affiliate program, then do not hesitate to contact us @ sales@algotrading-investment.com.
For more information on our affiliate Program, you can visit following links.
http://algotrading-investment.com/affiliate-membership/

: