• Visão global
  • Comentários (7)
  • Discussão (18)
  • O que há de novo

MACD Divergences Scanner MT5

4.25

** All Symbols x All Time frames scan just by pressing scanner button **

*** Contact me to send you instruction and add you in "Divergence group" for sharing or seeing experiences with other users.

Introduction

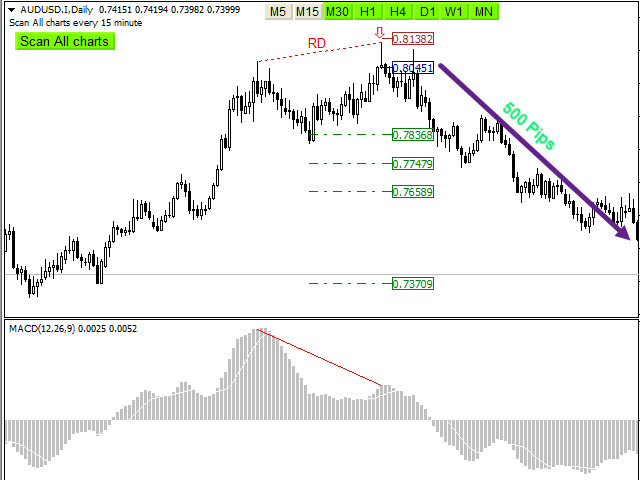
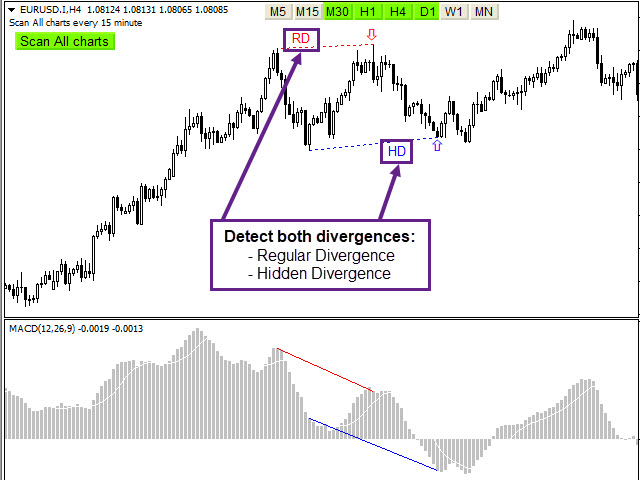
MACD divergence is a main technique used to determine trend reversing when it’s time to sell or buy because prices are likely to drop or pick in the charts. The MACD Divergence indicator can help you locate the top and bottom of the market. This indicator finds Regular divergence for pullback the market and also finds hidden MACD Divergence to show continuing trend.

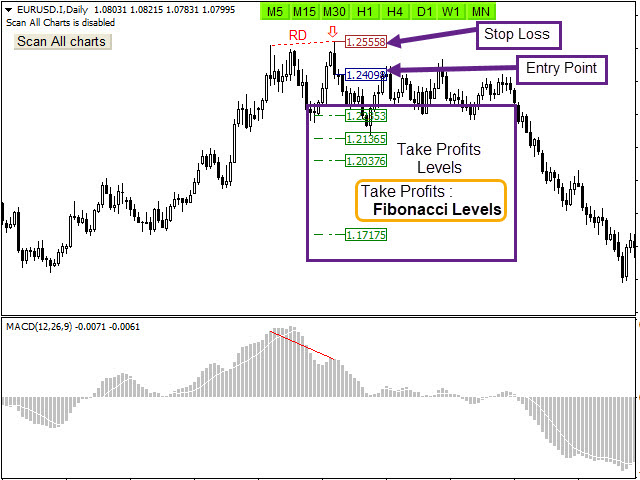
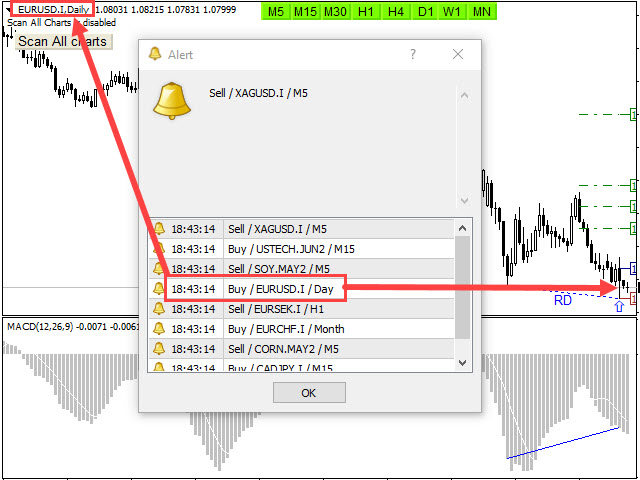
This indicator shows divergence on the MACD that is a strong hint for an excellent entry point and finds immediately with alarm and notification and also has stop loss, take profits and entry point with Fibonacci levels and candlestick checking for easy trading.

Main Features

  • Detect the best and  most successful point of trend or reversal trend
  • Easy-to-use and user-friendly indicator
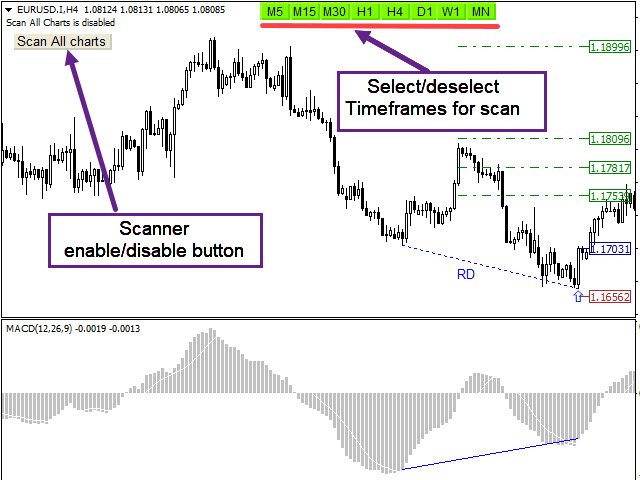
  • Scan All charts button ( Forex, Crypto, Indices and commodities )
  • Select and deselect time frames button for scan (M5,M15,M30,H1,H4,D1,W1,MN)
  • It displays and pushes notification stop-loss, entry-point and take-profit levels
  • Candlestick check for the best entry point
  • Use Fibonacci levels
  • Sending the alert and push notification
  • Alert enable/disable base on your setting time
  • Adjust the pattern setting

How to test:

You can find tester version here. It is free on USDCHF and AUDCHF real charts.


Input Parameters

=========Scanner============

  • Scan All Charts – Enable
  • Scan the number of candles – Amount of history bars to evaluate
  • Re-scan Timer – Re-scan all charts in all time frames after passing time

=======Pattern Feature============

  • MACD Feature(Fast EMA Period, Slow EMA Period, Signal SMA Period ) - MACD features
  • Pattern Feature(Period, Deviation, Back step, Wing length) - Algorithm Parameters for pattern recognition

=======Display/style Options============

  • Display Options – Display or do not  Take Profit and Stop Loss levels
  • Stop Loss/Take Profit levels and Breakout Style - Set the Fonts and colors of patterns

    ========ALERT SETTINGS ==========

    • Display Alert or Push Notification – Enable or disable Alert or Push Notification
    • How many candles are past a pattern – Maximum Number of candles Passed from a pattern to allow alert
    • Alert Buffer Size – Maximum save alert to prevent duplicate alerts
    • Alert start/end time  – Determine trading hours based on the computer clock to activate and deactivate the alarm


        Comentários 7
        qingfu666
        188
        qingfu666 2024.08.05 14:46 
         

        很友好的界面,很简单的用法,必须5星好评

        ceejay1962
        416
        ceejay1962 2024.03.19 18:15 
         

        It is a nice indicator and handy to scan all Market Watch symbols at the same time. It has paid for itself many times over.

        anmnayem
        149
        anmnayem 2023.02.22 15:33 
         

        This is one of the best indicator in the market and I can see positive growth in my equity and seller is very responsive and helpful

        Produtos recomendados
        "Battles between bulls and bears continue to influence price development long after the combat has ended, leaving behind a messy field that observant technicians can use to manage risk and find opportunities. Apply "trend mirror" analysis to examine these volatile areas, looking for past action to impact the current trend when price turns and crosses those boundaries." RSI Mirrors and Reflections is a robust technique using multiple RSI periods, mirrors and reflections based on RSI values to ind
        This indicator identifies the global trend and has a powerful algorithm for filtering out any type of noise that can interfere with trend direction identification. A special filter shows areas of sideways trend, consolidation or flat, which allows you to avoid any uncertainties in the market movement vision and gives a clear understanding of the global trend movement. This indicator has no analogues and gives it unique advantages in the analysis of price movements and determination of the dir
        Bar Sequential
        Maximiliano Frisione Figueroa
        This indicator can help you clearly identify trend changes in both bullish and bearish markets. The indicator compares the closing price of the last candle with the closing price of the candle "X" periods ago (input parameter). In an uptrend, an initial number '1' is plotted if a candle closes higher than the closing of a candle "X" periods ago. In a downtrend, an initial number '1' is plotted if a candle closes below the closing of a candle "X" periods ago. Subsequent numbers are plotted when e
        FREE
        KT DMA is a modified and advanced version of the classic Displaced Moving Averages with buy/sell crossover alerts and a Multi-Timeframe scanner that shows DMA's direction across each real-time time frame. A Displaced Moving Average is a simple moving average that moves ahead or backward in a time frame (either short-term or long-term). It also allows you to predict price movement more accurately. Features Depicts the trend direction using the alignment of three moving averages. Buy/Sell signa
        High And Low MT5
        Dmitriy Parfenovich
        On the current chart, this indicator displays candlestick highs and lows of another time frame. Input Parameters: TimeFrame - chart time frame whose data will be displayed on the current price chart (by default, H12). Time Zone - shift of the indicator by time zone relative to the broker's time (by default, Broker-1). If the broker's time zone is UTC+1 and the Time Zone parameter is set to Broker-1, the bends of the indicator will be plotted in multiples of Greenwich Time. Indicator buffer value
        Intelligent ZigZag indicator. It has only two settings. The higher the values, the more significant extreme values it shows. Application area. To determine the trend. Line drawing direction. To recognize multiple patterns. If you put two indicators on one chart with fast and slow values. By changing the color of one of them, you can very well decompose the price movement into waves. The indicator can be a great helper for marking the chart and identifying the key levels from which t
        The Buffer Reader will help you to check and export the custom indicators buffers data for your current chart and timeframe. You can select the number of buffer and historical bars to read/export. The data can be exported in a CSV format and the files will be stored in the folder:   \MQL5\Files . How it works Put the number of buffers to read in the Buffers_Total input parameter. Put the number of rows to display in the Rows_Total. Choose the CSV separator in the parameter. Copy the correct na
        FREE
        Brief Description: A tool to display historical Open, High, Low, and Close (OHLC) price points for various time periods. Gain insights into market behavior with data from yesterday, the day before, the previous week, and the previous month. Recognize liquidity zones effectively. Features: 1. Comprehensive Timeframe Insights: Visualize crucial OHLC points for different timeframes. Historical data for yesterday, day before yesterday, previous week, and previous month. 2. Built on ICT's Teachings:
        MultiFractal é um indicador fractal modificado de Bill Williams, complementado com fractais de ordem superior, cuja diferença é de quatro em tamanho, semelhante à alteração do período de tempo. Vantagens sobre o indicador terminal original: Conveniência Visibilidade Conteúdo informativo O indicador é conveniente porque você não precisa mudar para intervalos de tempo diferentes ao trabalhar. Visibilidade - em um gráfico você pode ver a estrutura do gráfico desde movimentos de mercado de pequeno a
        Este indicador de painel de divergência de vários períodos de tempo e vários símbolos envia um alerta quando uma ou duas divergências diferentes foram identificadas em vários intervalos de tempo e não em divergências únicas. Ele pode ser usado com todos os intervalos de tempo de M1 a MN. No máximo 9 períodos de tempo podem ser mostrados no painel ao mesmo tempo. É possível habilitar o filtro de tendência de média móvel, RSI ou bandas de Bollinger para filtrar apenas as configurações mais fortes.
        Regression
        MIKHAIL VINOGRADOV
        O indicador de regressão mostra a direção da tendência. O gráfico mostra até 3 linhas de regressão com diferentes períodos de tempo. A linha reta é construída como a média dentro do canal de ondas do movimento de preços (mostrado em um ScreenShot). Nesse caso, você pode desativar qualquer uma das linhas. Além disso, o indicador permite alterar a cor de cada linha. É interessante calcular o ângulo relativo em graus. A exibição do ângulo também pode ser desligada. Graças a esse indicador, voc
        Kill Zones MT5
        Diego Arribas Lopez
        MT4 Version Kill Zones Kill Zones allows you to insert up to 3 time zones in the chart. The visual representation of the Kill Zones in the chart together with an alert and notification system helps you to ignore fake trading setups occurring outside the Kill Zones or specific trading sessions. Using Kill Zones in your trading will help you filter higher probability trading setups. You should select time ranges where   the market   usually reacts with high volatility. Based on   EST time zone, f
        Versus USD MT5
        Vonjinirina Alfred Randrianiaina
        Versus USD calcula a variação de preço de cada uma das principais moedas em relação ao USD e exibe uma visão clara e comparativa do seu desempenho para cada período ou barra indexada pelo   cursor   no Timeframe atual do gráfico com barras de   progresso . Adicionalmente, marca uma   seta   na barra/período em que a moeda em questão experimentou a taxa de mudança mais   alta   ou   baixa   em relação ao USD comparada com outras moedas, fornecendo assim uma medida mais precisa do desempenho da mo
        SupportResistence
        Eduardo Borges Mariani
        SupportResistance é um indicador de suporte e resistência dinâmico baseado na máxima e na mínima dos candles anteriores. Os parâmetros de cálculo são configuráveis. Pode-se usar como referência os valores máximos e mínimos do candle anterior ou se pode usar a máxima e a mínima de um grupo de candles anteriores. O indicador utiliza de uma linha vermelha para indicar a resistência e uma linha verde para indicar o suporte. Quando um suporte ou uma resistência é rompida, sua linha fica pontilhada, s
        DM IND Exclusive
        Sergio Vidal Prado
        Indicador Para Opções Binarias. Indicator for Binary Options Usa dois gales. Instalar em mt5 Esse indicador é para ser usado no tempo de vela de 5 minutos e em M5. Este também funciona em M1, porém é mais eficiente em M5. Só descompactar e copiar os arquivos na pasta de dados do seu MT5. Arquivos indicator na pasta MQL5 - Indicator. Baixe também a Media Movel totalmente gratis: https://www.mql5.com/pt/market/product/50400 Esse Indicador é para a próxima vela. Apareceu a seta, só aguardar a pr
        Este é o indicador de Bandas Bollinger da Gekko. Ele amplia o uso das famosas bandas de bollinger e calcula sinais fortes de entrada e saída usando a ação do preço contra as bandas superior, inferior e do meio. Você pode configurá-lo de muitas maneiras diferentes, por exemplo: pullback, pullback contra a tendência, cruzamento da banda do meio, etc. Parâmetros de Entrada Number of Bars to Plot Indicator:  número de barras históricas para plotar o indicador, mantenha  baixo para melhor desempenho;
        Checkpoints
        Tatiana Savkevych
        The Checkpoints indicator implements an advanced algorithm for visualizing the market trend. The main application of the indicator is to generate buy and sell signals. Determining the market trend is an important task for traders. Probably, almost every trader has dreamed of non-lagging MAs at least once. I have embodied this dream in my indicator. With this indicator, you can predict future values.  The indicator is designed to determine either a trend or short-term buy or sell signals. Th
        FIBO Trend PRO mt5
        Evgenii Aksenov
        5 (2)
        O indicador permite determinar instantaneamente a tendência atual por cor e níveis de Fibonacci. O painel HTF mostra a tendência atual de períodos mais altos, ajudando a determinar a força da tendência. Negocie na tendência ao mudar a cor das velas ou negocie contra a tendência quando o preço rompe os níveis extremos do indicador FIBO Trend PRO Benefícios do FIBO Trend PRO: O indicador nunca repinta ou altera seus valores Muito fácil de usar e intuitivo Aplicável a qualquer símbolo: FX-moedas, a
        Fibonacci automatically draws Fibonacci retracement, Because Fibonacci automatically draws Fibonacci retracement, you can know at a glance the price to buy at a push or sell back. Therefore, you can trade in favorable conditions in a trending market. We are live-streaming the actual operation of the system. Please check for yourself if it is usable. Please check it out for yourself. https://www.youtube.com/@ganesha_forex We do not guarantee your investment results. Investments should be mad
        Este quadro de tempo múltiplo e indicador de vários símbolos procura barras de pinos, estrelas da manhã / noite, engolfamentos, pinças, três linhas de ataque, barras internas e flâmulas e triângulos.   O indicador também pode ser usado no modo de gráfico único. Por favor, leia mais sobre esta opção no produto   blog .   Combinado com suas próprias regras e técnicas, este indicador permitirá que você crie (ou aprimore) seu próprio sistema poderoso. Recursos Pode monitorar todos os símbolos visív
        Utilities
        Douglas Lucio De Araujo
        Indicador com 3 funcionalidades - Relógio : Relógio independente do gráfico, não para a contagem mesmo com o mercado fechado. - Template : Após definir uma configuração em qualquer gráfico, seja padrões de cores, indicadores, zoom... A configuração será copiada para todos os gráficos ativos. - TimeFrame : Defina o TimeFrame em um gráfico, e com apenas um clique todos os gráficos ativos serão alterados para o mesmo TimeFrame.
        The FourierExtrapolationMA indicator transforms and extrapolates the Moving Average function by the Fast Fourier Transformation method. 1. The transformation period is set by two vertical lines, by default the first blue line and the second pink. 2. By default, the Moving Average (MA) line is drawn in red. 3. By Fourier Transform, the indicator builds a model of N harmonics, which is as close as possible to the MA values. The model is drawn by default in blue over the MA for the period bet
        Renko Graph   Gráfico de Renko O indicador Renko na janela do gráfico principal no local com o preço atual. O indicador exibe as mudanças de preço na forma de retângulos ("tijolos") contra o fundo de um gráfico de cotação regular. O movimento ascendente do preço, pelo número de pontos especificado nas configurações, é marcado pela adição acima do próximo retângulo anterior e movimento descendente - abaixo do retângulo anterior. O indicador é projetado para identificar visualmente a tendência pri
        Contact me for instruction, any questions! Introduction The Elliott Wave in technical analysis describes price movements in the financial market that are related to changes in trader sentiment and psychology. The 5 W Pattern (Known as 3 Drives) is an Elliott Wave pattern that is formed by 5 consecutive symmetrical moves up or down. In its bullish form, the market is making 5 drives to a bottom before an uptrend forms. In a bearish 5-drive, it is peaking before the bears take over.  5W Pattern S
        Trailing Uses Standard Deviation.   A daptive_Trailing_uses_StdDev_Indicator is an indicator of directional movement that allows you to identify a trend at the time of its inception and set the levels of a protective stop. Unlike trailing with a constant distance, the indicator uses the distance to the price proportional to the current standard deviation of StdDev. The distance is equal to the product of the standard deviation and the constant coefficient set by the user. Thus, the traili
        Sniper MACD
        Yaroslav Varankin
        4.15 (13)
        Indicador MACD Sniper que foi melhorado por vários métodos. existe um filtro adicional é suavizado várias vezes para obter o máximo de resultados um indicador de volume também é adicionado a ele para exibir com mais precisão as informações sobre o mercado e a condição atual do preço Eu aconselho você a usar o indicador nos períodos de tempo de m1 a m30, pois está configurado para prazos de curto prazo Eu aconselho você a negociar em pares de moedas altamente voláteis, por exemplo, como eur.usd -
        FREE
        Angle MT5
        Tatiana Savkevych
        Implements an oscillator based on a simple comparison of the last two moving average values ​​with improved functionality. As a result, the graph displays the delta of the two moving average values. In the case of a single value, the moving delta is calculated relative to the last two candles, which price of comparison will be specified in the Price parameter. The delta of two values ​​is often used to determine the trend, depending on the length of the moving averages, it can be a longer or sh
        SMARTMASS INDICATOR This indicator is different from all known volume indicators. It has a significant distinction; it is an algorithm that relates price movement to volume, attempting to find proportionality and efficient movement while filtering out noise and other movements that are more random and do not follow a trend or reversal. Ultimately, it reveals the true strength of the movement, indicating whether it has genuine support from bulls or bears or if it's merely a high-volume movemen
        MasterCharts
        Alexander Berger
        You can think of these indicators as moving pivot points. MasterChartsTrading Price Action Indicators show good price levels to enter or exit a trade. The Blue indicator line serves as a Bullish Trend setter. If your instrument closes above the Blue line, we think about going Long (buying). When your trading instrument closes below the Red line, we think about Shorting (selling). It is very easy to read price action if you have a reference point. These support/resistance lines are there to help
        Indicator introduction:  A channel and trend line indicator, which is a good tool for manual trading, and also can be used for creating new EAs, without drifting or repainting.  It applies to any timeframes and any symbols.   The work of the indicator is shown in the screenshots. For any novice and programming trading friend, you can write the signal into the EA to play freely, buffer 0 corresponds to the bold trend line, buffer 4 and 5 respectively corresponds to the channel's upper and lower f
        Os compradores deste produto também adquirem
        TPSproTREND PrO MT5
        Roman Podpora
        4.89 (9)
        TPSpro TREND PRO  - is a trend indicator that automatically analyzes the market and provides information about the trend and each of its changes, as well as giving signals for entering trades without redrawing! The indicator uses each candle, analyzing them separately. referring to different impulses - up or down impulse. Exact entry points into transactions for currencies, crypto, metals, stocks, indices!  Version MT4               DETAILED DESCRIPTION               R ecommended to use with an
        TPSpro RFI Levels MT5
        Roman Podpora
        4.73 (11)
        Reversal First Impulse levels (RFI)      INSTRUCTIONS        RUS       -       ENG              R ecommended to use with an indicator   -   TPSpro  TREND PRO -  Version MT4                 A key element in trading is zones or levels from which decisions to buy or sell a trading instrument are made. Despite attempts by major players to conceal their presence in the market, they inevitably leave traces. Our task was to learn how to identify these traces and interpret them correctly. Main functi
        Atomic Analyst MT5
        Issam Kassas
        4.56 (18)
        Primeiramente, vale ressaltar que este Indicador de Negociação não repinta, não redesenha e não apresenta atrasos, tornando-o ideal tanto para negociação manual quanto automatizada. Manual do utilizador: configurações, entradas e estratégia. O Analista Atômico é um Indicador de Ação de Preço PA que utiliza a força e o momentum do preço para encontrar uma vantagem melhor no mercado. Equipado com filtros avançados que ajudam a remover ruídos e sinais falsos, e aumentam o potencial de negociação.
        Atbot
        Zaha Feiz
        4.97 (34)
        AtBot: Como funciona e como usá-lo ### Como funciona O indicador "AtBot" para a plataforma MT5 gera sinais de compra e venda usando uma combinação de ferramentas de análise técnica. Ele integra a Média Móvel Simples (SMA), a Média Móvel Exponencial (EMA) e o índice de Faixa Verdadeira Média (ATR) para identificar oportunidades de negociação. Além disso, pode utilizar velas Heikin Ashi para melhorar a precisão dos sinais. Deixe uma avaliação após a compra e receba um presente especial. ### Princ
        Primeiramente, vale ressaltar que este Sistema de Trading é um Indicador Não Repintado, Não Redesenho e Não Atrasado, o que o torna ideal tanto para o trading manual quanto para o automatizado. Curso online, manual e download de predefinições. O "Sistema de Trading Inteligente MT5" é uma solução completa de trading projetada para traders novos e experientes. Ele combina mais de 10 indicadores premium e apresenta mais de 7 estratégias de trading robustas, tornando-o uma escolha versátil para dive
        Gold Stuff mt5
        Vasiliy Strukov
        4.92 (163)
        Gold Stuff mt5-um indicador de tendência projetado especificamente para o ouro, também pode ser usado em qualquer instrumento financeiro. O indicador não é redesenhado ou atrasado. O timeframe recomendado é H1. Importante! Entre em contato comigo imediatamente após a compra para obter instruções e bônus!  Você pode obter uma cópia gratuita do nosso indicador Strong Support e Trend Scanner, envie uma mensagem privada. a mim! PARÂMETRO Draw Arrow-incl.desligado. desenhar setas no gráfico. A
        Quantum Trend Sniper
        Bogdan Ion Puscasu
        4.78 (49)
        Apresentando       Quantum Trend Sniper Indicator   , o inovador Indicador MQL5 que está transformando a maneira como você identifica e negocia as reversões de tendência! Desenvolvido por uma equipe de traders experientes com experiência comercial de mais de 13 anos,       Indicador de Atirador de Tendência Quântica       foi projetado para impulsionar sua jornada de negociação a novos patamares com sua forma inovadora de identificar reversões de tendência com precisão extremamente alta. ***C
        Trend Screener Pro MT5
        STE S.S.COMPANY
        4.87 (62)
        Desbloqueie o poder da negociação de tendências com o indicador Trend Screener: sua solução definitiva de negociação de tendências, alimentada por lógica difusa e sistema de múltiplas moedas! Eleve sua negociação de tendências com o Trend Screener, o revolucionário indicador de tendências alimentado por lógica difusa. É um poderoso indicador de acompanhamento de tendências que combina mais de 13 ferramentas e recursos premium e 3 estratégias de negociação, tornando-o uma escolha versátil para to
        FX Power MT5 NG
        Daniel Stein
        5 (5)
        Receba a sua atualização diária do mercado com detalhes e screenshots através do nosso Morning Briefing aqui no mql5 e no Telegram ! O FX Power MT5 NG é a próxima geração do nosso medidor de força de moeda muito popular de longa data, o FX Power. E o que é que este medidor de força da próxima geração oferece? Tudo o que adorou no FX Power original MAIS Análise de força GOLD/XAU Resultados de cálculo ainda mais precisos Períodos de análise configuráveis individualmente Limite de cálculo personal
        Este é um indicador para MT5 que fornece sinais precisos para entrar em uma negociação sem redesenhar. Ele pode ser aplicado a qualquer ativo financeiro: forex, criptomoedas, metais, ações, índices. Ele fornecerá estimativas bastante precisas e informará quando é melhor abrir e fechar um negócio. Assista o vídeo (6:22) com um exemplo de processamento de apenas um sinal que compensou o indicador! A maioria dos traders melhora seus resultados de negociação durante a primeira semana de negociação c
        FX Volume MT5
        Daniel Stein
        4.93 (14)
        Receba a sua atualização diária do mercado com detalhes e screenshots através do nosso Morning Briefing aqui no mql5 e no Telegram ! O Volume FX é o PRIMEIRO e ÚNICO indicador de volume que fornece uma visão REAL do sentimento do mercado do ponto de vista de um corretor. Ele fornece uma visão incrível de como os participantes do mercado institucional, como corretores, estão posicionados no mercado Forex, muito mais rápido do que os relatórios COT. Ver essas informações diretamente no seu gráfi
        ICT, SMC, SMART MONEY CONCEPTS, SMART MONEY, Smart Money Concept, Support and Resistance, Trend Analysis, Price Action, Market Structure, Order Blocks, BOS/CHoCH,   Breaker Blocks ,  Momentum Shift,   Supply&Demand Zone/Order Blocks , Strong Imbalance,   HH/LL/HL/LH,    Fair Value Gap, FVG,  Premium  &   Discount   Zones, Fibonacci Retracement, OTE, Buy Side Liquidity, Sell Side Liquidity, BSL/SSL Taken, Equal Highs & Lows, MTF Dashboard, Multiple Time Frame, BigBar, HTF OB, HTF Market Structure
        FxaccurateLS
        Shiv Raj Kumawat
        WHY IS OUR FXACCCURATE LS MT5 THE PROFITABLE ? PROTECT YOUR CAPITAL WITH RISK MANAGEMENT Gives entry, stop and target levels from time to time. It finds Trading opportunities by analyzing what the price is doing during established trends. POWERFUL INDICATOR FOR A RELIABLE STRATEGIES We have made these indicators with a lot of years of hard work. It is made at a very advanced level. Established trends provide dozens of trading opportunities, but most trend indicators completely ignore them!
        ** All Symbols x All Timeframes scan just by pressing scanner button ** *** Contact me  to send you instruction and add you in "123 scanner group" for sharing or seeing experiences with other users. After 17 years of experience in the markets and programming, Winner indicator is ready. I would like to share with you! Introduction The 123 Pattern Scanner indicator with a special enhanced algorithm is a very repetitive common pattern finder with a high success rate . Interestingly, this Winner in
        Antes de tudo, vale ressaltar que esta Ferramenta de Negociação é um Indicador Não Repintante, Não Redesenhante e Não Atrasado, o que a torna ideal para negociação profissional. Curso online, manual do utilizador e demonstração. O Indicador de Conceitos de Ação de Preço Inteligente é uma ferramenta muito poderosa tanto para traders novos quanto experientes. Ele combina mais de 20 indicadores úteis em um único, combinando ideias avançadas de negociação como Análise do Trader do Círculo Intern
        IX Power MT5
        Daniel Stein
        4.17 (6)
        O   IX Power   traz finalmente a precisão imbatível do FX Power para símbolos não-Forex. Determina com exatidão a intensidade das tendências a curto, médio e longo prazo nos seus índices, acções, mercadorias, ETFs e até criptomoedas favoritos. Pode   analisar tudo o que   o seu terminal tem para oferecer. Experimente e veja como   o seu timing melhora significativamente   quando negoceia. Características principais do IX Power Resultados de cálculo 100% precisos e sem repintura - para tod
        Auto Order Block with break of structure based on ICT and Smart Money Concepts (SMC) Futures Break of Structure ( BoS )             Order block ( OB )            Higher time frame Order block / Point of Interest ( POI )    shown on current chart           Fair value Gap ( FVG ) / Imbalance   -  MTF      ( Multi Time Frame )    HH/LL/HL/LH  -  MTF      ( Multi Time Frame )  Choch  MTF      ( Multi Time Frame )  Volume Imbalance     ,  MTF          vIMB Gap’s Power of 3 Equal High
        Torne-se um Negociador Breaker e lucre com as mudanças na estrutura do mercado à medida que o preço reverte. O indicador de quebra de bloco de pedidos identifica quando uma tendência ou movimento de preço está chegando à exaustão e pronto para reverter. Ele o alerta sobre mudanças na estrutura do mercado, que normalmente ocorrem quando uma reversão ou uma grande retração está prestes a ocorrer. O indicador usa um cálculo proprietário que identifica rupturas e momento do preço. Toda vez que
        Matrix Arrow Indicator MT5
        Juvenille Emperor Limited
        5 (12)
        O   Matrix Arrow Indicator MT5   é uma tendência única 10 em 1 seguindo um indicador multi-timeframe   100% sem repintura   que pode ser usado em todos os símbolos/instrumentos:   forex ,   commodities ,   criptomoedas ,   índices ,   ações .  O  Matrix Arrow Indicator MT5  determinará a tendência atual em seus estágios iniciais, reunindo informações e dados de até 10 indicadores padrão, que são: Índice de movimento direcional médio (ADX) Índice de canal de commodities (CCI) Velas clássicas de
        Advanced Supply Demand MT5
        Bernhard Schweigert
        4.5 (14)
        Atualmente com 33% de desconto! A melhor solução para qualquer Trader Novato ou especialista! Este indicador é uma ferramenta de negociação exclusiva, de alta qualidade e acessível porque incorporamos uma série de recursos proprietários e uma nova fórmula. Com esta atualização, você poderá mostrar fusos horários duplos. Você não só será capaz de mostrar um TF mais alto, mas também mostrar ambos, o TF do gráfico, MAIS o TF mais alto: MOSTRANDO ZONAS ANINHADAS. Todos os traders de Oferta e Demanda
        Was: $249  Now: $99   Market Profile defines a number of day types that can help the trader to determine market behaviour. A key feature is the Value Area, representing the range of price action where 70% of trading took place. Understanding the Value Area can give traders valuable insight into market direction and establish the higher odds trade. It is an excellent addition to any system you may be using. Inspired by Jim Dalton’s book “Mind Over Markets”, this indicator is designed to suit the
        Agora US $ 147 (aumentando para US $ 499 após algumas atualizações) - Contas ilimitadas (PCs ou Macs) Manual do usuário do RelicusRoad + vídeos de treinamento + acesso ao grupo de discórdia privado + status VIP UMA NOVA FORMA DE OLHAR PARA O MERCADO O RelicusRoad é o indicador de negociação mais poderoso do mundo para forex, futuros, criptomoedas, ações e índices, oferecendo aos traders todas as informações e ferramentas necessárias para se manterem rentáveis. Fornecemos análises técnica
        Este painel mostra os últimos   padrões harmónicos   disponíveis para os símbolos seleccionados, pelo que poupará tempo e será mais eficiente /   versão MT4 . Indicador gratuito:   Basic Harmonic Pattern Colunas do indicador Symbol :   aparecem os símbolos seleccionados Trend :   de alta ou de baixa Pattern :   tipo de padrão (gartley, borboleta, morcego, caranguejo, tubarão, cifra ou ABCD) Entry :   preço de entrada SL:   preço de paragem de perda TP1:   preço do 1º take profit TP2:   preç
        TPA True Price Action indicator reveals the true price action of the market makers through 100% non-repainting signals strictly at the close of a candle! TPA shows entries and re-entries, every time the bulls are definitely stronger than the bears and vice versa. Not to confuse with red/green candles. The shift of power gets confirmed at the earliest stage and is ONE exit strategy of several. There are available now two free parts of the TPA User Guide for our customers. The first "The Basics"
        Difícil de encontrar e com pouca frequência, as divergências são um dos cenários de negociação mais confiáveis. Este indicador localiza e verifica automaticamente divergências ocultas e regulares usando seu oscilador favorito. [ Guia de instalação | Guia de atualização | Solução de problemas | FAQ | Todos os produtos ] Fácil de trocar Encontra divergências regulares e ocultas Suporta muitos osciladores conhecidos Implementa sinais de negociação baseados em fugas Exibe níveis adequados de
        MetaForecast M5
        Vahidreza Heidar Gholami
        5 (2)
        MetaForecast prevê e visualiza o futuro de qualquer mercado com base nas harmonias nos dados de preços. Embora o mercado nem sempre seja previsível, se houver um padrão nos preços, o MetaForecast pode prever o futuro com a maior precisão possível. Em comparação com outros produtos similares, o MetaForecast pode gerar resultados mais precisos ao analisar as tendências do mercado. Parâmetros de entrada Past size (Tamanho do passado) Especifica o número de barras que o MetaForecast usa para criar
        Trend Hunter MT5
        Andrey Tatarinov
        4 (2)
        Trend Hunter é um indicador de tendência para trabalhar nos mercados Forex, criptomoeda e CFD. Uma característica especial do indicador é que ele segue a tendência com confiança, sem alterar o sinal quando o preço ultrapassa ligeiramente a linha de tendência. O indicador não é redesenhado; um sinal para entrar no mercado aparece após o fechamento da barra. Ao avançar ao longo de uma tendência, o indicador mostra pontos de entrada adicionais na direção da tendência. Com base nesses sinais, voc
        PZ Swing Trading MT5
        PZ TRADING SLU
        5 (4)
        Swing Trading é o primeiro indicador projetado para detectar oscilações na direção da tendência e possíveis oscilações de reversão. Ele usa a abordagem de negociação de linha de base, amplamente descrita na literatura de negociação. O indicador estuda vários vetores de preço e tempo para rastrear a direção da tendência agregada e detecta situações nas quais o mercado está sobrevendido ou sobrecomprado em excesso e pronto para corrigir. [ Guia de instalação | Guia de atualização | Solução de prob
        Stratos Pali Indicator is a revolutionary tool designed to enhance your trading strategy by accurately identifying market trends. This sophisticated indicator uses a unique algorithm to generate a complete histogram, which records when the trend is Long or Short. When a trend reversal occurs, an arrow appears, indicating the new direction of the trend. Important Information Revealed Leave a review and contact me via mql5 message to receive My Top 5 set files for Stratos Pali at no cost ! Do
        Easy By Sell is a market indicator for opening and closing positions. It becomes easy to track market entries with alerts. It indicates trend reversal points when a price reaches extreme values ​​and the most favorable time to enter the market. it is as effective as a Fibonacci to find a level but it uses different tools such as an algorithm based on ATR indicators and Stochastic Oscillator. You can modify these two parameters as you wish to adapt the settings to the desired period. My othe
        Mais do autor
        ** All Symbols x All Timeframes scan just by pressing scanner button ** *** Contact me  to send you instruction and add you in "123 scanner group" for sharing or seeing experiences with other users. After 17 years of experience in the markets and programming, Winner indicator is ready. I would like to share with you! Introduction The 123 Pattern Scanner indicator with a special enhanced algorithm is a very repetitive common pattern finder with a high success rate . Interestingly, this Winner in
        Market Structure
        Reza Aghajanpour
        4.85 (26)
        ** All Symbols x All Timeframes scan just by pressing scanner button ** *** Contact me  to send you instruction and add you in "Market Structure group" for sharing or seeing experiences with other users. Introduction: Market structure is important for both new and professional traders since it can influence the liquidity and price action of a market (Breakout and Retest). It’s also one of the most commonly used techniques to understand trends, identify potential reversal points, and get a feel f
        **   All Symbols   x   All Timeframes   scan just by pressing scanner button ** *** Contact me  to send you instruction and add you in "Trend Reversal group" for sharing or seeing experiences with other users. Introduction: Trendlines are the most famous technical analysis in trading . Trendlines continually form on the charts of markets across all the different timeframes providing huge opportunities for traders to jump in and profit on the action. In the other hand,  The trendline reversal str
        Market Structure MT5
        Reza Aghajanpour
        5 (3)
        **   All Symbols   x   All Timeframes   scan just by pressing scanner button ** *** Contact me  to send you instruction and add you in "Market Structure group" for sharing or seeing experiences with other users. Introduction: Market structure is important for both new and professional traders since it can influence the liquidity and price action of a market. It’s also one of the most commonly used techniques to understand trends, identify potential reversal points, and get a feel for current mar
        Wolfe Wave Scanner MT5
        Reza Aghajanpour
        5 (4)
        **  All Symbols  x  All Timeframes  scan just by pressing scanner button ** *** Contact me  to send you instruction and add you in "Wolfe Wave Scanner group" for sharing or seeing experiences with other users. Introduction: A Wolfe Wave is created with five-wave patterns in price. It shows supply and demand and a fight towards a balance price. T hese waves of price actions can help traders identify the boundaries of   the trend . Also  It helps forecast how the price will move in the near futu
        QM Pattern Scanner MT4
        Reza Aghajanpour
        4.75 (4)
        Contact me  to send you instruction and add you in group. QM (Quasimodo) Pattern is based on Read The Market(RTM) concepts. The purpose of this model is to face the big players of the market (financial institutions and banks), As you know in financial markets, big traders try to fool small traders, but RTM prevent traders from getting trapped. This style is formed in terms of price candles and presented according to market supply and demand areas and no price oscillator is used in it. RTM con
        The 1 2 3 Pattern Scanner
        Reza Aghajanpour
        4.79 (53)
        ** All Symbols x All Timeframes scan just by pressing scanner button ** After 17 years of experience in the markets and programming, Winner indicator is ready. I would like to share with you! *** Contact me  to send you instruction  and add you in "123 scanner group" for sharing or seeing experiences with other users. Introduction The 123 Pattern Scanner indicator with a special enhanced algorithm is a very repetitive common pattern finder with a high success rate . Interestingly, this Winner in
        M W Scanner
        Reza Aghajanpour
        5 (8)
        **   All Symbols   x   All Timeframes   scan just by pressing scanner button ** *** Contact me  to send you instruction and add you in "M W Scanner group" for sharing or seeing experiences with other users. Introduction: Double Top(M) and Double Bottom(W) is a very repetitive common type of price reversal patterns. Double Top resembles M pattern and indicates bearish reversal whereas Double Bottom resembles W pattern and indicates a bullish reversal that they have  high win  rate. The M W Scanne
        ABCD Pattern Scanner
        Reza Aghajanpour
        5 (19)
        ** All Symbols x All Timeframes scan just by pressing scanner button ** *** Contact me  to send you instruction and add you in "ABCD scanner group" for sharing or seeing experiences with other users. Introduction This indicator scans AB=CD retracement patterns in all charts. The ABCD is the basic foundation for all harmonic patterns and highly repetitive with a high success rate . The ABCD Scanner indicator is a scanner reversal ABCD pattern that helps you identify when the price is about to ch
        Harmonic Pattern Scanner
        Reza Aghajanpour
        4.67 (15)
        ** All Symbols x All Time frames scan just by pressing scanner button ** *** Contact me  to send you instruction and add you in "Harmonic Scanner group" for sharing or seeing experiences with other users. Introduction Harmonic Patterns are best used to predict turning point. Harmonic Patterns give you high win rate and high opportunities for trade in during one day. This indicator detects the best and successful patterns base on Harmonic Trading books . The Harmonic Patterns Scanner Scans All ch
        RSI Divergences Scanner MT5
        Reza Aghajanpour
        4.73 (11)
        ** All Symbols x All Timeframes scan just by pressing scanner button ** ***Contact me to send you instruction and add you in "RSI scanner group" for sharing or seeing experiences with other users. Introduction RSI divergence is a main technique used to determine trend reversing when it’s time to sell or buy because prices are likely to drop or pick in the charts. The RSI Divergence indicator can help you locate the top and bottom of the market. This indicator finds Regular divergence for pullba
        ** All Symbols x All Timeframes scan just by pressing scanner button ** *** Contact me  to send you instruction and add you in "ABCD scanner group" for sharing or seeing experiences with other users. Introduction This indicator scans AB=CD retracement patterns in all charts. The ABCD is the basic foundation for all harmonic patterns and highly repetitive with a high success rate . The ABCD Scanner indicator is a scanner reversal ABCD pattern that helps you identify when the price is about to cha
        Trend Reversal MT4
        Reza Aghajanpour
        5 (5)
        **   All Symbols   x   All Timeframes   scan just by pressing scanner button ** *** Contact me  to send you instruction and add you in "Trend Reversal group" for sharing or seeing experiences with other users. Introduction: Trendlines are the most famous technical analysis in trading . Trend lines continually form on the charts of markets across all the different timeframes providing huge opportunities for traders to jump in and profit on the action. In the other hand,  The trend line reversal s
        QM Pattern Scanner MT5
        Reza Aghajanpour
        5 (3)
        Contact me  to send you instruction and add you in group. QM (Quasimodo) Pattern is based on Read The Market(RTM) concepts. The purpose of this model is to face the big players of the market (financial institutions and banks), As you know in financial markets, big traders try to fool small traders, but RTM prevent traders from getting trapped. This style is formed in terms of price candles and presented according to market supply and demand areas and no price oscillator is used in it. RTM con
        AI Next Level
        Reza Aghajanpour
        5 (1)
        The next generation G P T AI model quickly gained significant attention with its broad range of capabilities and versatility, We used its expertise in assisting prediction prices in formulating and applying improved trading strategies. Our AI core is capable of extracting data insights from financial news, Sentiment Analysis , specific formula, Oscillators and indicators status and other unstructured data sources. This information can then be used in conjunction with other datasets to make our
        Head and Shoulder MT4
        Reza Aghajanpour
        5 (4)
        **   All Symbols   x   All Timeframes   scan just by pressing scanner button ** *** Contact me  to send you instruction and add you in "Head & Shoulders Scanner group" for sharing or seeing experiences with other users. Introduction: Head and Shoulders   Pattern  is a very repetitive common type of price reversal patterns. The pattern appears on all time frames and can be used by all types of traders and investors.   The  Head and Shoulders  Scanner indicator  Scans All charts just by pressing o
        Swing Scanner MT5
        Reza Aghajanpour
        5 (6)
        **   All Symbols   x   All Time frames   scan just by pressing scanner button ** *** Contact me  to send you instruction and add you in "Swing scanner group" for sharing or seeing experiences with other users. Introduction: Swing Scanner   is the indicator designed to detect swings in the direction of the trend and possible reversal swings. The indicator studies several price and time vectors to track the aggregate trend direction and detects situations in which the market is oversold or overbou
        Swing Scanner
        Reza Aghajanpour
        4.6 (20)
        ** All Symbols x All Time frames scan just by pressing scanner button ** *** Contact me  to send you instruction and add you in "Swing scanner group" for sharing or seeing experiences with other users. Introduction: Swing Scanner is the indicator designed to detect swings in the direction of the trend and possible reversal swings. The indicator studies several price and time vectors to track the aggregate trend direction and detects situations in which the market is oversold or overbought and r
        RSI Divergence Scanner
        Reza Aghajanpour
        4.46 (13)
        ** All Symbols x All Timeframes scan just by pressing scanner button ** *** Contact me  to send you instruction and add you in "RSI scanner group" for sharing or seeing experiences with other users. Introduction RSI divergence is a main technique used to determine trend reversing when it’s time to sell or buy because prices are likely to drop or pick in the charts. The RSI Divergence indicator can help you locate the top and bottom of the market. This indicator finds Regular divergence for pu
        All Divergence Scanner MT4
        Reza Aghajanpour
        4.93 (15)
        ** All Symbols x All Timeframes scan just by pressing scanner button ** *** Contact me  to send you instruction and add you in "All Divergences scanner group" for sharing or seeing experiences with other users. Introduction Divergence is a main technique used to determine trend reversing when it’s time to sell or buy because prices are likely to drop or pick in the charts. All Divergence indicator can help you locate the top and bottom of the market. This indicator finds Regular divergences for
        M W Scanner MT5
        Reza Aghajanpour
        5 (5)
        **   All Symbols   x   All Timeframes   scan just by pressing scanner button ** *** Contact me  to send you instruction and add you in "M W Scanner group" for sharing or seeing experiences with other users. Introduction: Double Top(M) and Double Bottom(W) is a very repetitive common type of price reversal patterns. Double Top resembles M pattern and indicates bearish reversal whereas Double Bottom resembles W pattern and indicates a bullish reversal that they have  high win  rate. The M W Scanne
        ** All Symbols x All Time frames scan just by pressing scanner button ** *** Contact me  to send you instruction and add you in "Harmonic Scanner group" for sharing or seeing experiences with other users. Introduction Harmonic Patterns are best used to predict turning point. Harmonic Patterns give you high win rate and high opportunities for trade in during one day. This indicator detects the best and successful patterns based on Harmonic Trading concepts . The   Harmonic Patterns   Scanner   Sc
        **   All Symbols   x   All Timeframes   scan just by pressing scanner button ** *** Contact me  to send you instruction and add you in "Head & Shoulders Scanner group" for sharing or seeing experiences with other users. Introduction: Head and Shoulders   Pattern  is a very repetitive common type of price reversal patterns.   The pattern appears on all time frames and can be used by all types of traders and investors.   The  Head and Shoulders  Scanner indicator  Scans All charts just by pressing
        Wolfe Wave Scanner MT4
        Reza Aghajanpour
        4.56 (9)
        **  All Symbols  x  All Timeframes  scan just by pressing scanner button ** *** Contact me  to send you instruction and add you in "Wolfe Wave Scanner group" for sharing or seeing experiences with other users. Introduction: A Wolfe Wave is created with five-wave patterns in price. It shows supply and demand and a fight towards a balance price. T hese waves of price actions can help traders identify the boundaries of   the trend . Also  It helps forecast how the price will move in the near future
        Introduction RSI divergence is a main technique used to determine trend reversing when it’s time to sell or buy because prices are likely to drop or pick in the charts. The RSI Divergence indicator can help you locate the top and bottom of the market. This indicator finds Regular divergence for pullback the market and also finds hidden RSI Divergence to show continuing trend. This indicator shows divergence on the RSI that is a strong hint for an excellent entry point and finds immediately with
        FREE
        EA Gold Avatar
        Reza Aghajanpour
        5 (4)
        Gold Avatar is a Fully Automated for Trading XAUUSD/Gold. It will be 300$, only the first 4 sales are 199$. ** New Update = Version 3 ** Live signal monitoring: myfxbook.com/portfolio/gold-avatar/10941196 Contact me immediately after the purchase to send you instruction and add you in group. Default Settings for XAUUSD M15 FEATURES: Easy-to-use, just add EA on chart without any setting. News Filter and Auto GMT Time are  supported XAUUSD - M15 Sets are provided  Limited number of Buyers
        Market Heartbeat
        Reza Aghajanpour
        5 (7)
        Market Heartbeat in your hand! Introduction The Market Heartbeat indicator with a special enhanced algorithm (volume, money flow, cycle of market and a secret value) is a very repetitive trend finder with a high success rate . Interestingly, this Winner indicator indicates that the trend has changed its direction or the end of a trend retracement or even appears at the range market. The Market Heartbeat can use in scalping trading or trend trading. It finds immediately with alarm, notification a
        This is diamond! Contact me  to send you instruction and add you in group. Diamond Pattern is based on Read The Market(RTM) concepts. The purpose of this model is to face the big players of the market (financial institutions and banks), As you know in financial markets, big traders try to fool small traders, but RTM prevent traders from getting trapped. This style is formed in terms of price candles and presented according to market supply and demand areas and no price oscillator is used in it
        **   All Symbols   x   All Timeframes   scan just by pressing scanner button ** *** Contact me  to send you instruction and add you in "Channel Scanner group" for sharing or seeing experiences with other users. Introduction: The Channel pattern is described as the area located between two trend lines. This area is used for a measure of a trading range. In this case, the upper trend line connects price highs while the lower trend line connects price lows. Also when it comes to breakout points, it
        MACD Divergence Scanner
        Reza Aghajanpour
        5 (2)
        ** All Symbols x All Time frames scan just by pressing scanner button ** *** Contact me  to send you instruction and add you in "Divergence group" for sharing or seeing experiences with other users. Introduction MACD divergence is a main technique used to determine trend reversing when it’s time to sell or buy because prices are likely to drop or pick in the charts. The MACD Divergence indicator can help you locate the top and bottom of the market. This indicator finds Regular divergence for pul
        Filtro:
        qingfu666
        188
        qingfu666 2024.08.05 14:46 
         

        很友好的界面,很简单的用法,必须5星好评

        Reza Aghajanpour
        85985
        Resposta do desenvolvedor Reza Aghajanpour 2024.08.05 20:14
        English: Very friendly interface, very simple to use, must give 5 stars
        Thank you for your awesome feedback. ⛱️🏖️🥇🌹🙏
        Enjoy your trading.⭐⭐⭐⭐⭐
        krzys1973
        396
        krzys1973 2024.04.02 09:48 
         

        The indicator is repainted, it looks good in the history. Worthless.

        Reza Aghajanpour
        85985
        Resposta do desenvolvedor Reza Aghajanpour 2024.04.02 12:51
        Please after purchase, **contact me to send you instruction and add you in group** to find a best way for profits.🙏🙏
        ceejay1962
        416
        ceejay1962 2024.03.19 18:15 
         

        It is a nice indicator and handy to scan all Market Watch symbols at the same time. It has paid for itself many times over.

        ypfy00
        168
        ypfy00 2023.03.30 02:50 
         

        O usuário não deixou nenhum comentário para sua avaliação

        lzclaudio0210
        45
        lzclaudio0210 2023.03.14 20:18 
         

        O usuário não deixou nenhum comentário para sua avaliação

        anmnayem
        149
        anmnayem 2023.02.22 15:33 
         

        This is one of the best indicator in the market and I can see positive growth in my equity and seller is very responsive and helpful

        Don Croome
        146
        Don Croome 2022.08.25 06:18 
         

        O usuário não deixou nenhum comentário para sua avaliação

        Responder ao comentário
        Versão 1.8 2024.08.05
        -Fixed M1 Timeframe for scan in input
        Versão 1.7 2024.03.19
        -removed extra printing
        Versão 1.6 2023.05.05
        - Added color option for divergence lines in input setting
        Versão 1.5 2023.03.02
        - Improved alert messages
        Versão 1.4 2023.02.23
        -Added new option : Selective Time Frames for scan in input setting
        Versão 1.3 2023.02.21
        - Fixed a bug in Time Frames Buttons
        Versão 1.2 2022.11.04
        updated input setting :
        - Objects state When change Time Frame - Remove all objects or Remove just MACD Divergence objects
        Versão 1.1 2022.10.14
        - Fixed notification messages