Magic Finger Singal
- Indicadores
- Hui Zhao
- Versão: 3.60
- Atualizado: 29 dezembro 2024
- Ativações: 5
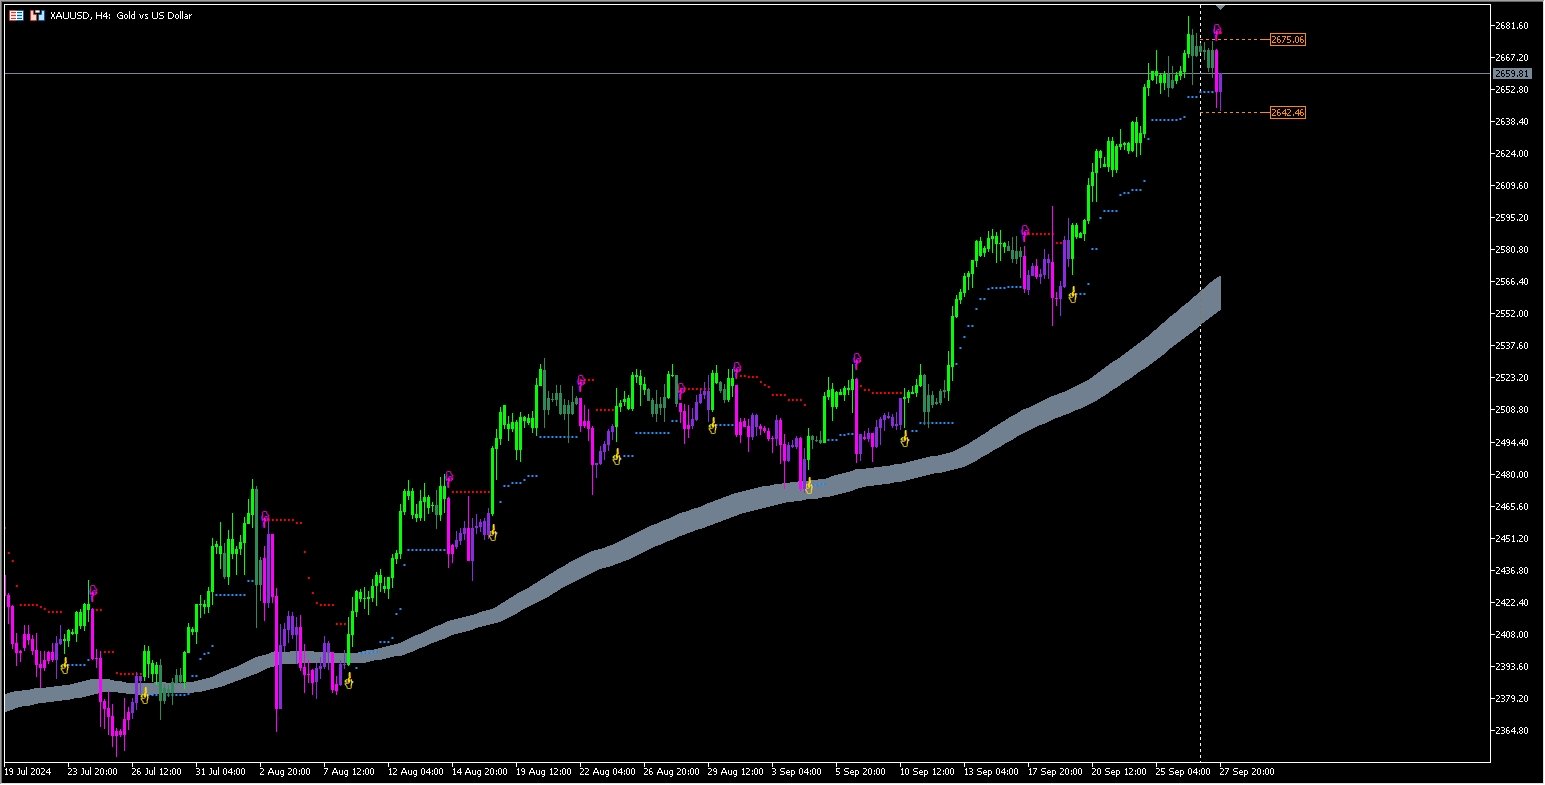
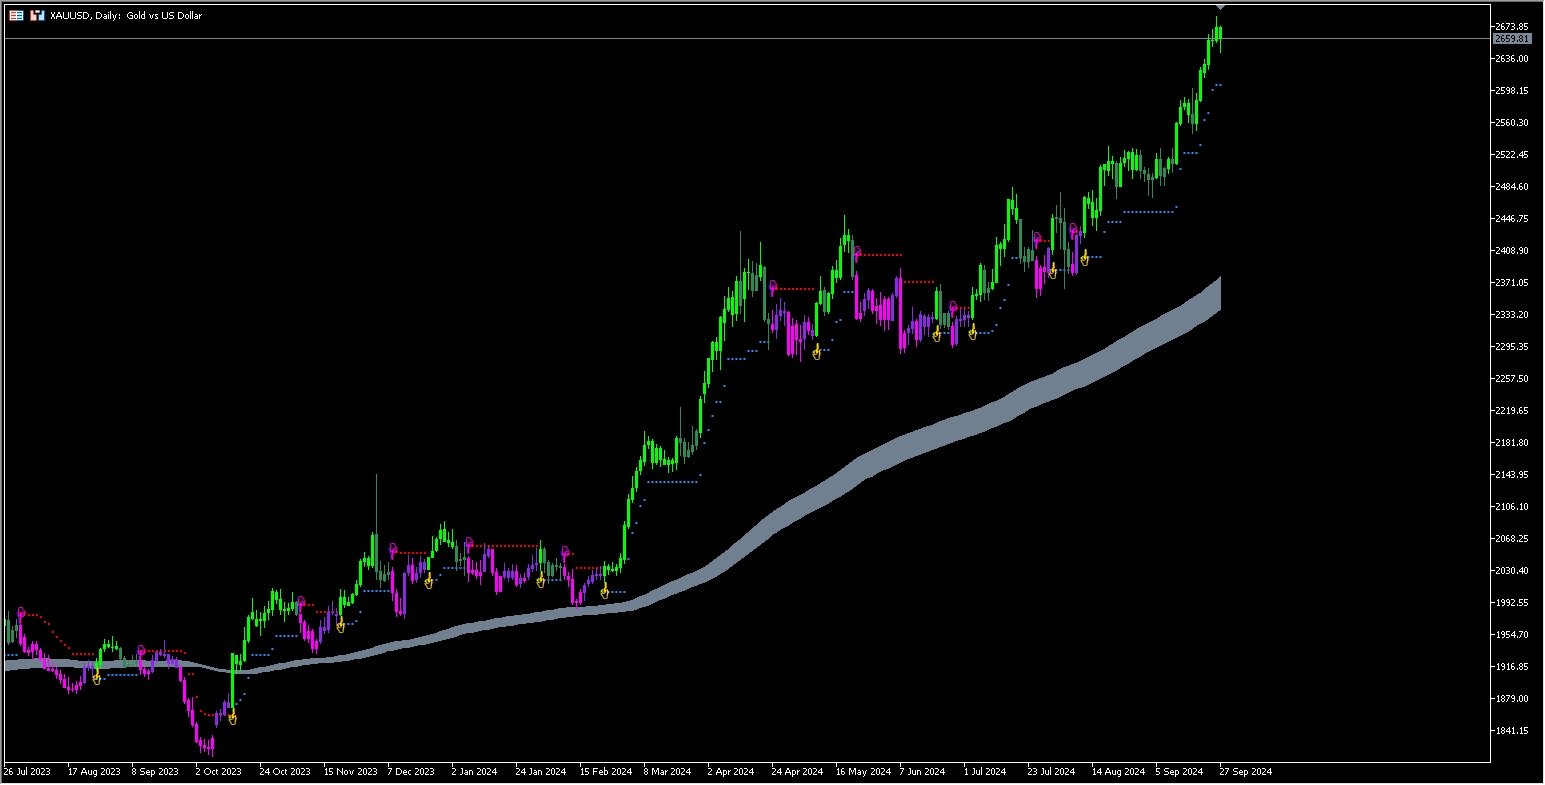
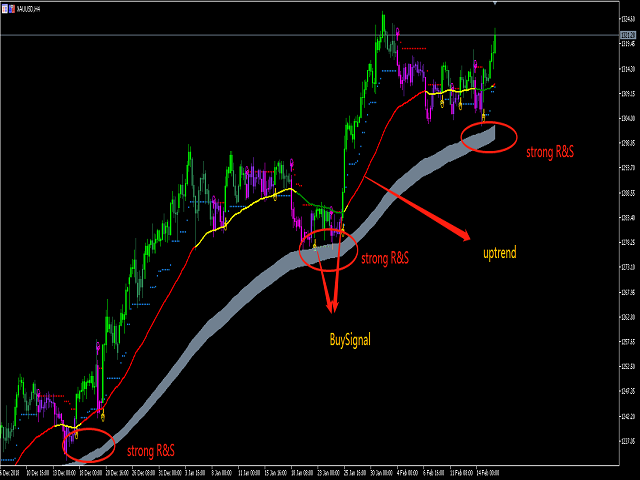
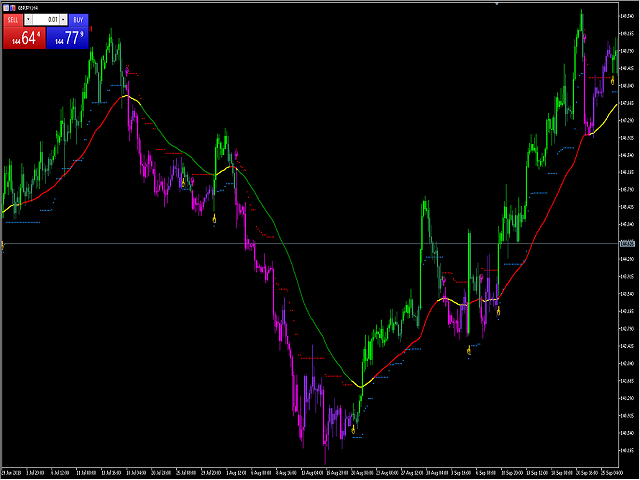
Magic Finger can help you identify trends and trading opportunities clearly. The finger points to the open position signal, and the discoloration line is confirmed by the trend.
- If you are a day trader, you can choose to trade during a period of active trading, referring to the discoloration line as the basis for the next order, finger signal as a filter.
- If you are a trend trader, you can choose a period above H1, wait for the appearance of the finger signal in the key price area, and enter the market to trade, and then use the discoloration line as a confirmation of the trend.
- Stop loss can be used as a basis for stop loss dots.
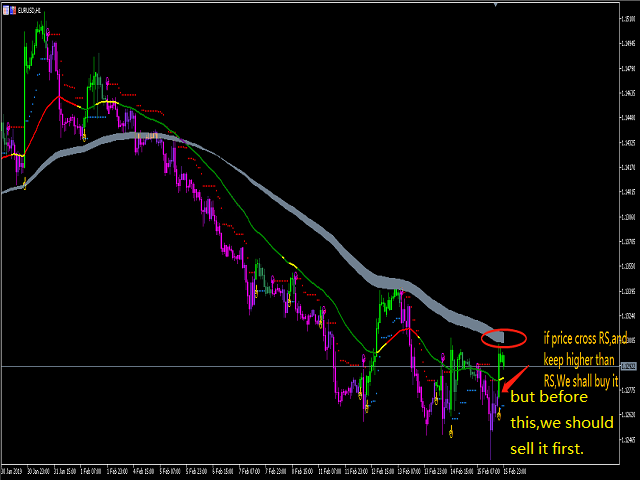
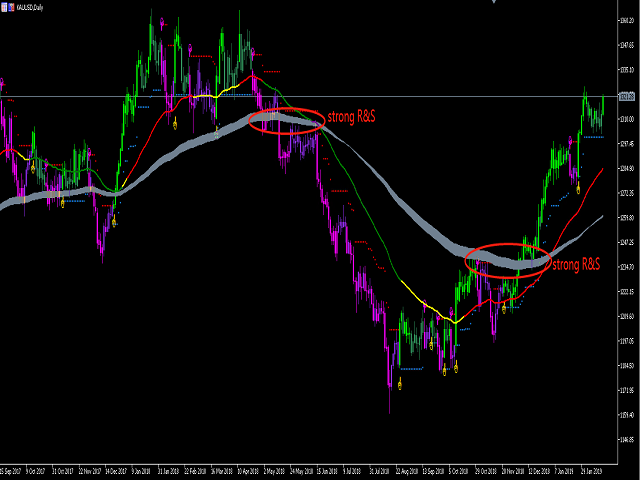
- RS is an important long-short watershed.
Input parameters:
| RISK | 5 |
| MONEY RISK | 2.0 |
| AlertOption | ********************************* |
| Local Alert | true |
| TimesOfAlerts | 2 |
| E-Mail Alert | false |
| App PUSH Notification | false |
| Display_Option | ********************************* |
| Barclor_Display | true |
| RS_Display | true |
| Line2_Display | false |
| ***ADR Option** | ********************************* |
| Display ADR | true |
| ATR Period | 18 |
| Normal Color | DarkOrange |
| Reach Color | MediumBlue |
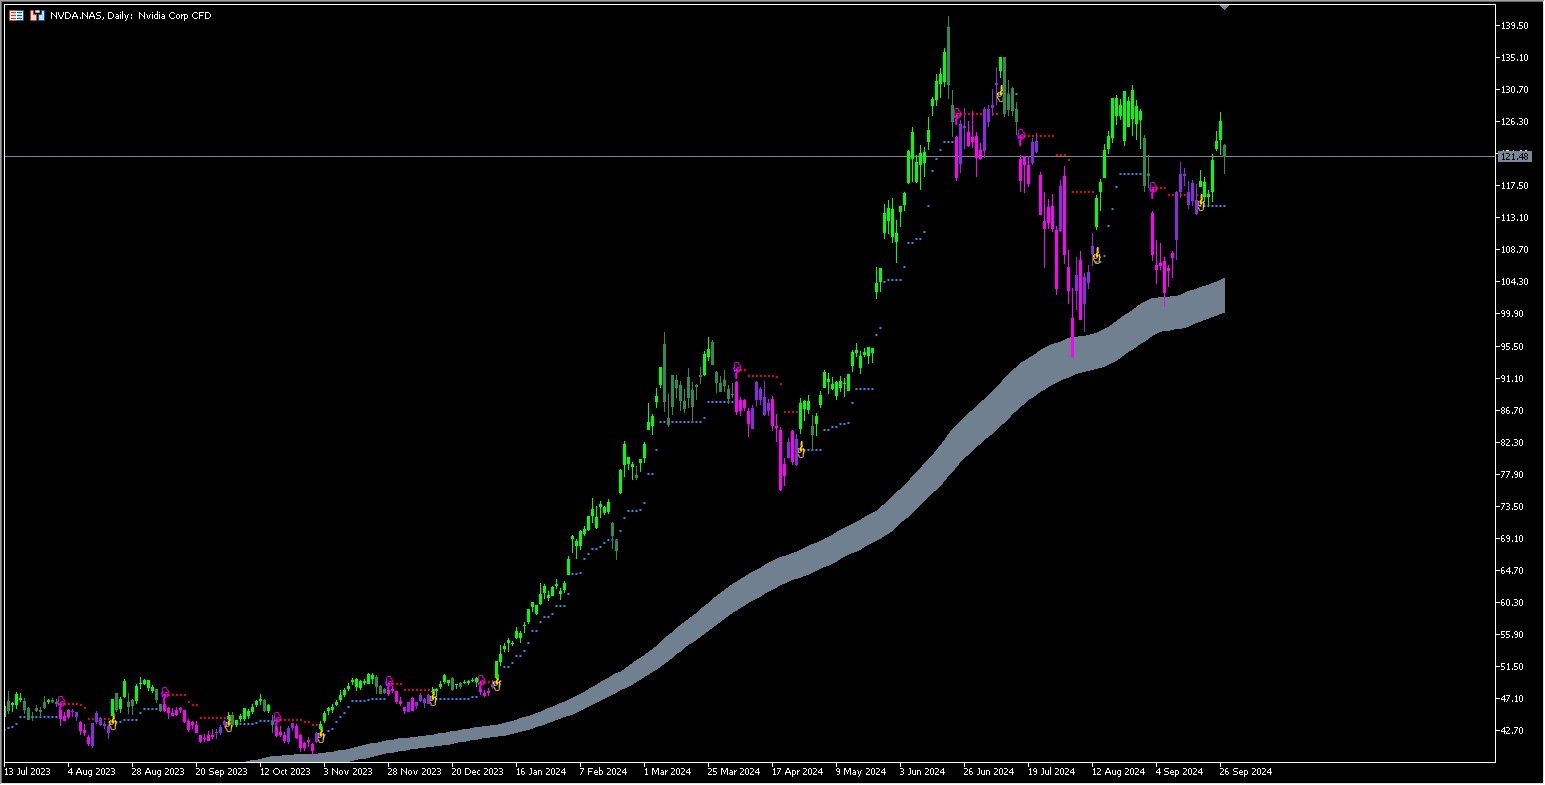

Really good indicator, I use the colored candles and entries all the time. Best on longer TF's like 1hr, 4hr, Daily
Excellent support from the developer.