Magic Finger Singal
Magic Finger 能帮助你清晰的发现趋势及交易机会。此系统根据经典策略加上个人交易经验制作。您也可以根据此指标加上您的交易风格去编写EA。
手指指向为开仓信号,变色线为趋势确认。如果您是日内交易者,可以选择在交易活跃的时间段内交易,参考变色线作为下单方向依据,手指信号作为过滤器。
如果你是趋势交易者,可以选择在H1以上的周期,在关键价格区域等待手指信号的出现,并入市交易,然后以变色线作为趋势的确认。
止损可以止损圆点作为依据。
输入参数如下:
| RISK | 5 |
| MONEY RISK | 2.0 |
| AlertOption | ********************************* |
| Local Alert | true |
| TimesOfAlerts | 2 |
| E-Mail Alert | false |
| App PUSH Notification | false |
| ***ADR Option** | ********************************* |
| Display ADR | true |
| ATR Period | 18 |
| Normal Color | DarkOrange |
| Reach Color | MediumBlue |
更新记录:
版本 3.41 2019.04.09 问题修复.
版本 3.40 2019.04.08 1.增加Moving ADR,用于指引日内价格的波动范围,为日内交易者提供止盈参考价格。(Moving ADR指标可以在市场中独立购买 ,只需要很低的价格)
2.优化了RS遮挡K线的问题。
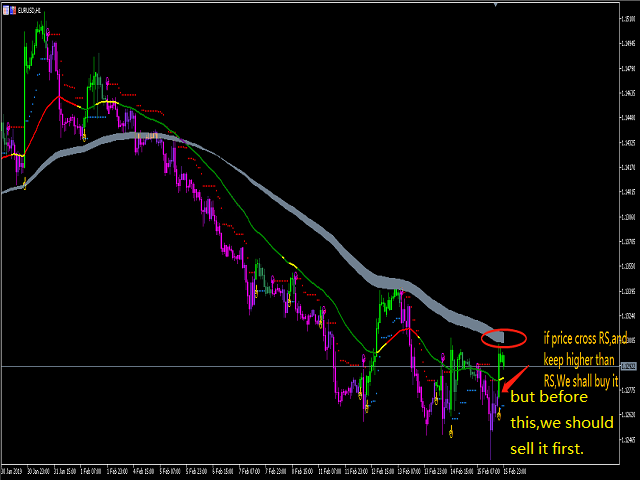
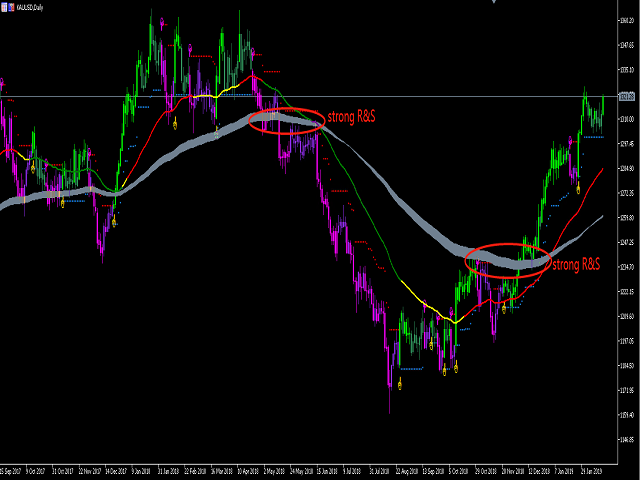
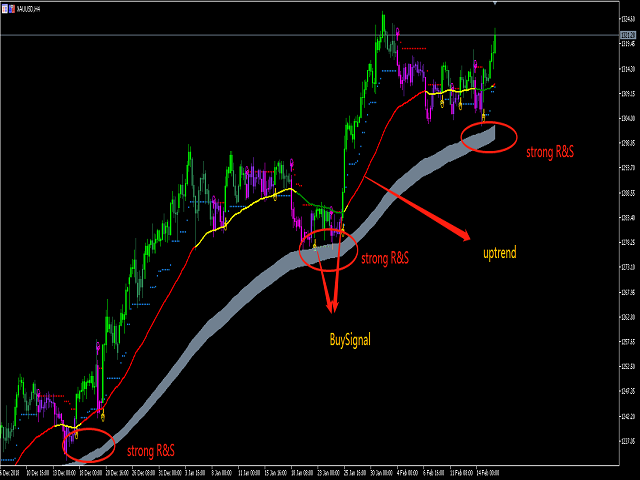
版本 3.30 2019.02.17 增加了RS,当价格在RS区域遇阻或穿越,说明趋势延续或反转,RS区域为最佳交易位置,为你获得更好的风险回报比。

Really good indicator, I use the colored candles and entries all the time. Best on longer TF's like 1hr, 4hr, Daily
Excellent support from the developer.