• Visão global
  • Comentários (30)
  • Discussão (20)
  • O que há de novo

Important Lines

4.88

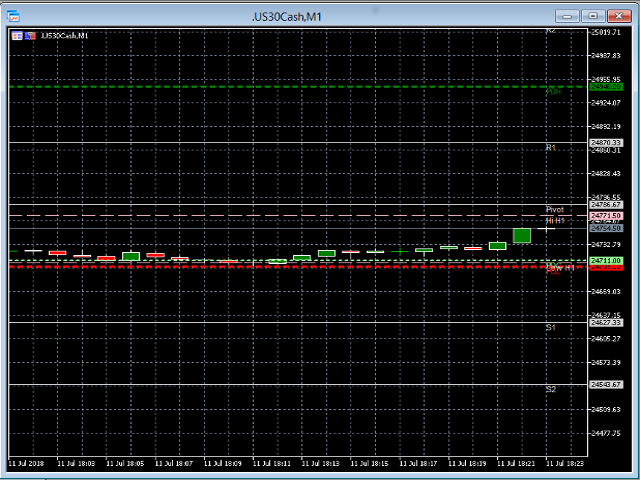
This indicator displays Pivot-Lines, preday high and low, preday close and the minimum and maximum of the previous hour. You just have to put this single indicator to the chart to have all these important lines, no need to setup many single indicators.


Why certain lines are important

Preday high and low: These are watched by traders who trade in a daily chart. Very often, if price climbs over or falls under a preday low/high there is an acceleration in buying/selling. It is a breakout out of a daily range.

Prehour high and low: Are watched by breakout traders who trade in the hourly chart. The opening range breakout strategy (see Toby Crabel) uses the hourly range of the past hourly candle and trades the breakout at the market opening. Placing stop loss near the hour lines may be very effective.

Pivot Points: Pivots stem from the former pit traders who needed a quick and rough orientation of the situation of the price. Today still many traders look at these points. When trading, the pivot point, the supports (s1, s2, s3) or resistances (r1, r2, r3) cause the price to slow down or even turn.


Calculation Methods

Pivots:

Pivot Point = (high + close + low)/3 (preday)

r1 = (2 * pivot) - low

s1 = (2 * pivot) - high

r2 = pivot + (r1 - s1)

r3 = high + (2* (pivot - low))

s2 = pivot - (r1 - s1)

s3 = low - (2*(high - pivot));


All the other lines are derived from the history of MetaTrader 5.


Customization

The colors of the lines and labels can be customized.

  • pivotColor
  • s1Color
  • s2Color
  • s3Color
  • r1Color
  • r2Color
  • r3Color
  • lowH1Color
  • hiH1Color
  • PDHColor
  • PDLColor
  • PDCColor


Why did I program this indicator

As I started with MetaTrader 5 about a year ago I did not find any matching indicator. As I used it every day, I thought that it could be of use for other traders too.

This indicator is used in conjunction of my Opening Range Breakout robot I will publish soon. I plan to make this indicator "speaking". So it will be possible to "trade what you see and hear".


Issues and disclaimer

I use this indicator for about half a year, in general, it runs well.

On Mondays it might show wrong numbers, it might be, that it takes data from Saturday.

There is no guarantee for this product in no way.


12.7.2018, Terence V. Gronowski "SwissTrader"

Comentários 20
drzocker
105
drzocker 2023.01.08 09:30 
 

Gute arbeit

vvm-55
69
vvm-55 2022.10.17 11:02 
 

Ich bin zufrieden

roket52
14
roket52 2022.09.22 04:50 
 

Thank you much appreciated for this indicator as it provides these key levels. my only suggestion for improvement would be the ability to customise the line types and size and the ability to move the text positions too. Thanks for your work

Produtos recomendados
Donchian Channel (ou canal de Donchian) é um indicador criado por  Richard Donchian. Ele é  formado tomando a máxima mais alta e a mais baixa mais baixa do último período especificado em velas. A área entre alta e baixa é o canal para o período escolhido. Sua configuração é simples. É possível ter a média entre a linha superior e inferior além de alertas quando o preço atinge um dos lados. Se tiver alguma dúvida ou encontrar alguma falha, me contate. Faça bom uso! Este é um indicador gratuito,
FREE
Follow The Line MT5
Oliver Gideon Amofa Appiah
4.26 (23)
This indicator obeys the popular maxim that: "THE TREND IS YOUR FRIEND" It paints a GREEN line for BUY and also paints a RED line for SELL. (you can change the colors). It gives alarms and alerts of all kinds. IT DOES NOT REPAINT and can be used for all currency pairs and timeframes. Yes, as easy and simple as that. Even a newbie can use it to make great and reliable trades. NB: For best results, get my other premium indicators for more powerful and reliable signals. Get them here: https://www.m
FREE
Free automatic Fibonacci is an indicator that automatically plots a Fibonacci retracement based on the number of bars you select on the BarsToScan setting in the indicator. The Fibonacci is automatically updated in real time as new highest and lowest values appears amongst the selected bars. You can select which level values to be displayed in the indicator settings. You can also select the color of the levels thus enabling the trader to be able to attach the indicator several times with differe
FREE
Are you tired of drawing trendlines every time you're analyzing charts? Or perhaps you would like more consistency in your technical analysis. Then this is for you. This indicator will draw trend lines automatically when dropped on a chart. How it works Works similar to standard deviation channel found on mt4 and mt5. It has 2 parameters: 1. Starting Bar 2. Number of bars for calculation The   starting bar   is the bar which drawing of the trend lines will begin, while the   number of bars for c
FREE
You can download the Full version with more features here . Introduction Harmonic Patterns are best used to predict turning point. Harmonic Patterns give you high win rate and high opportunities for trade in during one day. This indicator detects the best and successful patterns base on Harmonic Trading books by Mr. Scott M.. Main Features Detect the best and   most successful patterns : Gartley, Bat, Crab, Butterfly, Cypher, Shark, Alt_Bat, Deep_Crab Easy-to-use and user friendly indicator Sca
FREE
This indicator is especially for the binary trading. Time frame is 1 minutes and exp time 5 or 3 minutes only. You must be use martingale 3 step. So you must put lots size is 10 % at most. You should use Mt2 trading platform to connect with my indicator to get more signal without human working. This indicator wining rate is over 80% but you may get 100% of profit by using martingale 3 step. You should use MT2 Trading Platform to connect meta trader platform and binary platform . You can get mt2
FREE
PZ Penta O MT5
PZ TRADING SLU
3.8 (5)
The Penta-O is a 6-point retracement harmonacci pattern which usually precedes big market movements. Penta-O patterns can expand and repaint quite a bit. To make things easier this indicator implements a twist: it waits for a donchian breakout in the right direction before signaling the trade. The end result is an otherwise repainting indicator with a very reliable trading signal. The donchian breakout period is entered as an input. [ Installation Guide | Update Guide | Troubleshooting | FAQ | A
FREE
O indicador identifica quando ocorre uma divergência entre o preço e um indicador ou oscilador. Ele identifica divergências regulares e ocultas. Combinado com suas próprias regras e técnicas, este indicador permitirá que você crie (ou aprimore) seu próprio sistema poderoso. Recursos Pode detectar divergências para os seguintes osciladores / indicadores:       MACD, OsMA, Stochastics, RSI, CCI, RVI, Awesome, ADX, ATR, OBV, Índice composto, MFI e Momentum. Apenas um oscilador / indicador pode se
FREE
Rainbow MT5
Jamal El Alama
4.33 (3)
Description : Rainbow MT5 is technical indicator based on Moving Average with period 34 and very easy to use. When price crosses above MA and MA changes color to green, then this is a signal to buy. When price crosses below MA and MA changes color to red, then this is a signal to sell. The Expert advisor ( Rainbow EA MT5 ) based on Rainbow MT5 indicator is now available here . MT4 version is available  here .
FREE
Automatic Trendlines
Pasi Hakamaki
4.64 (42)
O indicador desenha linhas de tendência no gráfico. Este indicador possui seis entradas. O usuário pode especificar rótulos alternativos para ambas as linhas. Se várias instâncias do indicador forem usadas, os rótulos devem ser diferentes. O usuário pode definir a largura e a cor das linhas e a profundidade que especifica quais picos significativos devem ser usados. Por exemplo, Depth = 10 define as linhas de tendência usando os picos e vales atuais que têm pelo menos 10 barras à direita e à esq
FREE
O Pivot Point Fibo RSJ é um indicador que traça as linhas de suporte e resistência do dia usando as proporções   de Fibonacci. Este indicador espetacular cria até 7 níveis de suporte e resistência por meio do Pivot Point usando proporções de Fibonacci. É fantástico como os preços respeitam cada nível deste suporte e resistência, onde é possível perceber possíveis pontos de entrada / saída de uma operação. Recursos Até 7 níveis de suporte e 7 níveis de resistência Defina as cores dos níveis in
FREE
Dual RSI
Paul Conrad Carlson
Indicator alerts for Dual Relative strength index rsi. Large rsi preset at 14 is below 30 small rsi preset at 4 is below 10 for buy bullish signals . Large rsi preset are 14 is above 70 small rsi preset at 4 is above 90 for sell bearish signals . Includes mobile and terminal alerts. draws lines when alerts. This indicator can help identify extremes and then the tops or bottoms of those extremes .
FREE
Ichimoku Style MT5
Javier Morales Fernandez
What is Ichimoku? The Ichimoku is a technical indicator collection that shows support and resistance levels and momentum and trend direction. It does this by taking multiple averages and plotting them on a chart. It also uses these figures to compute a “cloud” that attempts to forecast where the price may find support or resistance in the future. The Ichimoku is composed of five lines or calculations, two of which comprise a cloud where the difference between the two lines is shaded in. The lin
FREE
The indicator detects and displays М. Gartley's Butterfly pattern. The pattern is plotted by the extreme values of the ZigZag indicator (included in the resources, no need to install). After detecting the pattern, the indicator notifies of that by the pop-up window, a mobile notification and an email. The pattern and wave parameters are displayed on the screenshots. The default parameters are used for demonstration purposes only in order to increase the amount of detected patterns. Parameters
30 USD
Indicator and Expert Adviser  EA Available in the comments section of this product. Download with Indicator must have indicator installed for EA to work. Mt5 indicator alerts for bollinger band and envelope extremes occurring at the same time. Buy signal alerts occur when A bullish candle has formed below both the lower bollinger band and the lower envelope  Bar must open and close below both these indicators. Sell signal occur when A bear bar is formed above the upper bollinger band and upp
FREE
Reversal Composite Candles
MetaQuotes Ltd.
3.4 (20)
A ideia do sistema é a identificação de padrões de reversão utilizando o cálculo de candles compostos. Os padrões de reversão são semelhantes aos padrões "Martelo" e o " Homem Enforcado " da análise candlestick Japonesa, porém ele usa candles compostos em vez de uma única barra e não precisa do pequeno corpo numa composição para confirmar a reversão. Os parâmetros de entrada: Range - número máximo de barras, utilizada no cálculo de composição dos candles compostos . Minimum - tamanho mínimo d
FREE
PZ Pivot Points MT5
PZ TRADING SLU
4.95 (21)
This indicator displays pivot points in the chart, including historical vales, and supports many calculation modes for Pivot Points and S/R levels. [ Installation Guide | Update Guide | Troubleshooting | FAQ | All Products ] It plots historical levels for backtesting purposes It allows you to select the reference timeframe It implements different Pivot Point calculation modes It implements different SR calculation modes It implements customizable colors and sizes Calculation Modes The indi
FREE
Este é um indicador de agressão comprador e vendedor que analisa o formato de cada vela e projeta esses dados em forma de histograma. Há 4 histogramas em um só. Na parte frontal temos dois: Superior - força compradora Inferior - força vendedor Na parte de trás temos também dois histogramas, ambos da mesma cor. Eles medem a força conjunta dos compradores e vendedores. Esses histogramas podem ser desativados nos Parâmetros de Entrada. É possível também ter o volume real ou de tick para fazer essa
FREE
HMA Color with Alerts MT5
Pavel Zamoshnikov
4.71 (45)
Hull Moving Average (HMA) is well-deservedly popular among traders because of the effective averaging of market noise and a relatively small delay. The current MetaTrader 5 version changes its color when the movement direction changes. Sound and text signals are available. It also supports sending email and push messages. It is possible to trigger a signal on the current incomplete bar, although such a signal may be canceled before completion if conditions are no longer appropriate. One of the p
FREE
This indicator is an automated version of the Fibonacci retracement (Fib) indicator. Deciding the best areas to use when drawing the fib can be tricky and this  indicator was made with that in mind. When you drop it on the chart it will automatically choose the best points to draw the fib with, but in case you aren't satisfied with those regions, you can adjust it as you wish.
FREE
Expansoes M
Marcus Vinicius Da Silva Miranda
As Expansões M são variações da Proporção Áurea (Sequência de Fibonacci). É a primeira técnica de projeção, no mercado mundial, desenvolvida para ancoragem em Candle. Vantagens: Fácil Plotagem, pode ser ancorada em apenas um Candle; Alto grau de precisão como suportes / resistências; Excelente relação de Risco x Retorno; Funciona em qualquer tempo gráfico; Funciona em qualquer ativo.   As regiões das Expansões M são classificadas em: M0: Ponto 0 (candle inicial) LC: Linha de suporte ini
FREE
High Low Open Close
Alexandre Borela
5 (25)
Se você gosta deste projeto, deixe uma revisão de 5 estrelas. Seguir em instagram: borelatech Este indicador desenha os preços abertos, altos, baixos e finais para o especificado período e pode ser ajustado para um fuso horário específico. Estes são níveis importantes olhados por muitos institucional e profissional comerciantes e pode ser útil para você saber os lugares onde eles podem ser mais activa. Os períodos disponíveis são: Dia anterior. Semana anterior. Mês anterior. Quarto anterior
FREE
Cumulative Delta MT5
Evgeny Shevtsov
4.49 (49)
The indicator analyzes the volume scale and splits it into two components - seller volumes and buyer volumes, and also calculates the delta and cumulative delta. The indicator does not flicker or redraw, its calculation and plotting are performed fairly quickly, while using the data from the smaller (relative to the current) periods. The indicator operation modes can be switched using the Mode input variable: Buy - display only the buyer volumes. Sell - display only the seller volumes. BuySell -
FREE
Donchian Channel DC is the indicator of Donchian Channels, that plots maximum and minimum values of a specific period, besides mean value line. It´s possible to configure simple period for analysis and the indicator will plot all three values. You can trade with this indicator as trend or reversal, according to each strategy. Do not let to test others indicators as soon as others expert advisors.
30 USD
This is a free version of the indicator, the period between the vertical lines is always 30 bars. In the paid version the period can be set by user, so a configuration with many ThreePointsChannel indicators with different periods is possible. The principle of construction - on top of any number of bars set by the user, a channel is constructed with maximum and minimum lines so that the bars touch the maximum and minimum of the channel at exactly three points. The name of the indicator follows
FREE
Multi-timeframe trend indicator based on the ADX / ADXWilder indicator with Fibonacci levels The indicator shows trend areas using ADX or ADXWilder indicator data from multiple timeframes. The impulse mode of the indicator allows you to catch the beginning of a trend, and several "Screens" with different timeframes allow you to filter out market noise. Fibonacci levels are added to the price chart, which have flexible settings. How the indicator works: if PDI is greater than NDI, then   it`
FREE
O Canal Donchian Os canais são uma das ferramentas de análise técnica mais populares porque transmitem intuitivamente aos analistas as restrições que tendem a ocorrer na maioria das mudanças de preço. Os usuários do canal sabem que informações valiosas podem ser obtidas a qualquer momento, independentemente de o preço estar no centro de uma faixa ou próximo a uma das fronteiras. Uma das técnicas mais famosas para explorar esses conceitos são as bandas de Bollinger. No entanto, John Bollinger não
FREE
ContiStat restricted - Free DEMO version of the ContiStat indicator Free version of the indicator is ment as DEMO of full paid version. Full functionality is available, however The indicator work only on M30 chart period . Find the ContiStat indicator for full functionality Brief description The ContiStat indicator calculate statistic frequency of green (up) and red (down) movement in the chart and determine movement dynamics (silver curve). There are two key parameters to understand the Conti
FREE
Tabajara V5
Flavio Jarabeck
4.88 (33)
Metatrader 5 version of the famous Andre Machado's Tabajara indicator. If you don't know Andre Machado's Technical Analysis work you don't need this indicator... For those who need it and for those several friend traders who asked this porting from other platforms, here it is... FEATURES 8-period Moving Average 20-period Moving Average 50-period Moving Average 200-period Moving Average Colored candles according to the inflexion of the 20-period MA SETTINGS You can change the Period of all M
FREE
Os compradores deste produto também adquirem
ICT, SMC, SMART MONEY CONCEPTS, SMART MONEY, Smart Money Concept, Support and Resistance, Trend Analysis, Price Action, Market Structure, Order Blocks, BOS/CHoCH,   Breaker Blocks ,  Momentum Shift,   Supply&Demand Zone/Order Blocks , Strong Imbalance,   HH/LL/HL/LH,    Fair Value Gap, FVG,  Premium  &   Discount   Zones, Fibonacci Retracement, OTE, Buy Side Liquidity, Sell Side Liquidity, BSL/SSL Taken, Equal Highs & Lows, MTF Dashboard, Multiple Time Frame, BigBar, HTF OB, HTF Market Structur
65 USD
Este é um indicador para MT5 que fornece sinais precisos para entrar em uma negociação sem redesenhar. Ele pode ser aplicado a qualquer ativo financeiro: forex, criptomoedas, metais, ações, índices. Ele fornecerá estimativas bastante precisas e informará quando é melhor abrir e fechar um negócio. Assista o vídeo (6:22) com um exemplo de processamento de apenas um sinal que compensou o indicador! A maioria dos traders melhora seus resultados de negociação durante a primeira semana de negociação c
125 USD
Gold Stuff mt5
Vasiliy Strukov
4.97 (107)
Gold Stuff mt5-um indicador de tendência projetado especificamente para o ouro, também pode ser usado em qualquer instrumento financeiro. O indicador não é redesenhado ou atrasado. O timeframe recomendado é H1. Importante! Entre em contato comigo imediatamente após a compra para obter instruções e bônus! PARÂMETRO Draw Arrow-incl.desligado. desenhar setas no gráfico. Alertas-ligado.desligado.alertas sonoros. E-mail notification-incl.desligado. notificações por e-mail. Puch-notification-at
50 USD
Trend Screener Pro MT5
STE S.S.COMPANY
4.87 (38)
Indicador de tendência, solução única inovadora para negociação e filtragem de tendências com todos os recursos de tendências importantes construídos dentro de uma ferramenta! É um indicador multi-timeframe e multi-moedas 100% sem repintura que pode ser usado em todos os símbolos/instrumentos: forex, commodities, criptomoedas, índices e ações. O Trend Screener é um indicador eficiente que segue a tendência do indicador que fornece sinais de tendência de seta com pontos no gráfico. Os recursos qu
50 USD
AW Trend Predictor MT5
Alexander Nechaev
5 (34)
A combinação de níveis de tendência e quebra em um sistema. Um algoritmo de indicador avançado filtra o ruído do mercado, determina a tendência, os pontos de entrada e os possíveis níveis de saída. Os sinais indicadores são registrados em um módulo estatístico, que permite selecionar as ferramentas mais adequadas, mostrando a eficácia do histórico do sinal. O indicador calcula as marcas Take Profit e Stop Loss. Manual e instruções ->   AQUI   / versão MT4 ->   AQUI Como negociar com o indicador
55 USD
Advanced Supply Demand MT5
Bernhard Schweigert
4.42 (12)
Atualmente com 33% de desconto! A melhor solução para qualquer Trader Novato ou especialista! Este indicador é uma ferramenta de negociação exclusiva, de alta qualidade e acessível porque incorporamos uma série de recursos proprietários e uma nova fórmula. Com esta atualização, você poderá mostrar fusos horários duplos. Você não só será capaz de mostrar um TF mais alto, mas também mostrar ambos, o TF do gráfico, MAIS o TF mais alto: MOSTRANDO ZONAS ANINHADAS. Todos os traders de Oferta e Demanda
199 USD
Torne-se um Negociador Breaker e lucre com as mudanças na estrutura do mercado à medida que o preço reverte. O indicador de quebra de bloco de pedidos identifica quando uma tendência ou movimento de preço está chegando à exaustão e pronto para reverter. Ele o alerta sobre mudanças na estrutura do mercado, que normalmente ocorrem quando uma reversão ou uma grande retração está prestes a ocorrer. O indicador usa um cálculo proprietário que identifica rupturas e momento do preço. Toda vez que
49 USD
Matrix Arrow Indicator MT5
Juvenille Emperor Limited
5 (11)
O   Matrix Arrow Indicator MT5   é uma tendência única 10 em 1 seguindo um indicador multi-timeframe   100% sem repintura   que pode ser usado em todos os símbolos/instrumentos:   forex ,   commodities ,   criptomoedas ,   índices ,   ações .  O  Matrix Arrow Indicator MT5  determinará a tendência atual em seus estágios iniciais, reunindo informações e dados de até 10 indicadores padrão, que são: Índice de movimento direcional médio (ADX) Índice de canal de commodities (CCI) Velas clássicas de
75 USD
Market Structure Patterns
Samuel Manoel De Souza
5 (7)
Market Structure Patterns is an indicator based on smart money concepts that displays structures and zones on the chart, can send alerts of any type, have his values accessed through global variables what makes easy create Expert Advisors based on it. This is the only one of this type in the market that allows the control of the transparency of the zones on the chart. The indicator also paints the   candlesticks   depending on the trend. This feature can be enabled in the parameter "Color Candle
30 USD
Blahtech Supply Demand MT5
Blahtech Limited
4.45 (11)
Supply Demand uses previous price action to identify potential imbalances between buyers and sellers. The key is to identify the better odds zones, not just the untouched ones. Blahtech Supply Demand indicator delivers functionality previously unavailable on any trading platform. This 4-in-1 indicator not only highlights the higher probability zones using a multi-criteria strength engine, but also combines it with multi-timeframe trend analysis, previously confirmed swings and engulfing detecto
99 USD
TPA True Price Action indicator reveals the true price action of the market makers through 100% non-repainting signals strictly at the close of a candle! TPA shows entries and re-entries, every time the bulls are definitely stronger than the bears and vice versa. Not to confuse with red/green candles. The shift of power gets confirmed at the earliest stage and is ONE exit strategy of several. There are available now two free parts of the TPA User Guide for our customers. The first "The Basics"
168 USD
Blahtech VWAP - Volume Weighted Average Price (VWAP) is the ratio of price to total volume. It provides an average price over a specified time interval.  Links [  Install  |  Update  |  Documentation   ] Feature Highlights Configurable VWAP Line Sessions, intervals, anchored or continuous Previous day settlement line Standard Deviation bands Alerts at bar close or real time Automatic Broker or Tick volumes Significantly reduced CPU usage Input Parameters Max Bars   - Restrict the number of
49 USD
Strong Support mt5
Vasiliy Strukov
5 (6)
Os níveis de suporte e resistência têm sido uma ferramenta poderosa para a análise de mercado. Strong Support O indicador constrói os níveis de suporte de acordo com os mínimos de preço locais e os níveis de resistência de acordo com os máximos de preço locais. Meus outros desenvolvimentos podem ser vistos aqui Recomenda - se o uso em conjunto com um indicador de tendência, por exemplo, Gold Stuff -isso permitirá Negociar de acordo com a tendência e, ao mesmo tempo, determinar as zonas de c
50 USD
Market Profile defines a number of day types that can help the trader to determine market behaviour. A key feature is the Value Area, representing the range of price action where 70% of trading took place. Understanding the Value Area can give traders valuable insight into market direction and establish the higher odds trade. It is an excellent addition to any system you may be using. Blahtech Limited presents their Market Profile indicator for the MetaTrader community. Inspired by Jim Dalton’s
99 USD
Owl Smart Levels MT5
Sergey Ermolov
5 (7)
Guia do Indicador   |  Estratégia  Owl Smart Levels  |   Versão MT4  |  Como instalar?   |   FAQ O Indicador Owl Smart Levels é um sistema de negociação completo dentro de um indicador que inclui ferramentas populares de análise de mercado, como fractais avançados de Bill Williams , Valable ZigZag que constrói a estrutura de onda correta do mercado e níveis de Fibonacci que marcam os níveis exatos de entrada no mercado e lugares para obter lucros. Para uma descrição detalhada do sistema de nego
97 USD
Italo Volume Indicator MT5
Italo Santana Gomes
4.69 (13)
BUY INDICATOR AND GET EA FOR FREE AS A BONUS + SOME OTHER GIFTS! ITALO VOLUME INDICATOR  is the best volume indicator ever created, and why is that? The Indicator works on all time-frames and assets, indicator built after 6 years of experience on forex and many other markets. You know many volume indicators around the internet are not complete, does not help, and it's difficult to trade, but the Italo Volume Indicator is different , the Italo Volume Indicator shows the wave volume, when market
65 USD
ACB Breakout Arrows MT5
KEENBASE SOFTWARE SOLUTIONS
5 (1)
The ACB Breakout Arrows indicator provides a crucial entry signal in the market by detecting a special breakout pattern. The indicator constantly scans the chart for a settling momentum in one direction and provide the accurate entry signal right before the major move. Get multi-symbol and multi-timeframe scanner from here - Scanner for ACB Breakout Arrows MT 5 Key features Stoploss   and Take Profit levels are provided by the indicator. Comes with a MTF Scanner dashboard which tracks the br
145 USD
Desenhe automaticamente os níveis de apoio e resistência MAIS espaços de velas de propulsão no seu gráfico, para que possa ver para onde é provável que o preço se dirija a seguir e/ou potencialmente inverta. Este indicador foi concebido para ser utilizado como parte da metodologia de negociação de posições ensinada no meu website (The Market Structure Trader) e exibe informação chave para a segmentação e potenciais entradas. MT4 Version:  https://www.mql5.com/en/market/product/97246/ Existem
49 USD
Auto Order Block with break of structure Detect Break of Structure , Mark Order Block and draw Entry / Stop and Risk to Reward lines when Order block is touch by price with Alert. Trend is Manually set to filter signals in a direction by a button on the chart. Entry / Stop and Risk to Reward lines can also be switch on / off by button on chart. Futures Auto Mark Break of Structure Auto Mark Order block Auto Mark higher time frame Point Of  Interest ( POI ) Popup Alert when BoS , Order block
55 USD
FX Volume MT5
Daniel Stein
4.77 (13)
Seguir o dinheiro inteligente é finalmente possível! O Volume FX é o PRIMEIRO e ÚNICO indicador de volume que fornece uma percepção REAL do sentimento do mercado do ponto de vista de um corretor. Fornece uma visão incrível de como os participantes do mercado institucional, tal como os corretores, se posicionam no mercado Forex, muito mais rapidamente do que os relatórios COT. Ver esta informação directamente no seu gráfico é a verdadeira solução de mudança de jogo e de avanço para a sua ne
33 USD
Trend Line Map Pro MT5
STE S.S.COMPANY
4.8 (5)
O indicador Trend Line Map é um complemento do Trend Screener Indicator. Ele funciona como um scanner para todos os sinais gerados pelo Trend screener (Trend Line Signals). É um Trend Line Scanner baseado no Trend Screener Indicator. Se você não tiver o Trend Screener Pro Indicator, o Trend Line Map Pro não funcionará. It's a Trend Line Scanner based on Trend Screener Indicator. If you don't have Trend Screener Pro Indicator,     the Trend Line Map Pro will not work . Acessando nosso Blog
50 USD
Legacy of Gann for MT5
Pavel Zamoshnikov
5 (2)
The indicator very accurately determines the levels of the possible end of the trend and profit fixing. The method of determining levels is based on the ideas of W.D.Gann, using an algorithm developed by his follower Kirill Borovsky. Extremely high reliability of reaching levels (according to K. Borovsky  - 80-90%) Indispensable for any trading strategy – every trader needs to determine the exit point from the market! Precisely determines targets on any timeframes and any instruments (forex, met
65 USD
Introduction to EFW Analytics EFW Analytics was designed to accomplish the statement "We trade because there are regularities in the financial market". EFW Analytics is a set of tools designed to maximize your trading performance by capturing the repeating fractal geometry, known as the fifth regularity in the financial market. The functionality of EFW Analytics consists of three parts. Firstly, Equilibrium Fractal Wave Index is an exploratory tool to support your trading logic to choose which r
200 USD
O Indicador de Reversão ADR mostra rapidamente onde o preço está sendo negociado atualmente em relação ao seu intervalo médio diário normal. Você receberá alertas instantâneos via pop-up, e-mail ou push quando o preço exceder seu intervalo médio e níveis acima dele de sua escolha, para que você possa saltar rapidamente para retrocessos e reversões. O indicador desenha linhas horizontais no gráfico nos extremos médios do intervalo diário e também extensões acima daqueles níveis que têm probabili
49 USD
Market Structure MT5
Reza Aghajanpour
5 (2)
**   All Symbols   x   All Timeframes   scan just by pressing scanner button ** *** Contact me immediately after the purchase to send you instructions and add you in "Market Structure group" for sharing or seeing experiences with other users. CURRENT PRICE $39..... Future Price $200 Introduction: Market structure is important for both new and professional traders since it can influence the liquidity and price action of a market. It’s also one of the most commonly used techniques to understand tr
39 USD
FX Power MT5
Daniel Stein
4.3 (23)
Quer tornar-se um comerciante forex de 5 estrelas constantemente lucrativo? 1.   Leia a descrição básica do nosso   sistema de   negociação simples e   a sua grande actualização estratégica em 2020 2.   Envie um screenshot da sua compra para obter o seu convite pessoal para o nosso chat comercial exclusivo FX Power   é o primeiro medidor de força da moeda com uma história completa em todos os períodos de tempo. Analisa o impulso e a força de todas as principais moedas para determinar transa
66 USD
Black Dragon indicator mt5
Ramil Minniakhmetov
4.8 (45)
O indicador de detecção de tendências complementará qualquer estratégia e também pode ser usado como uma ferramenta independente. Vantagens Fácil de usar, não sobrecarrega o gráfico com informações desnecessárias; Pode ser usado como filtro para qualquer estratégia; Possui níveis integrados de suporte e resistência dinâmicos, que podem ser usados ​​tanto para fins de lucro quanto para definir stop-loss; O indicador não muda de cor após o fechamento do castiçal;  Trabalha no mercado de ações
30 USD
Swing Scanner MT5
Reza Aghajanpour
5 (2)
**   All Symbols   x   All Timeframes   scan just by pressing scanner button ** ***Contact me after the purchase to send you instructions and add you in "Swing scanner group" for sharing or seeing experiences with other users. CURRENT PRICE $49..... Future Price $200 Introduction: Swing Scanner   is the indicator designed to detect swings in the direction of the trend and possible reversal swings. The indicator studies several price and time vectors to track the aggregate trend direction and de
49 USD
Trend Chief mt5
Vladimir Stepanov
O Trend Chief é um algoritmo de indicador avançado que filtra o ruído do mercado, determina a tendência, os pontos de entrada e os possíveis níveis de saída. Use prazos mais curtos para scalping e prazos mais altos para swing trading. Trend Chief é perfeito para todos os símbolos Metatrader: moedas, metais, moedas criptográficas, ações e índices * Como usar o indicador Trend Chief: - Obtenha a tendência principal observando os gráficos diários e H4 - Se a tendência for de alta, vá para interva
45 USD
XQ Indicator MT5
Marzena Maria Szmit
5 (1)
The signal conditions are a combination of three indicators, and XQ Forex Indicators only display  medium and long-term trends . The indicator's efficacy has been improved with the addition of a filter that blocks out false signals. The XQ Forex Indicator can be used on  FX pairs, CFDs, and Cryptocurrencies . There are two type of signals:  Buy or Sell and Big Long or Big Short It is possible to enable sending emails when a major trend-change signal is detected, as well as to display the alerts
179 USD
Mais do autor
Swiss VWAPsimple
Terence Gronowski
5 (3)
Swiss VWAPsimple Motivation Did not find free VWAP that works, the one that I found craseh. So I created a VWAP which calculates values only for the actual day. So computer resouces are not over stressed. What is VWAP, how is it used?  VWAP stands for Volume Weighed Average Price, it calculates the running sum of tick volume and the runnung sum of price times tickvolume. The division of these sums result in a weighed price (Sum P*V/Sum V). The calculation starts normally at midnight. The value
FREE
Swiss InsideOutsideBar
Terence Gronowski
5 (2)
Swiss InsideOutsideBar Imortance of Inside- and Outside Bars Inside bars are completely engulfed by its previous bar. The pattern is also known as "harami" (pregnant). Outsidebars engulf the previous bar. Inside bars might mark situations before an outbreak. They are a condensed form of a symmetrical triangle. Symmetrical triangles represent a battle between bulls and bears. There can be an outbreak to either side, mostly the outbreak is in direction of the main trend. The combination of inside
FREE
M5 Breakout Indicator
Terence Gronowski
3 (1)
Shows min and max of last M5 Candle. Can be used to trade breakouts of last M5 candle.  The M5 Candle Breakout Strategy avoids to stay too long in a sindways phase. See documentation on  @swisstrader3713, where you can follow my live trading. The only parameters are the color of the lines defining the M5 stretch. Best use the indicator in M1 timeframe. The M5 Breakout Strategy has helped me to reduce overtrading.
FREE
Normal Parabolic SAR with label of long or short state. Tells also "Parabolic long" and "short". Can be used in multitimeframe layouts together with Swiss HolyGrail indicator or in different timeframes. So, if all the indicators show "long" or "short" you can be sure that the risk of a wrong direction is small. The standard values for Parabolic SAR are 0.02 for step and 0.2 for maximum. You may experiment with changing the maximum to get smother curves.  Note that changes in parabolic SAR are la
FREE
Swiss CandleTime
Terence Gronowski
5 (2)
Swiss CandleTime What ist CandleTime for This indicaor just displays the remaining time for a candle to build. It is best used if you trade with timframes from 3 minutes. I use it in M3 to keep postions. If I have two following red candles i usually liquidate the position. Timeframes M1 to H1 Inputs Arrow displayed => Edit your arrow string Arrow for waiting conditions => Arrow if chart is offline Text Color => color of the text Tell if there is a trend change => tells you, if the two preciding
FREE
Swiss HolyGrail
Terence Gronowski
Swiss Holy Grail Indicator Motivation and functioning The HolyGrail indicator serves to optimize an entry. At that very moment I caught myself, that I went short in an uptrend, so I got into a trade in an anti-cyclical way. Or I have entered into a much too mature trend. This indicator should prevent such errors: One should always be aware of whether it is pro- or anticyclic entry, and one must always know about the maturity of the trend. Don't enter an old trend. Linda Raschke advises to buy th
FREE
FasterShark
Terence Gronowski
5 (1)
Idea I programmed this tool out of the necessity to be constantly informed about what is going on. Before I sometimes forgot to set a stopp loss, this is impossible with this tool. Further this tool allows you to make distributed entries, eg. with a first feeler with 0.1 contracts and when the direction is the right one you just put more contacts into the game. Money- and risk management is built in. If you use more then the predetermined number of contracts there is a warning. You are constantl
FREE
Opening Range Indicator   Idea Toby Crabel introduced this way of trading in the ealy ninties in his book "Day Trading with Short Term Price Patterns and Opening Range Breakout". In simple terms this means to trade the brekouts from the limits of the first trading hour with the stop loss at the opposite side. I.e. if the first hourly candle meausres 40 points (Crabel calls this the "stretch") you set the stop loss at breakout level minus 40 points and the take profit at the breakout level plus
FREE
RSI talking, use all your senses while trading! The idea When trading your eyes might be very stressed. Therefore I programmed the RSItalking. Trade what you see and what you hear ! Function This indicator says "rsioverbought" when rsi is over a threshold value (default 75%) and "rsioversold" if it is under a lower threshold (default 25%). When you keep a long position be adviced to realize profit when the indicator tells you "rsioverbought" and vice versa. You will find an explanation of th
FREE
Filtro:
diamondfx360
29
diamondfx360 2023.01.10 11:24 
 

Thanks for coding this been looking for such .

drzocker
105
drzocker 2023.01.08 09:30 
 

Gute arbeit

Gyorgy Nesztor Szanto
34
Gyorgy Nesztor Szanto 2022.11.04 19:46 
 

Excelente aporte, muchas gracias. Sólo comentar que, con la actualización No. 3484 del 3 de noviembre de 2022 de MT5 todas las leyendas "R3, R2, Hi H1, etc., al cambiar de tamaño el cuadro del chart (reducir su tamaño o aumentar) se desconfigura y no queda debajo de sus lineas correspondientes. Las lineas en sí estan bien, es sólo el texto que los acompaña. ¡Saludos!

vvm-55
69
vvm-55 2022.10.17 11:02 
 

Ich bin zufrieden

roket52
14
roket52 2022.09.22 04:50 
 

Thank you much appreciated for this indicator as it provides these key levels. my only suggestion for improvement would be the ability to customise the line types and size and the ability to move the text positions too. Thanks for your work

HOGJoerch63
224
HOGJoerch63 2022.09.03 10:31 
 

Sehr nützlich und präzise. Dankende Grüße in die Schweiz

Kflynn
34
Kflynn 2022.05.28 14:15 
 

Excellent indicator.

Lully
118
Lully 2022.02.06 01:52 
 

Great ind. we need it for weekly and monthly if possible

gr8aarkays
26
gr8aarkays 2021.12.11 08:06 
 

Amazing lines, working perfect

Evgeny Belyaev
312143
Evgeny Belyaev 2021.09.24 17:30 
 

Good indicator

PrincipeRk
34
PrincipeRk 2021.09.12 00:38 
 

Buen complemento de indicadores

Souq
25
Souq 2021.07.13 15:43 
 

Amazing! Congratulations! 👍👍

Michael Schneider
865
Michael Schneider 2021.07.07 22:28 
 

I like it. Makes trading much simpler

Rogerio1985
377
Rogerio1985 2021.05.25 03:03 
 

Muito bom mesmo!!!

CEMKIVIRCIK
14
CEMKIVIRCIK 2021.05.21 19:28 
 

Hi, Do you have the same indi for MT4 platform? thx

ndiru2
64
ndiru2 2021.04.24 12:48 
 

Very helpful indicator

vasanton
108
vasanton 2021.03.17 15:06 
 

интересный индикатор.

Clesio Hector Dufau Da Conceicao
221
Clesio Hector Dufau Da Conceicao 2021.01.25 14:33 
 

Great job. One just set to add: line width (1, 2, 3...)

Michael Dias
145
Michael Dias 2020.12.26 05:01 
 

Indicador muito bom, parabéns, grato por disponibilizar gratuitamente.

Not4putter
44
Not4putter 2020.11.10 10:18 
 

Super

12
Responder ao comentário
Versão 1.20 2019.02.15
One per bar introcuced. There was a flicker on some pcs.
Versão 1.10 2019.01.27
Correction of error: Lines were not deleted when indicator was removed. Now they are gone when the indicator is removed from chart (if they are still there just change the timeframe up and down).