• Übersicht
  • Bewertungen (30)
  • Diskussion (19)
  • Neue Funktionen

Important Lines

4.88

Important Lines Indikator (M1 - M15)


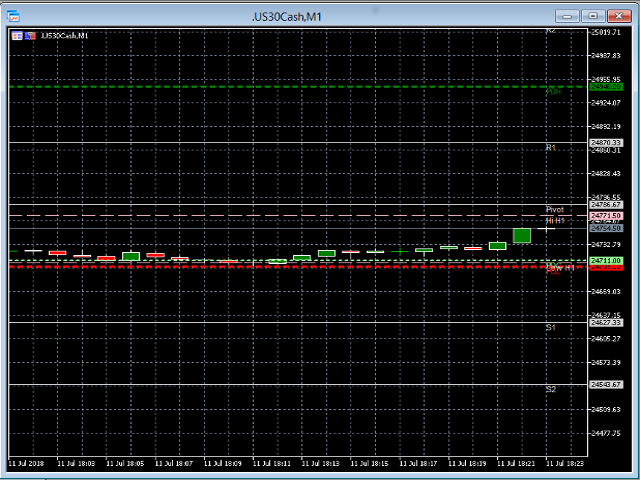
Dieser Indikator zeigt Pivot-Lines, vortages Hoch und Tief, vortages Close und das Minimum und Maximum der vorherigen Stunde an. Sie müssen nur diesen einzelnen Indikator in das Diagramm ziehen, um alle diese wichtigen Linien zu haben. Sie können sich das Laden vieler einzelnen Indikatoren ersparen.


Warum sind bestimmte Linien beim Traden so wichtig?

Vortageshoch und -tief: Diese werden von Händlern beobachtet, die in einer Tages-Chart handeln. Sehr oft, wenn der Preis über oder unter einem Vortagestief/Vortagesoch steigt oder fällt, gibt es eine Beschleunigung beim überschreiten der Grenze. Es handelt sich um einen Ausbruch aus der Range des letzten Tages.

Vorstundenhoch und -tief: Werden von Breakout-Händlern beobachtet, die in der Stunden-Chart handeln. Die Opening-Breakout-Strategie  (siehe Toby Crabel) verwendet die  Bandbreite der vergangenen Stundenkerze. Auch kann das Platzieren des Stopp Loss in der Nähe der Stundenlinien sehr effektiv sein.

Pivot Points: Pivots stammen von den ehemaligen Parketthändlern, die eine schnelle und grobe Orientierung der Preissituation benötigten. Heute betrachten noch viele Händler diese Punkte. Beim Handel machen sich Pivotpunkt oder die Supports (s1, s2, s3)

oder Widerstände (r1, r2, r3) folgendermassen bemerkbar:  Preis kann sich an einer solchen Stelle verlangsamen aber auch drehen.

Berechnungsmethoden

Pivots:

Pivot Point = (hoch + close + tief) / 3 (Vortag)

 r1 = (2 * Pivot) - tief

  s1 = (2 * Pivot) - hoch

  r2 = Pivot + (r1 - s1)

  r3 = hoch + (2 * (Pivot - tief))

  s2 = Pivot - (r1 - s1)

  s3 = tief - (2 * (hoch - Pivot));


Alle anderen Zeilen stammen aus der History-Funktionen von Metatrader 5. Weil historische Stundenwerte verwendet werden, kann der Indikator nur mit Zeiteinheiten < H1 betrieben werden.


Anpassung

Die Farben der Linien und Beschriftungen können angepasst werden.
  • pivotColor 
  • s1Color
  • s2Color 
  • s3Color
  • r1Color
  • r2Color
  •  r3Color 
  •  lowH1Color
  •  hiH1Color
  • PDHColor
  •  PDLColor
  •  PDCColor 


Warum habe ich diesen Indikator programmiert?

Als ich vor etwa einem Jahr mit MT5 angefangen habe, habe ich keinen passenden Indikator gefunden. Wie ich es jeden Tag benutze, könnte es auch für andere Händler von Nutzen sein.

Dieser Indikator wird in Verbindung mit meinem Opening Range Breakout Roboter verwendet, den ich in Kürze veröffentlichen werde. Ich habe vor, diese Anzeige "sprechen" zu lassen. So wird es möglich sein "zu handeln, was man sieht und hört".

Ich möchte jedem Mt4 Trader nahe legen, auf MT5 zu wechseln. MT5 hat nicht nur mehr Features, er ist mehrfach so schnell wie MT4 (MT4 ist 32 Bit, MT5 64 Bit).


Probleme und Disclaimer

An Montagen kann die Anzeige der Vortage (Vortageshoch, -tief, -schluss) fehlerhaft sein, weil allenfalls Werte des Samstags anstatt des Freitags verwendet werden.

Ich benutze diesen Indikator schon ein halbes Jahr lang, es sind nie wesentliche Fehler aufgetreten.

Ich übernehme keinerlei Haftung für Fehlfunktonen.


12.7.2018, Terence V. Gronowski "SwissTrader", http://geo.ch/trading

Bewertungen 20
drzocker
90
drzocker 2023.01.08 09:30 
 

Gute arbeit

vvm-55
69
vvm-55 2022.10.17 11:02 
 

Ich bin zufrieden

roket52
14
roket52 2022.09.22 04:50 
 

Thank you much appreciated for this indicator as it provides these key levels. my only suggestion for improvement would be the ability to customise the line types and size and the ability to move the text positions too. Thanks for your work

Empfohlene Produkte
Donchian Channel is an indicator created by Richard Donchian. It is formed by taking the highest high and the lowest low of the last specified period in candles. The area between high and low is the channel for the chosen period. Its configuration is simple. It is possible to have the average between the upper and lower lines, plus you have alerts when price hits one side. If you have any questions or find any bugs, please contact me. Enjoy! This is a free indicator, but it took hours to develo
FREE
Follow The Line MT5
Oliver Gideon Amofa Appiah
4.23 (22)
This indicator obeys the popular maxim that: "THE TREND IS YOUR FRIEND" It paints a GREEN line for BUY and also paints a RED line for SELL. (you can change the colors). It gives alarms and alerts of all kinds. IT DOES NOT REPAINT and can be used for all currency pairs and timeframes. Yes, as easy and simple as that. Even a newbie can use it to make great and reliable trades. NB: For best results, get my other premium indicators for more powerful and reliable signals. Get them here: https://www.m
FREE
Free automatic Fibonacci is an indicator that automatically plots a Fibonacci retracement based on the number of bars you select on the BarsToScan setting in the indicator. The Fibonacci is automatically updated in real time as new highest and lowest values appears amongst the selected bars. You can select which level values to be displayed in the indicator settings. You can also select the color of the levels thus enabling the trader to be able to attach the indicator several times with differe
FREE
Are you tired of drawing trendlines every time you're analyzing charts? Or perhaps you would like more consistency in your technical analysis. Then this is for you. This indicator will draw trend lines automatically when dropped on a chart. How it works Works similar to standard deviation channel found on mt4 and mt5. It has 2 parameters: 1. Starting Bar 2. Number of bars for calculation The   starting bar   is the bar which drawing of the trend lines will begin, while the   number of bars for c
FREE
You can download the Full version with more features here . Introduction Harmonic Patterns are best used to predict turning point. Harmonic Patterns give you high win rate and high opportunities for trade in during one day. This indicator detects the best and successful patterns base on Harmonic Trading books by Mr. Scott M.. Main Features Detect the best and   most successful patterns : Gartley, Bat, Crab, Butterfly, Cypher, Shark, Alt_Bat, Deep_Crab Easy-to-use and user friendly indicator Sca
FREE
This indicator is especially for the binary trading. Time frame is 1 minutes and exp time 5 or 3 minutes only. You must be use martingale 3 step. So you must put lots size is 10 % at most. You should use Mt2 trading platform to connect with my indicator to get more signal without human working. This indicator wining rate is over 80% but you may get 100% of profit by using martingale 3 step. You should use MT2 Trading Platform to connect meta trader platform and binary platform . You can get mt2
FREE
PZ Penta O MT5
PZ TRADING SLU
3.8 (5)
The Penta-O is a 6-point retracement harmonacci pattern which usually precedes big market movements. Penta-O patterns can expand and repaint quite a bit. To make things easier this indicator implements a twist: it waits for a donchian breakout in the right direction before signaling the trade. The end result is an otherwise repainting indicator with a very reliable trading signal. The donchian breakout period is entered as an input. [ Installation Guide | Update Guide | Troubleshooting | FAQ | A
FREE
Accurate
Aleksandr Kostusev
5 (1)
The indicator automatically builds patterns of the following types - "Bullish Flag", "Bearish Flag", "Bullish Pennant", "Bearish Pennant", "Bullish Falling Wedge", "Bearish Rising Wedge". The indicator also signals a possible entry point with arrows. The indicator is multi-currency, you can trade everything from cryptocurrencies to indices. The higher the timeframe of the instrument on which the indicator stands, the more accurate the entry point and the price movement will be much longer!  
FREE
The indicator identifies when a divergence occurs between price and an indicator or oscillator. It identifies both regular and hidden divergences. Combined with your own rules and techniques, this indicator will allow you to create (or enhance) your own powerful system. Features Can detect divergences for the following oscillators/indicators:   MACD, OsMA, Stochastics, RSI, CCI, RVI, Awesome, ADX, ATR, OBV, Composite index, MFI and Momentum. Only one oscillator/indicator can be selected. Draws
FREE
This indicator is the MACD (Moving Average Convergence/Divergence) supporting Virtual Trading mode of Knots Comparer . When the mode is turned on, the indicator will be recalculated based on the displayed candlesticks. When the mode is turned off, the indicator will be recalculated based on the original chart candlesticks. Types of the applied price: Close Open High Low Median Price (HL/2) Typical Price (HLC/3) Weighted Price (HLCC/4) KC-Indicators: KC-MA (Moving Average) KC-ENV (Envelopes) KC
FREE
Rainbow MT5
Jamal El Alama
4.33 (3)
Description : Rainbow MT5 is technical indicator based on Moving Average with period 34 and very easy to use. When price crosses above MA and MA changes color to green, then this is a signal to buy. When price crosses below MA and MA changes color to red, then this is a signal to sell. The Expert advisor ( Rainbow EA MT5 ) based on Rainbow MT5 indicator is now available here . MT4 version is available  here .
FREE
Automatic Trendlines
Pasi Hakamaki
4.63 (41)
Der Indikator zeichnet Trendlinien im Diagramm. Dieser Indikator hat sechs Eingänge. Der Benutzer kann alternative Beschriftungen für beide Zeilen angeben. Wenn mehrere Instanzen des Indikators verwendet werden, müssen sich die Beschriftungen unterscheiden. Der Benutzer kann die Breite und Farbe der Linien und die Tiefe festlegen, um festzulegen, welche signifikanten Peaks verwendet werden sollen. Zum Beispiel setzt Depth = 10 Trendlinien unter Verwendung der aktuellen Spitzen und Täler, die rec
FREE
Pivot Point Fibo RSJ ist ein Indikator, der die Unterstützungs- und Widerstandslinien des Tages mithilfe von Fibonacci-Kursen verfolgt. Dieser spektakuläre Indikator erzeugt bis zu 7 Unterstützungs- und Widerstandsebenen durch Pivot Point unter Verwendung von Fibonacci-Kursen. Es ist fantastisch, wie die Preise jedes Niveau dieser Unterstützung und dieses Widerstands respektieren, wo es möglich ist, mögliche Einstiegs- / Ausstiegspunkte einer Operation zu erkennen. Merkmale Bis zu 7 Unter
FREE
Dual RSI
Paul Conrad Carlson
Indicator alerts for Dual Relative strength index rsi. Large rsi preset at 14 is below 30 small rsi preset at 4 is below 10 for buy bullish signals . Large rsi preset are 14 is above 70 small rsi preset at 4 is above 90 for sell bearish signals . Includes mobile and terminal alerts. draws lines when alerts. This indicator can help identify extremes and then the tops or bottoms of those extremes .
FREE
Ichimoku Style MT5
Javier Morales Fernandez
What is Ichimoku? The Ichimoku is a technical indicator collection that shows support and resistance levels and momentum and trend direction. It does this by taking multiple averages and plotting them on a chart. It also uses these figures to compute a “cloud” that attempts to forecast where the price may find support or resistance in the future. The Ichimoku is composed of five lines or calculations, two of which comprise a cloud where the difference between the two lines is shaded in. The lin
FREE
The indicator detects and displays М. Gartley's Butterfly pattern. The pattern is plotted by the extreme values of the ZigZag indicator (included in the resources, no need to install). After detecting the pattern, the indicator notifies of that by the pop-up window, a mobile notification and an email. The pattern and wave parameters are displayed on the screenshots. The default parameters are used for demonstration purposes only in order to increase the amount of detected patterns. Parameters
30 USD
Indicator and Expert Adviser  EA Available in the comments section of this product. Download with Indicator must have indicator installed for EA to work. Mt5 indicator alerts for bollinger band and envelope extremes occurring at the same time. Buy signal alerts occur when A bullish candle has formed below both the lower bollinger band and the lower envelope  Bar must open and close below both these indicators. Sell signal occur when A bear bar is formed above the upper bollinger band and upp
FREE
Reversal Composite Candles
MetaQuotes Ltd.
3.4 (20)
The idea of the system is to indentify the reversal patterns using the calculation of the composite candle. The reversal patterns is similar to the "Hammer" and "Hanging Man" patterns in Japanese candlestick analysis. But it uses the composite candle instead the single candle and doesn't need the small body of the composite candle to confirm the reversal. Input parameters: Range - maximal number of bars, used in the calculation of the composite candle. Minimum - minimal size of the composite can
FREE
PZ Pivot Points MT5
PZ TRADING SLU
4.95 (21)
This indicator displays pivot points in the chart, including historical vales, and supports many calculation modes for Pivot Points and S/R levels. [ Installation Guide | Update Guide | Troubleshooting | FAQ | All Products ] It plots historical levels for backtesting purposes It allows you to select the reference timeframe It implements different Pivot Point calculation modes It implements different SR calculation modes It implements customizable colors and sizes Calculation Modes The indi
FREE
This is a buyer and seller aggression indicator that analyzes the shape of each candle and project this data in a histogram form. There are 4 histograms in one. On the front we have two: Upper - Buyer force. Lower - Seller force. At the background we also have two histogram, both with same color. They measure the combined strenght of buyers and sellers. This histograms can be turned off in Input Parameters. It is also possible to have the real or tick volume to help on this force measurement. IN
FREE
HMA Color with Alerts MT5
Pavel Zamoshnikov
4.69 (42)
Hull Moving Average (HMA) is well-deservedly popular among traders because of the effective averaging of market noise and a relatively small delay. The current MetaTrader 5 version changes its color when the movement direction changes. Sound and text signals are available. It also supports sending email and push messages. It is possible to trigger a signal on the current incomplete bar, although such a signal may be canceled before completion if conditions are no longer appropriate. One of the p
FREE
This indicator is an automated version of the Fibonacci retracement (Fib) indicator. Deciding the best areas to use when drawing the fib can be tricky and this  indicator was made with that in mind. When you drop it on the chart it will automatically choose the best points to draw the fib with, but in case you aren't satisfied with those regions, you can adjust it as you wish.
FREE
Expansoes M
Marcus Vinicius Da Silva Miranda
The M Extensions are variations of the Golden Ratio (Fibonacci Sequence). It is the World's first technique developed for Candle Projections. Advantages: Easy to plot. Candle anchoring; High and accurate precision as support and resistance; Excellent Risk x Return ratio; Works in any timeframe; Works in any asset / market.   The M Extensions are classified into: M0: Zero point (starting candle) RC: Initial candle control region M1: Extension region 1 M2: Extension region 2 M3: Extension r
FREE
High Low Open Close
Alexandre Borela
5 (23)
Wenn Sie dieses Projekt mögen, hinterlassen Sie eine 5-Sterne-Bewertung. Folgen Sie instagram: borelatech Dieser Indikator zieht die offenen, hohen, niedrigen und schließenden Preise für die angegebenen und kann für eine bestimmte Zeitzone eingestellt werden. Dies sind wichtige Ebenen, die von vielen institutionellen und professionellen Händler und kann nützlich sein, um die Orte, wo sie vielleicht mehr aktiv. Die verfügbaren Zeiträume sind: Vorheriger Tag. Vorherige Woche. Vorheriger Monat
FREE
Cumulative Delta MT5
Evgeny Shevtsov
4.48 (46)
The indicator analyzes the volume scale and splits it into two components - seller volumes and buyer volumes, and also calculates the delta and cumulative delta. The indicator does not flicker or redraw, its calculation and plotting are performed fairly quickly, while using the data from the smaller (relative to the current) periods. The indicator operation modes can be switched using the Mode input variable: Buy - display only the buyer volumes. Sell - display only the seller volumes. BuySell -
FREE
Donchian Channel DC is the indicator of Donchian Channels, that plots maximum and minimum values of a specific period, besides mean value line. It´s possible to configure simple period for analysis and the indicator will plot all three values. You can trade with this indicator as trend or reversal, according to each strategy. Do not let to test others indicators as soon as others expert advisors.
30 USD
This is a free version of the indicator, the period between the vertical lines is always 30 bars. In the paid version the period can be set by user, so a configuration with many ThreePointsChannel indicators with different periods is possible. The principle of construction - on top of any number of bars set by the user, a channel is constructed with maximum and minimum lines so that the bars touch the maximum and minimum of the channel at exactly three points. The name of the indicator follows
FREE
The Donchian Channel Channels are among the most popular tools of technical analysis, as they visually convey to the analyst the limits within which most price movement tends to occur. Channel users know that valuable information can be obtained at any time, whether prices are in the central region of a band or close to one of the border lines. One of the best known techniques to explore these concepts is Bollinger Bands. However, John Bollinger was not the only one to research the applicatio
FREE
ContiStat restricted - Free DEMO version of the ContiStat indicator Free version of the indicator is ment as DEMO of full paid version. Full functionality is available, however The indicator work only on M30 chart period . Find the ContiStat indicator for full functionality Brief description The ContiStat indicator calculate statistic frequency of green (up) and red (down) movement in the chart and determine movement dynamics (silver curve). There are two key parameters to understand the Conti
FREE
Tabajara V5
Flavio Jarabeck
4.88 (33)
Metatrader 5 version of the famous Andre Machado's Tabajara indicator. If you don't know Andre Machado's Technical Analysis work you don't need this indicator... For those who need it and for those several friend traders who asked this porting from other platforms, here it is... FEATURES 8-period Moving Average 20-period Moving Average 50-period Moving Average 200-period Moving Average Colored candles according to the inflexion of the 20-period MA SETTINGS You can change the Period of all M
FREE
Käufer dieses Produkts erwarben auch
Dies ist ein Indikator für MT5, der genaue Signale für den Einstieg in einen Handel ohne Repainting (Neuzeichnen) liefert. Er kann auf alle Finanzwerte angewendet werden: Forex, Kryptowährungen, Metalle, Aktien, Indizes. Er liefert ziemlich genaue Schätzungen und sagt Ihnen, wann es am besten ist, eine Position zu eröffnen und zu schließen. Sehen Sie sich das Video (6:22) mit einem Beispiel für die Verarbeitung nur eines Signals an, das sich für den Indikator gelohnt hat! Die meisten Händler ver
125 USD
Gold Stuff mt5
Vasiliy Strukov
4.97 (94)
Gold Stuff mt5-Ein Trendindikator, der speziell für Gold entwickelt wurde, kann auch auf allen Finanzinstrumenten verwendet werden. Der Indikator wird nicht neu gezeichnet und verzögert sich nicht. Empfohlener Zeitrahmen H1. WICHTIG! Kontaktieren Sie mich sofort nach dem Kauf, um Anweisungen und Bonus zu erhalten! DATEN Draw Arrow - inkl.aus. zeichnen von Pfeilen in einem Diagramm. Alerts-inkl.aus.akustische Warnungen. E - mail notification-inkl.aus. benachrichtigungen per E-Mail. Puch-
50 USD
ICT, SMC, SMART MONEY CONCEPTS, SMART MONEY, Smart Money Concept, Support and Resistance, Trend Analysis, Price Action, Market Structure, Order Blocks, BOS/CHoCH,   Momentum Shift, HH/LL/HL/LH,    Fair Value Gap, FVG,  Premium  &   Discount   Zones, Fibonacci Retracement, OTE, Buy Side Liquidity, Sell Side Liquidity, BSL/SSL Taken, Equal Highs & Lows, MTF Dashboard, Multiple Time Frame, BigBar, HTF OB, HTF Market Structure,  Liquidity Voids, Long Wicks, Candle Timer, Fractals, ZigZag, Time Zone
63 USD
Trend Screener Pro MT5
STE S.S.COMPANY
4.97 (36)
Trendindikator, bahnbrechende, einzigartige Lösung für Trendhandel und -filterung mit allen wichtigen Trendfunktionen in einem Tool! Es handelt sich um einen 100 % nicht neu zu malenden Multi-Timeframe- und Multi-Währungs-Indikator, der für alle Symbole/Instrumente verwendet werden kann: Forex, Rohstoffe, Kryptowährungen, Indizes und Aktien. Trend Screener ist ein effizienter Trendfolgeindikator, der Pfeiltrendsignale mit Punkten im Diagramm liefert. Die Funktionen, die im Trendanalysator-Indika
125 USD
AW Trend Predictor MT5
Alexander Nechaev
5 (24)
Die Kombination von Trend- und Aufschlüsselungsebenen in einem System. Ein fortschrittlicher Indikatoralgorithmus filtert Marktrauschen, bestimmt den Trend, Einstiegspunkte sowie mögliche Ausstiegsniveaus. Indikatorsignale werden in einem Statistikmodul aufgezeichnet, das es Ihnen ermöglicht, die am besten geeigneten Tools auszuwählen, die die Wirksamkeit der Signalhistorie zeigen. Der Indikator berechnet Take-Profit- und Stop-Loss-Marken. Handbuch und Anleitung ->   HIER   / MT4-Version ->   H
55 USD
Advanced Supply Demand MT5
Bernhard Schweigert
4.36 (11)
Derzeit 33% Rabatt! Die beste Lösung für jeden Anfänger oder erfahrenen Händler! Dieser Indikator ist ein einzigartiges, qualitativ hochwertiges und erschwingliches Trading-Tool, da wir eine Reihe von proprietären Funktionen und eine neue Formel integriert haben. Mit diesem Update werden Sie in der Lage sein, doppelte Zeitrahmenzonen anzuzeigen. Sie können nicht nur einen höheren TF (Zeitrahmen) anzeigen, sondern sowohl den Chart-TF als auch den höheren TF: SHOWING NESTED ZONES. Alle Supply Dema
199 USD
Blahtech Supply Demand MT5
Blahtech Limited
4.45 (11)
Supply Demand uses previous price action to identify potential imbalances between buyers and sellers. The key is to identify the better odds zones, not just the untouched ones. Blahtech Supply Demand indicator delivers functionality previously unavailable on any trading platform. This 4-in-1 indicator not only highlights the higher probability zones using a multi-criteria strength engine, but also combines it with multi-timeframe trend analysis, previously confirmed swings and engulfing detecto
142 USD
Owl Smart Levels MT5
Sergey Ermolov
5 (1)
Indikator-Leitfaden  |  Owl Smart Levels-Strategie  |   MT4-Version  |  Wie installiert man?   |   FAQ Der Owl Smart Levels Indikator ist ein komplettes Handelssystem innerhalb eines Indikators, der so beliebte Marktanalysetools wie die fortschrittlichen Fraktale von Bill Williams , Valable ZigZag, das die richtige Wellenstruktur des Marktes aufbaut, und Fibonacci-Levels , die die genauen Einstiegslevels markieren, enthält in den Markt und Orte, um Gewinne mitzunehmen. Eine detaillierte Beschre
97 USD
Royal Wave Pro M5
Vahidreza Heidar Gholami
5 (2)
Royal Wave is a Trend-Power oscillator which has been programmed to locate and signal low-risk entry and exit zones. Its core algorithm statistically analyzes the market and generates trading signals for overbought, oversold and low volatile areas. By using a well-designed alerting system, this indicator makes it easier to make proper decisions regarding where to enter and where to exit trades. Features Trend-Power Algorithm Low risk Entry Zones and Exit Zones Predictions for Overbought and Over
129 USD
Der ADR-Umkehrindikator zeigt Ihnen auf einen Blick, wo der Preis derzeit im Verhältnis zu seiner normalen durchschnittlichen Tagesspanne gehandelt wird. Sie erhalten sofortige Benachrichtigungen per Pop-up, E-Mail oder Push, wenn der Preis seine durchschnittliche Spanne und darüber liegende Niveaus Ihrer Wahl überschreitet, sodass Sie schnell in Pullbacks und Umkehrungen einsteigen können. Der Indikator zeichnet horizontale Linien auf dem Chart an den durchschnittlichen täglichen Range-Extreme
49 USD
Werden Sie Breaker Trader und profitieren Sie von Änderungen der Marktstruktur, wenn sich der Preis umkehrt. Der Order Block Breaker Indikator zeigt an, wann sich eine Trend- oder Preisbewegung der Erschöpfung nähert und bereit ist, sich umzukehren. Es weist Sie auf Änderungen in der Marktstruktur hin, die normalerweise auftreten, wenn eine Umkehrung oder ein größerer Rückzug bevorsteht. Der Indikator verwendet eine proprietäre Berechnung, die Ausbrüche und Preisdynamik identifiziert. Jedes
49 USD
Matrix Arrow Indicator MT5
Juvenille Emperor Limited
5 (11)
Matrix Arrow Indicator MT5   ist ein einzigartiger 10-in-1-Trend, der zu   100 % nicht neu gezeichnet   werden kann. Multi-Timeframe-Indikator, der für alle Symbole/Instrumente verwendet werden kann:   Forex ,   Rohstoffe ,   Kryptowährungen ,   Indizes ,   Aktien .  Der  Matrix Arrow Indicator MT5  wird den aktuellen Trend in seinen frühen Stadien bestimmen und Informationen und Daten von bis zu 10 Standardindikatoren sammeln, die sind: Durchschnittlicher Richtungsbewegungsindex (ADX) Rohstoff
75 USD
Market Profile defines a number of day types that can help the trader to determine market behaviour. A key feature is the Value Area, representing the range of price action where 70% of trading took place. Understanding the Value Area can give traders valuable insight into market direction and establish the higher odds trade. It is an excellent addition to any system you may be using. Blahtech Limited presents their Market Profile indicator for the MetaTrader community. Inspired by Jim Dalton’s
142 USD
Royal Scalping Indicator M5
Vahidreza Heidar Gholami
5 (8)
Royal Scalping Indicator is an advanced price adaptive indicator designed to generate high-quality trading signals. Built-in multi-timeframe and multi-currency capabilities make it even more powerful to have configurations based on different symbols and timeframes. This indicator is perfect for scalp trades as well as swing trades. Royal Scalping is not just an indicator, but a trading strategy itself. Features Price Adaptive Trend Detector Algorithm Multi-Timeframe and Multi-Currency Trend Low
149 USD
Das ADR Alert Dashboard zeigt Ihnen auf einen Blick, wo der Preis aktuell im Verhältnis zu seiner normalen durchschnittlichen Tagesspanne gehandelt wird. Sie erhalten sofortige Benachrichtigungen per Pop-up, E-Mail oder Push, wenn der Preis seine durchschnittliche Spanne und darüber liegende Niveaus Ihrer Wahl überschreitet, sodass Sie schnell in Pullbacks und Umkehrungen einsteigen können. Das Dash ist so konzipiert, dass es auf einem leeren Diagramm platziert werden kann und einfach im Hinter
49 USD
Introduction to X3 Chart Pattern Scanner X3 Cherart Pattern Scanner is the non-repainting and non-lagging indicator detecting X3 chart patterns including Harmonic pattern, Elliott Wave pattern, X3 patterns, and Japanese Candlestick patterns. Historical patterns match with signal patterns. Hence, you can readily develop the solid trading strategy in your chart. More importantly, this superb pattern scanner can detect the optimal pattern of its kind. In addition, you can switch on and off individu
250 USD
Automated Trendlines MT5
Georgios Kalomoiropoulos
Trendlinien sind das wichtigste Werkzeug der technischen Analyse im Devisenhandel. Leider zeichnen die meisten Händler sie nicht richtig. Der automatische Trendlinien-Indikator ist ein professionelles Tool für ernsthafte Trader, das Ihnen hilft, die Trendbewegung der Märkte zu visualisieren. Es gibt zwei Arten von Trendlinien Bullische Trendlinien und Bärische Trendlinien. Im Aufwärtstrend wird die Forex-Trendlinie durch die niedrigsten Swing-Punkte der Preisbewegung gezogen. Wenn man m
99 USD
Auto Order Block with break of structure Detect Break of Structure , Mark Order Block and draw Entry / Stop and Risk to Reward lines when Order block is touch by price with Alert. Trend is Manually set to filter signals in a direction by a button on the chart. Entry / Stop and Risk to Reward lines can also be switch on / off by button on chart. Futures Auto Mark Break of Structure Auto Mark Order block Auto Mark higher time frame Point Of  Interest ( POI ) Popup Alert when BoS , Order block
55 USD
Market Structure MT5
Reza Aghajanpour
5 (1)
**   All Symbols   x   All Timeframes   scan just by pressing scanner button ** *** Contact me immediately after the purchase to send you instructions and add you in "Market Structure group" for sharing or seeing experiences with other users. CURRENT PRICE $39..... Future Price $200 Introduction: Market structure is important for both new and professional traders since it can influence the liquidity and price action of a market. It’s also one of the most commonly used techniques to understand tr
39 USD
Strong Support mt5
Vasiliy Strukov
5 (5)
Unterstützungs- und Widerstandsniveaus sind seit langem ein mächtiges Werkzeug für die Marktanalyse. Der Strong Support Indikator baut Unterstützungsniveaus auf lokalen Preistiefs und Widerstandsniveaus auf lokalen Preishochs auf. Meine anderen Entwicklungen finden Sie hier Es wird empfohlen, in Verbindung mit einem Trendindikator wie Gold Stuff zu verwenden, um den Trend zu handeln und gleichzeitig Konsolidierungs- oder Umkehrzonen zu definieren sowie Stop-Loss und Take-Profit auf Unterstü
50 USD
PZ Swing Trading MT5
PZ TRADING SLU
5 (4)
Swing Trading ist der erste Indikator, der Schwankungen in Trendrichtung und mögliche Umkehrschwankungen erkennt. Es wird der in der Handelsliteratur weit verbreitete Baseline-Swing-Trading-Ansatz verwendet. Der Indikator untersucht mehrere Preis- und Zeitvektoren, um die aggregierte Trendrichtung zu verfolgen und erkennt Situationen, in denen der Markt überverkauft oder überkauft ist und zur Korrektur bereit ist. [ Installationsanleitung | Update-Anleitung | Fehlerbehebung | FAQ | Alle Produkte
125 USD
Automatisierte Angebots- und Nachfragezonen der nächsten Generation. Neuer und innovativer Algorithmus, der bei jedem Diagramm funktioniert. Alle Zonen werden dynamisch entsprechend der Preisbewegung des Marktes erstellt. ZWEI ARTEN VON WARNUNGEN --> 1) WENN DER PREIS EINE ZONE ERREICHT 2) WENN EINE NEUE ZONE BILDET WIRD Sie erhalten keinen weiteren nutzlosen Indikator. Sie erhalten eine vollständige Handelsstrategie mit nachgewiesenen Ergebnissen.     Neue Eigenschaften:    
149 USD
PZ Trend Trading MT5
PZ TRADING SLU
3.67 (3)
Trend Trading ist ein Indikator, der so weit wie möglich von den Markttrends profitiert, indem er Pullbacks und Breakouts zeitlich festlegt. Sie findet Handelsmöglichkeiten, indem sie analysiert, was der Preis während etablierter Trends tut. [ Installationsanleitung | Update-Anleitung | Fehlerbehebung | FAQ | Alle Produkte ] Handeln Sie mit Zuversicht und Effizienz an den Finanzmärkten Profitieren Sie von etablierten Trends, ohne ins Wanken zu geraten Profitable Pullbacks, Ausbrüche und vor
125 USD
Stargogs Spike Catcher
Lorenzo Edward Beukes
5 (6)
Stargogs Spike Catcher V3 This Indicator is Developed To milk the BOOM and CRASH indices . Send me Message if you need any help with the indicator.  CHECK OUT THE STARGOGS SPIKE CATCHER EA/ROBOT V3: CLICK HERE ALSO CHECK OUT SECOND TO NONEFX SPIKE CATCHER:   CLICK HERE STARGOGS SPIKE CATCHER V3 WHATS NEW! Brand New Strategy. This is the Indicator you need for 2023. The Indicator Gives you an Entry at a time when conditions are met and you should use TP & SL. New Trendline that changes color in
100 USD
** All Symbols x All Timeframes scan just by pressing scanner button ** ***Contact me after purchase to send you instructions and add you in "123 scanner group" for sharing or seeing experiences with other users. After 15 years of experience in the markets and 3 years of programming, Winner indicator is ready. I would like to share with you! Introduction The 123 Pattern Scanner indicator with a special enhanced algorithm is a very repetitive common pattern finder with a high success rate . Inte
39 USD
PZ Day Trading MT5
PZ TRADING SLU
2.6 (5)
Dieser Indikator erkennt Preisumkehrungen im Zick-Zack, wobei nur Preisaktionsanalysen und ein Donchian-Kanal verwendet werden. Es wurde speziell für den kurzfristigen Handel entwickelt, ohne dass ein Nachlackieren oder ein Backpainting erforderlich ist. Es ist ein fantastisches Werkzeug für clevere Trader, die darauf abzielen, das Timing ihrer Operationen zu verbessern. [ Installationsanleitung | Update-Anleitung | Fehlerbehebung | FAQ | Alle Produkte ] Erstaunlich einfach zu handeln Es bi
125 USD
Trend Scanner mt5 GS
Vasiliy Strukov
5 (6)
Trend Scanner scannt Markttrends aus Multi-Symbolen und Multi-Time-Frames und zeigt sie auf einem beweglichen Panel auf dem Chart an, den er zur Analyse verwendet. Der Händler kann mehrere Paare seiner Wahl zur Anzeige auswählen. Trend Scanner ist ein großartiges Tool, um die Richtung des Trends zu sehen, und kann für den manuellen Handel oder den EA-Handel verwendet werden, indem nur Kauf- oder Verkaufsaufträge gemäß dem Trend zugelassen werden. Echtzeit-Ergebnisse können hier eingesehen wer
50 USD
Sind Sie es leid, Unterstützungs- und Widerstandslinien zu zeichnen? Der Unterstützungswiderstand ist ein Multi-Zeitrahmen-Indikator, der Unterstützungs- und Widerstandslinien mit einer sehr interessanten Wendung automatisch erkennt und zeichnet: Wenn das Preisniveau im Laufe der Zeit getestet wird und seine Bedeutung zunimmt, werden die Linien dicker und dunkler. [ Installationsanleitung | Update-Anleitung | Fehlerbehebung | FAQ | Alle Produkte ] Steigern Sie Ihre technische Analyse über Nacht
99 USD
God win spike system
Israr Hussain Shah
1 (1)
• Non Repaint • DelayNo Lag •Pop Up notification • 98% Verified Accuracy • Real time arrows to catch spikes at least 4-8 bars We forward guide video how milk spikes  We also add in telegram group for better quality help  +see live trading results  https://youtu.be/DCG4CAWlg4I you will see an arrow signal and open trade for spike stop-loss of trade will be 8 or 10 candles if no spike exit you just need to follow spike arrow signals and for more good results follow inst
200 USD
Dieses Dashboard ist ein Warntool zur Verwendung mit dem Indikator für die Umkehrung der Marktstruktur. Sein Hauptzweck besteht darin, Sie auf Umkehrmöglichkeiten in bestimmten Zeitrahmen und auch auf die erneuten Tests der Warnungen (Bestätigung) aufmerksam zu machen, wie es der Indikator tut. Das Dashboard ist so konzipiert, dass es auf einem eigenen Chart sitzt und im Hintergrund arbeitet, um Ihnen Benachrichtigungen zu Ihren ausgewählten Paaren und Zeitrahmen zu senden. Es wurde entwickelt,
49 USD
Weitere Produkte dieses Autors
Shows min and max of last M5 Candle. Can be used to trade breakouts of last M5 candle.  The M5 Candle Breakout Strategy avoids to stay too long in a sindways phase. See documentation on  @swisstrader3713, where you can follow my live trading. The only parameters are the color of the lines defining the M5 stretch. Best use the indicator in M1 timeframe. The M5 Breakout Strategy has helped me to reduce overtrading.
FREE
Swiss VWAPsimple
Terence Gronowski
5 (3)
Swiss VWAPsimple Motivation Ich fand keinen zuverlässigen gratis VWAP Indikator für MT5. VWAP ist ein sehr wichtiger Indikator. Aber Vorsicht, er ist unpräzise, insbesondere am Abend, falls die Summen schon sehr gross sind. Um den Computer zu schonen und Abstürze zu vermeiden wird der VWAP nur immer von Mitternacht aus gezeichnet. Bei geschlossenen Märkten wird nichts angezeigt, ausser man deaktiviert useBarsSinceMidnight. Was ist VWAP, wie wird er angewandt?  VWAP steht für Volume Weighed Ave
FREE
Opening Range Indicator Idee Die Opening Range Strategie wurde zum ersten Mal von Tobi Crabel in den 90ern publiziert. In der Zwischenzeit haben sich die Märkte verändert, jedoch scheint die Opening Range insbesondere beim Indextrading immer noch sehr signifikant zu sein.  Das Prinzip ist folgendes: Man zeichnet die Grenzen der ersten Stundenkerze in den Chart. Die Länge der Range wird mit "stretch" bezeichnet.  Ein Ausbruch nach oben aus der Range wird wie folgt getradet: Stopp Loss an der un
FREE
Swiss InsideOutsideBar
Terence Gronowski
5 (2)
Swiss InsideOutsideBar Die Bedeutung von Inside- und Outside Bars Inside Kerzen sind komplett durch die Vorgängerkerze umschlossen (Harami Muster). Outside Kerzen unschliessen die Vorgängerkerze.   Insidekerzen können eine kondensierte Form eines symmetrischen Dreicks darstellen, Symetrische Dreiecke sind der Ausdruck des Kampfes zwischen Bären und Bullen. Meist brechen symmetrische Dreiecke in die Richtung des übergeordneten Trends aus, das muss aber nicht immer der Fall sein. Eine Insidekerze
FREE
Normal Parabolic SAR with label of long or short state. Tells also "Parabolic long" and "short". Can be used in multitimeframe layouts together with Swiss HolyGrail indicator or in different timeframes. So, if all the indicators show "long" or "short" you can be sure that the risk of a wrong direction is small. The standard values for Parabolic SAR are 0.02 for step and 0.2 for maximum. You may experiment with changing the maximum to get smother curves.  Note that changes in parabolic SAR are la
FREE
Swiss HolyGrail
Terence Gronowski
Swiss Holy Grail Indicator Motivation und Funktionsweise Der HolyGrail Indikator dient der Optimerung eines Einstiegs. Genau in diesem Moment habe ich mich ertappt, dass ich in einem Aufwärtstrend short gegangen bin, also antizyklisch eingestiegen bin. Oder ich bin ein einen viel zu reifen Trend eingestiegen. Solche Fehler dieser Indikator verhindern: Man sollte sich immer bewusst sein, ob an pro- oder antizyklich einsteigt, auch muss man immer über die Reife des Tends bescheid wissen. Linda Ras
FREE
FasterShark
Terence Gronowski
5 (1)
FasterShark Trading Assistent Handeln ist wie Baden in einem Becken voller Haie. Um zu überleben, musst du der schnellere Hai sein. Das Tool hält Sie über alle Parameter auf dem Laufenden und erlaubt ein sehr schnelles Handeln ohne das Risiko zu vernachlässigen. Ich habe dieses Tool programmiert, um ständig über das Geschehen informiert zu sein. Früher habe ab und zu vergessen, einen Stopploss zu setzen. Diverse Fehler werden mit diesem Tool verhindert. Außerdem ermöglicht Ihnen dieses Tool,
FREE
RSI talking, benutze alle deine Sinne beim Handeln! Die Idee Beim Trading können deine Augen sehr beansprucht werden. Deshalb habe ich RSItalking programmiert, der dir sagt, wenn der RSI in einem Extembereich steht. Handel, was du siehst und was du hörst ! Funktion Dieser Indikator sagt "rsioverbought", wenn der rsi über einem Schwellenwert liegt (Standard 75%) und "rsioversold", wenn er unter einem unteren Grenzwert liegt (Standard 25%). Wenn Sie eine Long-Position halten, empfehlen w
FREE
Swiss CandleTime
Terence Gronowski
5 (2)
Swiss CandleTime Wozu dieser Indikator CandleTime zeigt die verbleibende Zeit, bis die Kerze vollendet ist. Ich brauche diesen Indikator, falls ich das Halten einer Position im M3 Chart verwalte. Meist warte in in einem Aufwärtstrend eine erste rote M3-Kerze ab. Beginnt die folgende auch rot zu werden, stelle ich den Trade glatt.  Timeframes M1 bis H1 Inputs Arrow displayed => Editieren des Pfeilstrings Arrow for waiting conditions => Editieren des offline Pfeilstrings Text Color => Textfarbe Te
FREE
Auswahl:
diamondfx360
29
diamondfx360 2023.01.10 11:24 
 

Thanks for coding this been looking for such .

drzocker
90
drzocker 2023.01.08 09:30 
 

Gute arbeit

Gyorgy Nesztor Szanto
34
Gyorgy Nesztor Szanto 2022.11.04 19:46 
 

Excelente aporte, muchas gracias. Sólo comentar que, con la actualización No. 3484 del 3 de noviembre de 2022 de MT5 todas las leyendas "R3, R2, Hi H1, etc., al cambiar de tamaño el cuadro del chart (reducir su tamaño o aumentar) se desconfigura y no queda debajo de sus lineas correspondientes. Las lineas en sí estan bien, es sólo el texto que los acompaña. ¡Saludos!

vvm-55
69
vvm-55 2022.10.17 11:02 
 

Ich bin zufrieden

roket52
14
roket52 2022.09.22 04:50 
 

Thank you much appreciated for this indicator as it provides these key levels. my only suggestion for improvement would be the ability to customise the line types and size and the ability to move the text positions too. Thanks for your work

HOGJoerch63
214
HOGJoerch63 2022.09.03 10:31 
 

Sehr nützlich und präzise. Dankende Grüße in die Schweiz

Kflynn
34
Kflynn 2022.05.28 14:15 
 

Excellent indicator.

Lully
118
Lully 2022.02.06 01:52 
 

Great ind. we need it for weekly and monthly if possible

gr8aarkays
26
gr8aarkays 2021.12.11 08:06 
 

Amazing lines, working perfect

Evgeny Belyaev
311525
Evgeny Belyaev 2021.09.24 17:30 
 

Good indicator

PrincipeRk
34
PrincipeRk 2021.09.12 00:38 
 

Buen complemento de indicadores

Souq
25
Souq 2021.07.13 15:43 
 

Amazing! Congratulations! 👍👍

Michael Schneider
865
Michael Schneider 2021.07.07 22:28 
 

I like it. Makes trading much simpler

Rogerio1985
356
Rogerio1985 2021.05.25 03:03 
 

Muito bom mesmo!!!

CEMKIVIRCIK
14
CEMKIVIRCIK 2021.05.21 19:28 
 

Hi, Do you have the same indi for MT4 platform? thx

ndiru2
64
ndiru2 2021.04.24 12:48 
 

Very helpful indicator

vasanton
108
vasanton 2021.03.17 15:06 
 

интересный индикатор.

Clesio Hector Dufau Da Conceicao
221
Clesio Hector Dufau Da Conceicao 2021.01.25 14:33 
 

Great job. One just set to add: line width (1, 2, 3...)

Michael Dias
145
Michael Dias 2020.12.26 05:01 
 

Indicador muito bom, parabéns, grato por disponibilizar gratuitamente.

Not4putter
44
Not4putter 2020.11.10 10:18 
 

Super

12
Antwort auf eine Rezension
Version 1.20 2019.02.15
One per bar introcuced. There was a flicker on some pcs.
Version 1.10 2019.01.27
Correction of error: Lines were not deleted when indicator was removed. Now they are gone when the indicator is removed from chart (if they are still there just change the timeframe up and down).