MSL Smart Trade
- Indicadores
-
Andrei Lukoianov
 ANDREI LUKOIANOV · MarketStructureLab
Trader desde 2008 | Trading algorítmico desde 2018
De uma ideia de trading a um sistema claro de atuação - Versão: 1.1
- Ativações: 20
Smart Trade — confirmed signals, two targets and an active stop on your MT5 chart
When a candle closes beyond a confirmed swing level, Smart Trade marks the LONG or SHORT signal and displays Entry, TP1, TP2 and Trail on the right side of the chart. You can see which levels to watch and where the stop currently sits without redrawing the setup after each signal.
From signal to exit
- Signals are confirmed at candle close. Smart Trade checks for a break of the latest confirmed swing high or low. If price crosses the level during the candle but moves back before it closes, no signal marker appears.
- Entry and targets are visible as soon as the signal is confirmed. Entry is the calculated entry price. TP1 and TP2 are based on volatility at the time of the signal and stay fixed throughout the setup. A checkmark appears next to each target when price touches it.
- The trailing stop updates as price moves. For LONG, the stop can only rise; for SHORT, it can only fall. After price touches TP2, the calculated stop moves to TP1 unless it has already tightened beyond that level. The updated stop takes effect from the next candle.
- Trail exits are marked on the chart. When price touches the active stop, a TRAIL EXIT label appears. A confirmed signal in the opposite direction also closes the current setup.
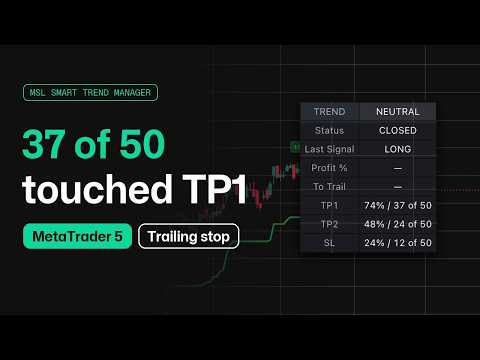
Dashboard: see what’s happening now and how past setups developed
For an active setup, the dashboard shows the direction, status, latest signal, price movement from the calculated entry (Profit %), and distance to the active stop (To Trail).
For closed setups, TP1 and TP2 show how often price reached each target. SL counts setups that ended at the trailing stop before reaching TP1. For example, 42 of 50 in the TP1 row means price touched the first target in 42 of the 50 closed setups in the sample. These are target-touch statistics; they do not measure winning trades or account returns.
Adjust the settings for your instrument and timeframe
Start with the defaults and see how the signal frequency and level distances fit your chart. Settings that suit one instrument or timeframe can behave differently on another. If signals appear too often, try increasing the swing detection period or the minimum interval between signals. Target distances and the trailing stop distance can be adjusted separately.
- PivotLength / MinBarsBetweenSignals — swing detection period and minimum number of bars between signals.
- ATRLength / ATRMultiplier — volatility calculation period and trailing stop multiplier. Defaults: 14 bars and 4 ATR.
- TP1ATRMultiplier / TP2ATRMultiplier — target distances from the calculated entry. Defaults: 2 and 3.5 ATR.
- StatisticsSample — sample size: 10 to 200 closed setups, with a default of 50.
- Appearance — customize colors, label sizes, level projection length and dashboard position. The trail, target labels, projected levels and dashboard can each be hidden independently.
- Alerts — MT5 notifications for confirmed LONG/SHORT signals, target touches and trail exits.
Smart Trade is designed for manual trading. It calculates and displays levels on the chart; you decide whether and when to place orders.
In the demo, follow one setup from signal to exit. Watch the levels appear after the candle closes, see how target touches are marked, and follow the stop as it updates. That’s the quickest way to see how Smart Trade fits your workflow.