Net Risk Position Board

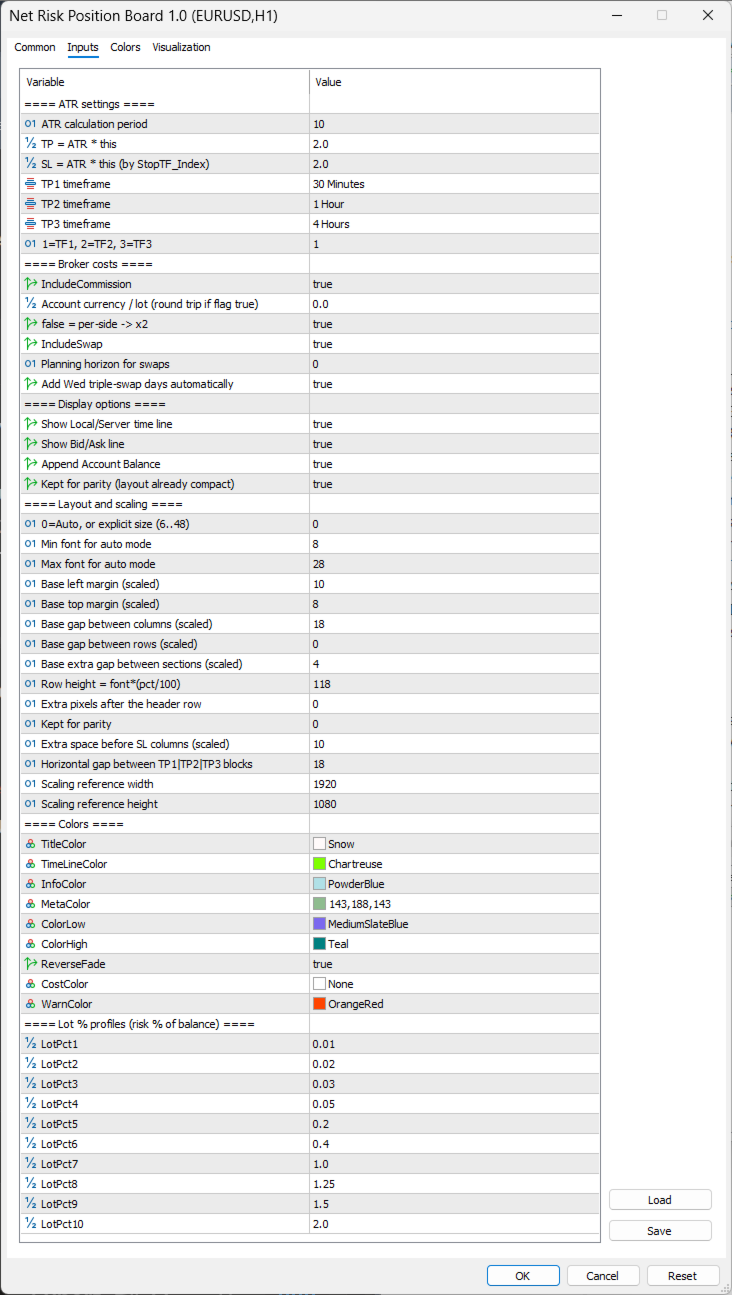
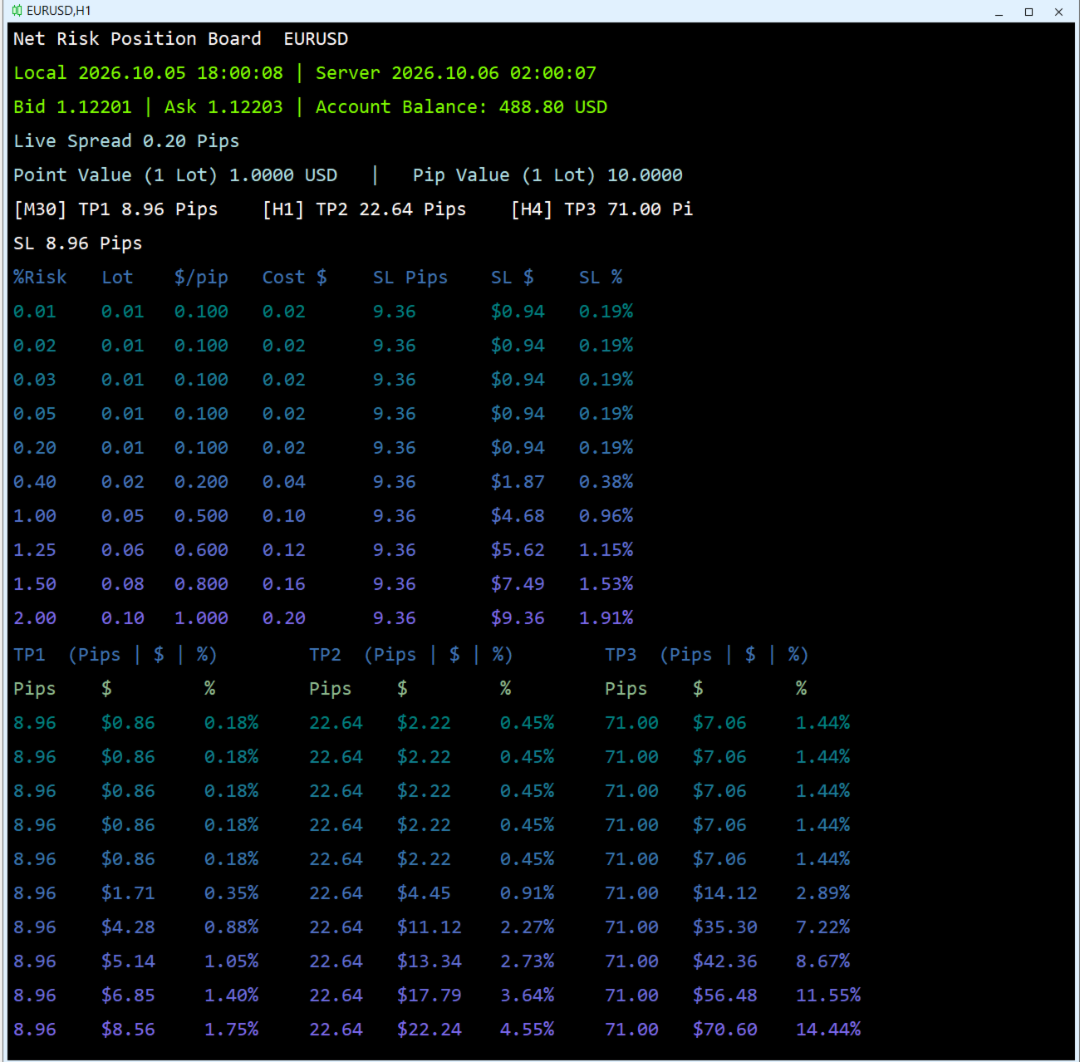
 is an on-chart pre-trade planner for the symbol on that chart. It clears the price and time scales and fills the tab with a live reading of this account against this symbol: spread, pip value, point value, an ATR stop, three ATR targets, and ten lot sizes sized from a percent of balance. Targets are reduced by the live spread. The stop is increased by it. Commission and planned swap are then applied, so the money and percent figures are net of those costs before a buy or sell.

It does not place, change, or close orders. It is a planning board only.

Limitations

  • The chart tab is taken over. Price scale, time scale, and the price plot are hidden, and they are not restored when the indicator is removed.
  • Spread is the live ask minus bid, in pips. It is not a session average.
  • Commission is the value you type. It is not read from the broker.
  • Swap uses the long rate only. Short swap is not shown. Only point-based swap is converted with tick value. Other swap modes are used as raw numbers and can be wrong.
  • Lot size uses balance, not equity or free margin, and only the chart symbol.
  • Money labels use a $ prefix even when the account currency is not USD.
  • ATR is the last closed bar, not the forming bar. Risk inputs are percents: 0.01 means 0.01% of balance, not 1%.

Benefits

  • Balance, currency, bid, ask, pip value, and lot step sit in the same view as the plan.
  • Ten profiles show the lot, the cost, and the stop in money and in percent of balance for the risk you chose.
  • Three timeframe targets are set against one stop, after spread, commission, and swap.
  • Text scales to the chart tab, so the board follows the window instead of a fixed font.
Mais do autor
Automated Timeframe cycling with Symbols centered.  Force every timeframe onto one clock window, so the story you see on Daily is the same story you are slicing on H4, H1, and M1.  Traders usually flip timeframes and lose the span. A Daily chart shows a few weeks, then M15 shows a few hours, and the eye treats them as different markets. TASSERACT locks the window to N bars of the highest enabled timeframe — default 10 Daily — and maps every lower timeframe to that same stretch. You stay inside o
FREE
Displays broker-provided LONG and SHORT swap values for selected instruments in a full-chart, dynamically sized table. The Swaps Monitor Table provides a simple way to view the swap rates supplied by your broker for multiple trading instruments at once. The table can display instruments from Market Watch, all available instruments, or a manually selected list , allowing traders to monitor swap costs without opening each symbol individually. The indicator automatically adjusts the table cells an
FREE
Market Watch's Symbols,  Lot Sizing choice,  Spread, & Price are shown. The app is visually customizable. Click on any Symbol for interaction with its chart!   Trader Market Watch is a display-only MetaTrader 5 board. It fills the chart tab with the symbols already in Market Watch and does not place or modify orders. Each row shows the symbol, the spread in pips, and the price. Two lot columns sit beside them: the lot size that uses your chosen percent of balance as margin, and the largest
FREE
visual trade planner for MetaTrader 5. It draws multi-timeframe ATR reward and stop zones on the chart so you can judge distance and payoff before you place the trade yourself. It does not send, modify, or close orders. Motive A single ATR on the chart timeframe often hides the larger and smaller ranges a trade is actually working against. This EA stacks three take-profit slices, each from its own timeframe, period, and multiplier, then places an ATR stop and an optional fixed stop beside them.
FREE
is designed to enhance the visual representation of financial charts in MetaTrader 4 by dynamically altering the colors of various chart elements, including candlesticks, bars, line charts, and volume bars. Its primary purpose is to improve trader intuition and engagement during market analysis by introducing smooth, cyclical color transitions that can highlight momentum shifts, trends, or volatility without overwhelming the display. This functionality is particularly beneficial for traders who
FREE
Table MATR
Abraham Correa
A Market Watch multi-timeframe ATR dashboard that turns a chart into a full-screen table showing each selected symbol’s recent volatility across multiple timeframes. It calculates ATR for the symbols visible in Market Watch, then displays the result in pips, points, or raw price units. Its practical use is volatility scanning, quickly finding instruments and timeframes that are moving enough—or quietly enough—for your trading style.                                Period that is worth using Sty
FREE
Market Watch's Symbols,  Lot Sizing choice,  Spread, & Price are shown. The app is visually customizable. Click on any Symbol for interaction with its chart!   Trader Market Watch is a display-only MetaTrader 4 board. It fills the chart tab with the symbols already in Market Watch and does not place or modify orders. Each row shows the symbol, the spread in pips, and the price. Two lot columns sit beside them: the lot size that uses your chosen percent of balance as margin, and the largest
FREE
BirdsIview
Abraham Correa
is a user-friendly MetaTrader 4 indicator that creates a centralized dashboard for traders to oversee market symbols simultaneously across different timeframes, presenting price movements through simple dots or miniature candlestick charts, complemented by volume indicators to facilitate quick assessments of market trends and fluctuations. It automatically resizes grid cells according to the number of bars shown per timeframe for better use of screen space, features adjustable color schemes fo
FREE
Grid MATR
Abraham Correa
Grid MATR is designed to map price against dynamically measured or fixed ranges so traders can better visualize volatility, market extension, and session-based price behavior—while requiring independent analysis for direction and trade decisions.  The motive is to turn market volatility and selected time/session reference points into a visual price grid.  Instead of claiming to predict price direction, it gives the trader a structured way to judge where current price sits relative to ATR-deriv
FREE
It computes BUY and SELL lot sizing in either % of balance or in fixed intervals. In market orders, this EA contains the adaptive slippage, logs tickets for instant confirmation of opening trades, and contains every market symbol at a glance. Real-time balance/equity display keeps margin health in view without tab-switching, toggling spread if needed for liquidity checks. Compact left-panel layout minimizes screen real estate, empowering blind trades where speed trumps overanalyze—perfect for
FREE
Bigger chart labels would allow the user to be entirely aware of which chart he/she is on. Each chart window is unique, containing different patterns and economic motives so acknowledging the chart window would be absolutely essential! There are well known Economic Time Zones included in clear view, by choice!    Simple does it! Use your computing mouse scroller, clicking with the right finger on the label, in order to customize the label properties. From there, choose your preferred color, fon
FREE
This script paces itself to zoom into the deepest setting of ZOOM +     You may be in tune to know a few keyboard easter eggs. Pressing the  minus <->  button has the capability to Zoom the Chart Outward! Interesting to see the price reevaluate itself in perspective. This we could see is quite contagiously useful if we wanted to be quick with analyzing, examining through your tools, in your plans and such. So, if you ever wanted to zoom IN and OUT, here is Your play around with the chart poin
FREE
Symbol Cycler is a lightweight on-chart utility that lets you quickly switch between symbols in your Market Watch list using two simple arrow buttons (). With a single click, you can scroll forward or backward through your predefined symbols without leaving the chart. Key Features: One-click symbol switching from the chart Works with your Market Watch list order Buttons can be placed in any chart corner or even the center Timeframe remains locked while switching symbols Clean, responsive UI
FREE
Its primary motive is to overlay horizontal lines spaced according to multiples of the Average True Range (ATR), centered on a reference price from defined periods such as trading sessions, candlestick counts, or 12-hour intervals. This facilitates the identification of potential support and resistance levels or expected price ranges. Additionally, it marks major forex trading sessions (Sydney, Tokyo, London, and New York) with arrows to provide contextual awareness of market hours, enhancing d
FREE
Predetermination
Abraham Correa
5 (1)
Predetermination is an exit manager for trades you open yourself. It does not open positions and it does not send signals. After a manual buy or sell, it gives that trade a stop and up to six exit stages based on volatility. Three stages come from Average True Range, each with its own timeframe. Three come from completed range: daily (ADR), weekly (AWR), and monthly (AMR). Each stage can be switched on or off. Enabled stages are sorted by distance. Nearer stages trail the stop. The
FREE
Designed to mark a specific price and time point on an MT4 chart based on a single mouse click, synchronizing this data across all timeframes for the same symbol. Its primary purpose is to help traders pinpoint and track critical levels or events (e.g., support/resistance or entry points) with persistent visual markers. The indicator uses dashed lines for price and time crosshairs, accompanied by labels that dynamically adjust to stay within chart boundaries, ensuring clarity regardless of win
FREE
An on‑chart, data‑driven pre‑trade planner that turns your broker’s live market properties into clear, actionable numbers. It consolidates spread, commission, swaps, ATR‑based stop/targets, pip/point value and 10 risk‑profile lot sizes into one compact panel that auto‑scales to any chart size. The display is direction‑agnostic (no LONG/SHORT duplication) and emphasizes total trade cost and true risk/reward before you click “Buy/Sell.” What it shows (at a glance) Time & price context  (Local/Serv
FREE
The SyncAllCharts indicator streamlines trading by automatically aligning all open MetaTrader 4 charts to the symbol of the chart where it’s applied, saving traders time and effort when analyzing a single asset across multiple timeframes or setups. With a customizable "Main Sync" label to identify the lead chart, it ensures a clear, clutter-free workspace, enhancing workflow efficiency and consistency for traders monitoring one currency pair or symbol.
FREE
The SymbolicTimeFramingUniverse indicator for MetaTrader 4 (MT4) is designed to enhance chart navigation by displaying the current symbol and timeframe as stacked labels directly on the chart window. It provides precise alignment and customization options, including positioning in the center or corners, adjustable offsets, font styling, and layer controls for visibility (such as background placement or color flashing). This tool supports professional trading workflows by ensuring quick identific
FREE
Adaptando - se à volatilidade, o risco potencial para recompensar as posições de negociação é apresentado com base no intervalo real Médio. Caixas de risco-recompensa são mostradas quando o botão' Comprar ou vender ' é clicado! Uma utilidade do cálculo ATR, regozije-se com uma questão que não faz parte de uma decisão difícil de quando fechar uma negociação. Esta questão ajudaria a sua decisão de gestão de riscos.  Especificacao O intervalo Real médio é um indicador frequentemente utilizado que
FREE
Labels
Abraham Correa
Prints  ALL current chart's symbol and timeframe as customizable labels, ensuring precise anchoring and automatic repositioning during window resizes, timeframe switches, or other chart events. It supports layered display options (background, forefront, or combined color modes) for enhanced visibility without obstructing price data. The accompanying script facilitates global application by attaching or updating the indicator across all open charts in a single execution, promoting efficiency in m
FREE
Analyze volatility by clicking on a specific candlestick, which triggers the display of horizontal grid lines centered around the candlestick’s closing price, spaced by multiples of the calculated ATR. A vertical line highlights the selected candlestick, and an optional text label can display the ATR value in pips above the candlestick. The indicator is lightweight, using no buffers, and relies on chart objects for visualization. It includes error handling for invalid candlestick selections and
FREE
Activation initiates the sequence from the initial symbol in the Market Watch roster, forming a perpetual loop that continues until deactivation. The system employs global terminal variables to sustain operational continuity amid symbol-induced reinitializations, thereby ensuring uninterrupted performance. This EA should not be checked off as 'Allowed live Trading' and is functional with that checkmark box, when uploading the EA. Principal advantages encompass augmented productivity in overseein
FREE
Designed to revolutionize trading efficiency, this app enables traders to seamlessly cycle through Market Watch symbols using intuitive keyboard arrow keys or dynamically positioned on-chart buttons, minimizing navigation time and enhancing focus on market analysis. Potential : This lightweight MetaTrader 4 tool unlocks rapid symbol switching for comparative analysis across assets, supports wrap-around navigation for uninterrupted workflows, and adapts button placement to stay within chart
FREE
A versatile on-chart tool displaying real-time ATR values across up to 10 timeframes (M1 to MN1) in numerical format, bypassing subwindow charts for cleaner analysis. Key features: Toggle per-timeframe visibility, decimal/pips mode, customizable multiplier (e.g., for scaled stops), font/size/color adjustments, and corner/center positioning. Ideal for volatility-based trading—compute position sizes or filters instantly without manual math. Free download; compatible with MT4 Build 600+. Enhances m
FREE
Shutdown
Abraham Correa
Ever needed to declutter your entire POV of the platform? Have the choice to delete ever chart window! When attaching this script, permission is required to close every chart window, no matter the symbol, timeframe, or amount of indications or EA's, ACTIVE. The autonomy of nullifying every chart and to be on the gray screen, happens with this script, essentially. I could go ahead and tell you, the Market Watch List of Symbols has always remained opportune to the traders of the internet, so car
FREE
Omnirange
Abraham Correa
is an exit manager for trades you open yourself. It does not open positions and it does not send signals. After a manual buy or sell, it gives that trade a stop and up to six exit stages based on volatility. Three stages come from Average True Range, each with its own timeframe. Three come from completed range: daily (ADR), weekly (AWR), and monthly (AMR). Each stage can be switched on or off. Enabled stages are sorted by distance. Nearer stages trail the stop. The furthest is posted as the take
FREE
Filtro:
Sem comentários
Responder ao comentário