Volume Zone Overlay MT4
- Indicadores
-
Part-time Day Trader
 Consistent Trading Made Easy
I build practical MT4 and MT5 tools that help traders follow structured execution routines with greater discipline, consistency, and confidence. - Versão: 1.0
- Ativações: 8
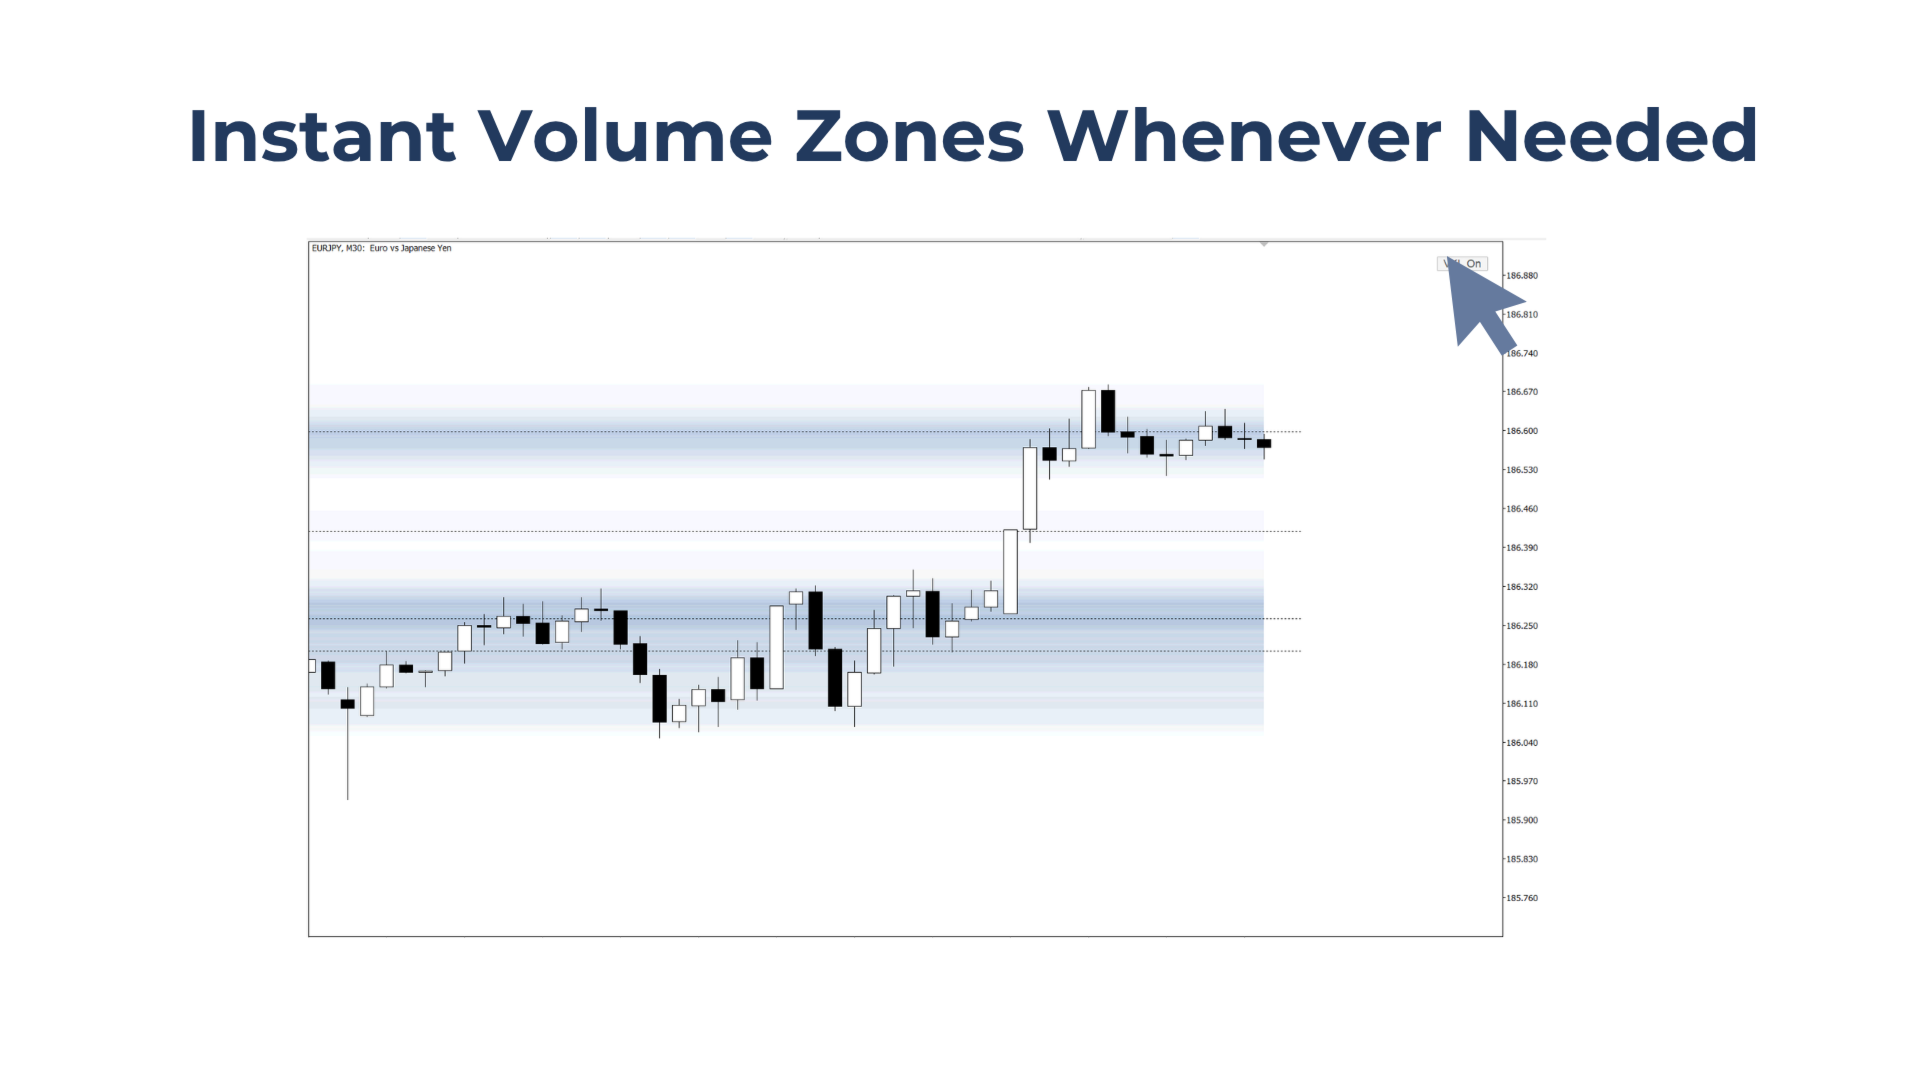
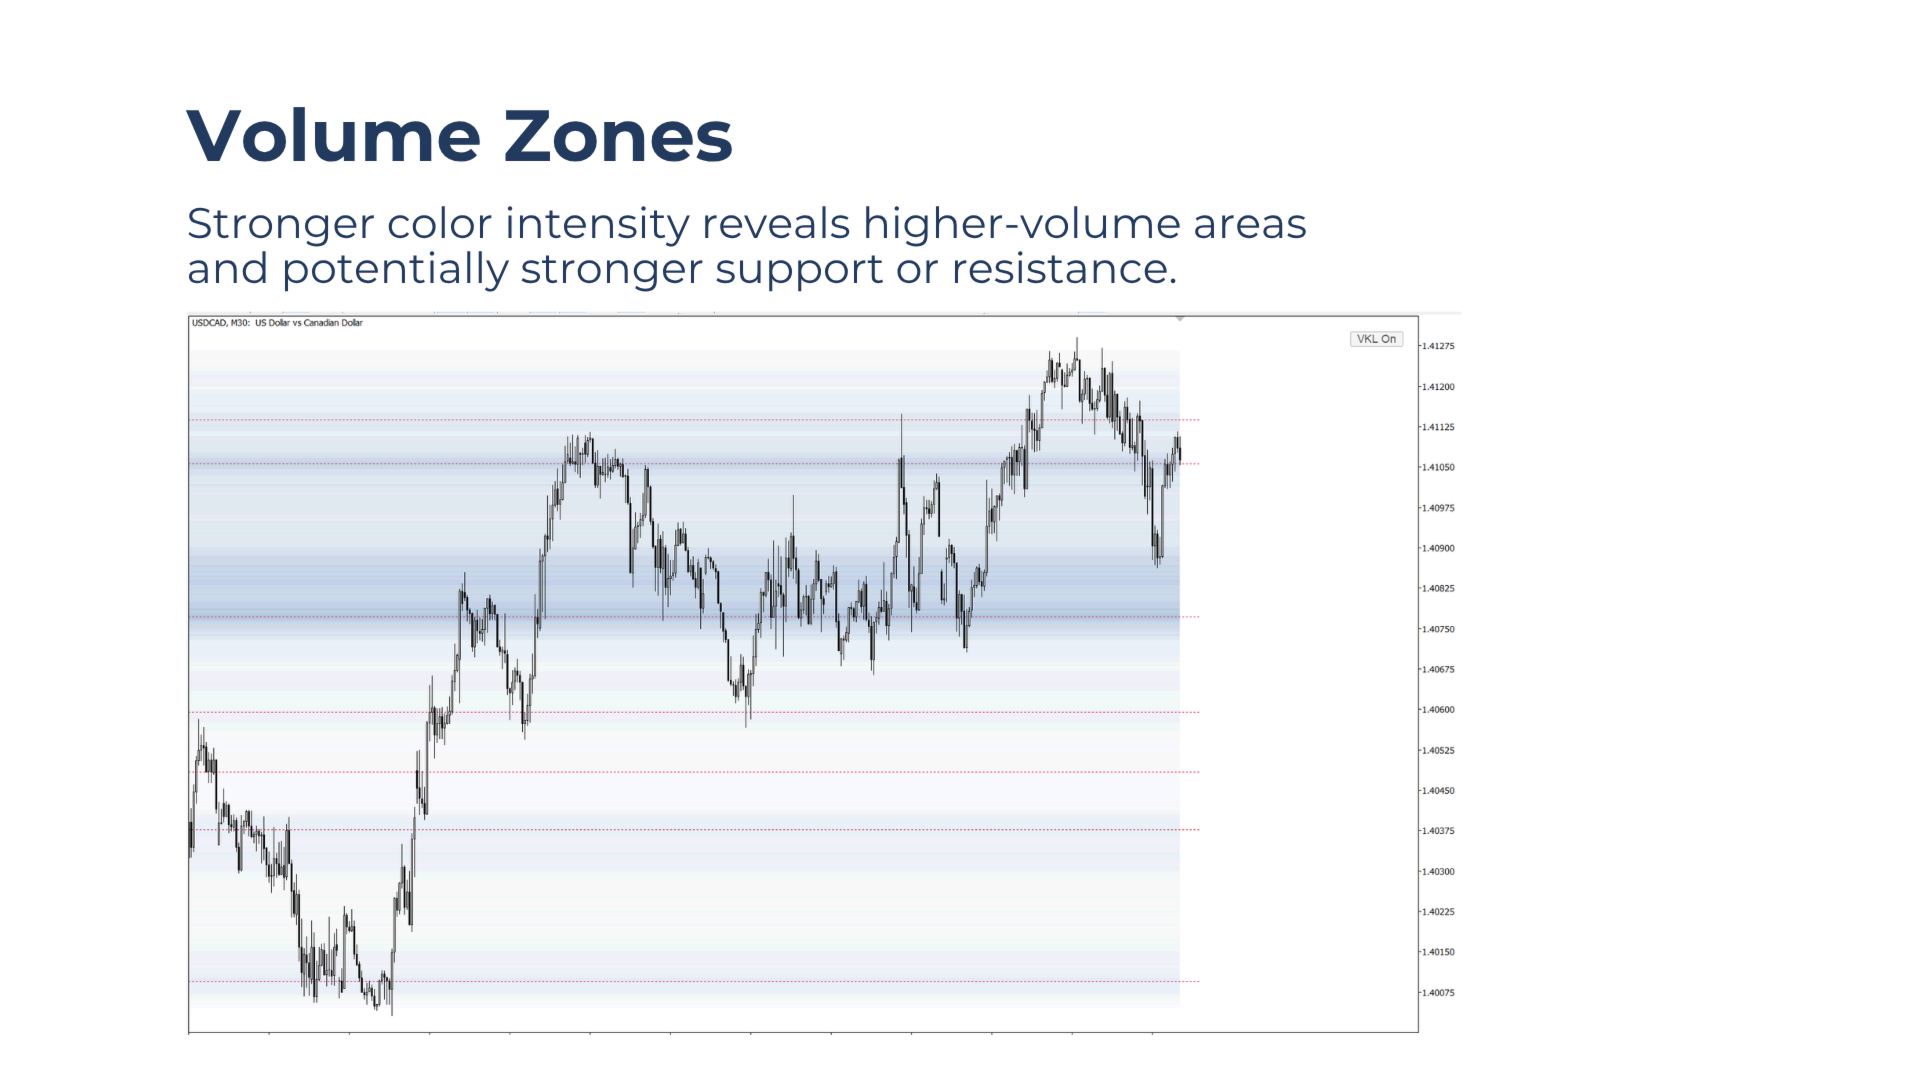
With Volume Zone Overlay, users can instantly reveal volume-based support and resistance zones where price may react. Darker colors represent higher trading volume and potentially stronger support or resistance.
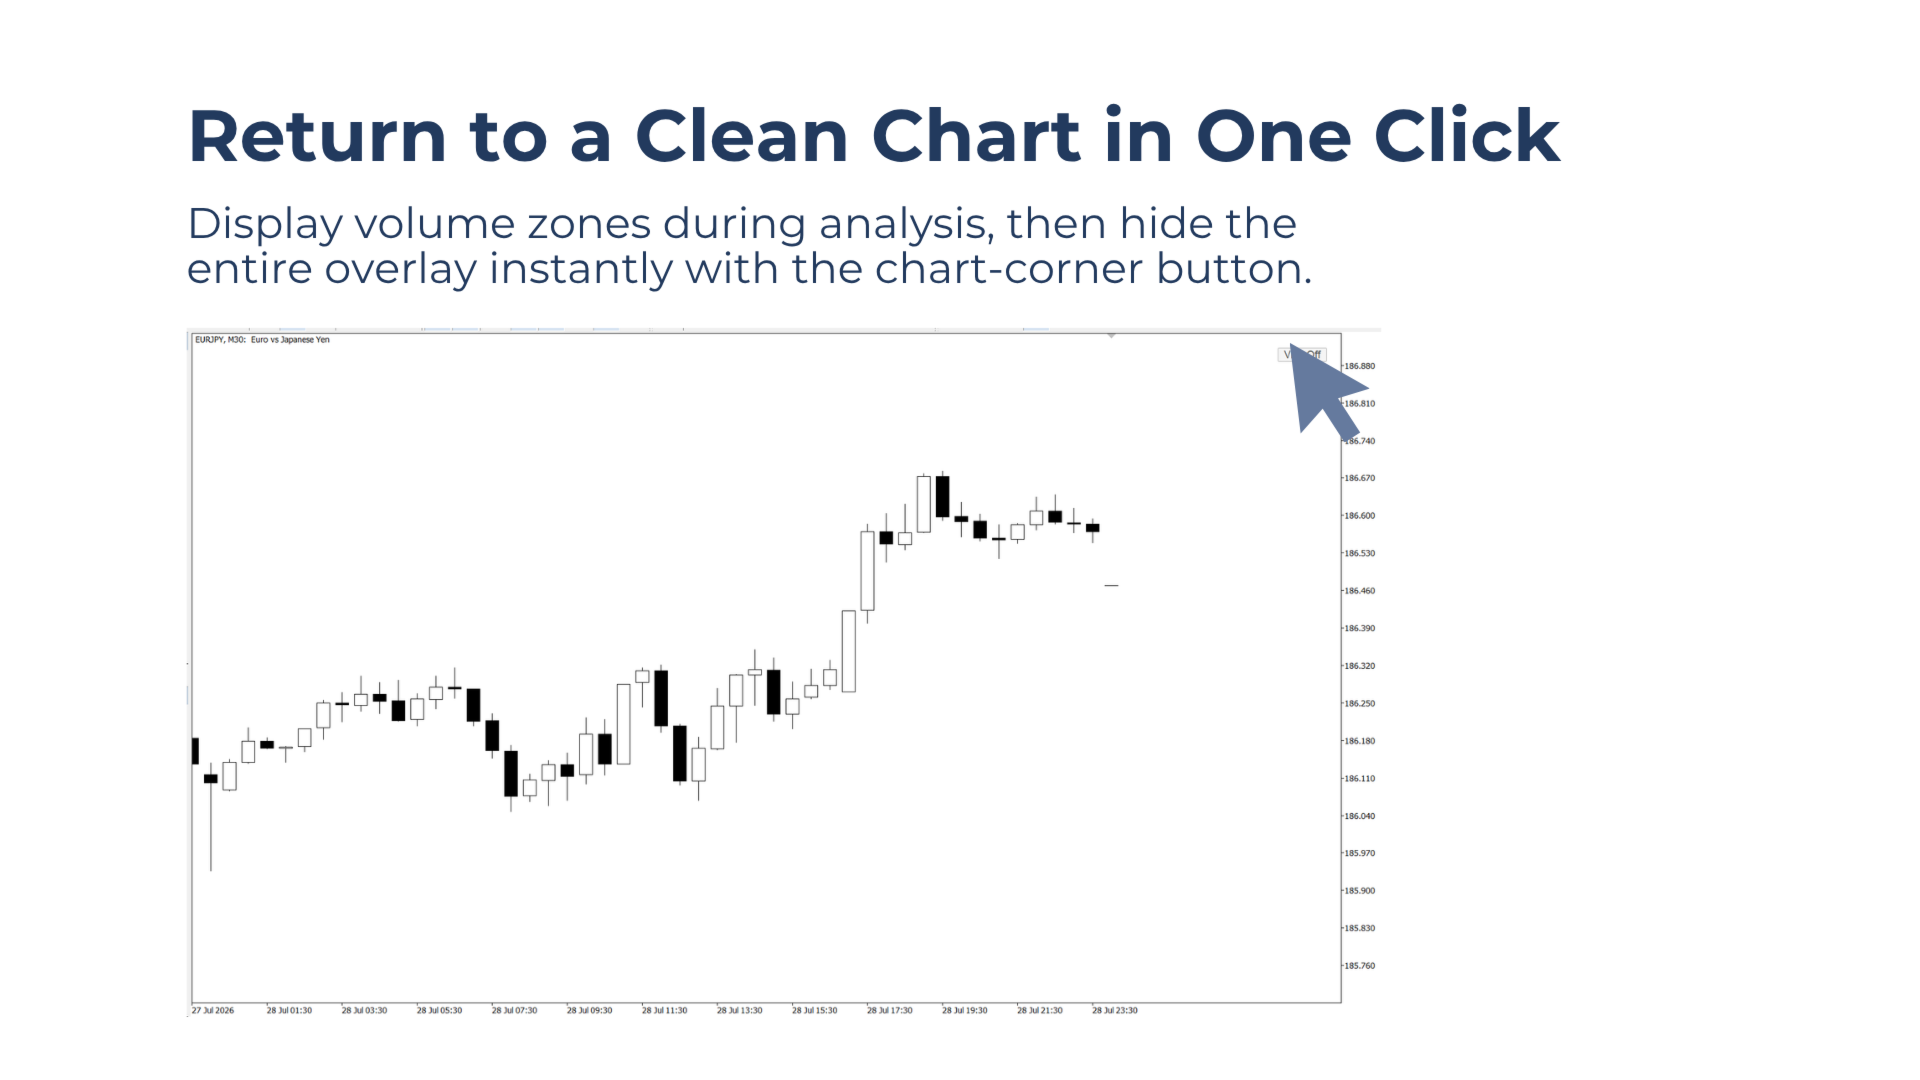
The chart-corner button shows or hides the overlay instantly, keeping the chart clear whenever the volume zones are not needed.
Download the demo and test Volume Zone Overlay directly in the Strategy Tester.
Built For Traders Who Want To:
- Use volume-based support and resistance zones to plan entries, stop-loss areas, and targets.
- Identify areas where price may react from the market's volume footprint.
- Keep charts clean by displaying volume zones only when required.
- Add volume context without relying on a permanently visible profile.
Key benefits
Volume Levels on Demand
Show the heatmap when analysing the market, then hide all zones and levels instantly with one button click.
Spot Important Volume Areas Quickly
Higher-volume areas appear with stronger colour intensity, making potentially important support and resistance zones easier to recognise.
Highlight Key Levels Within the Profile
Local volume peaks are marked as key levels, including important concentrations located within both broad and narrow volume zones.
More Detail When Zooming In
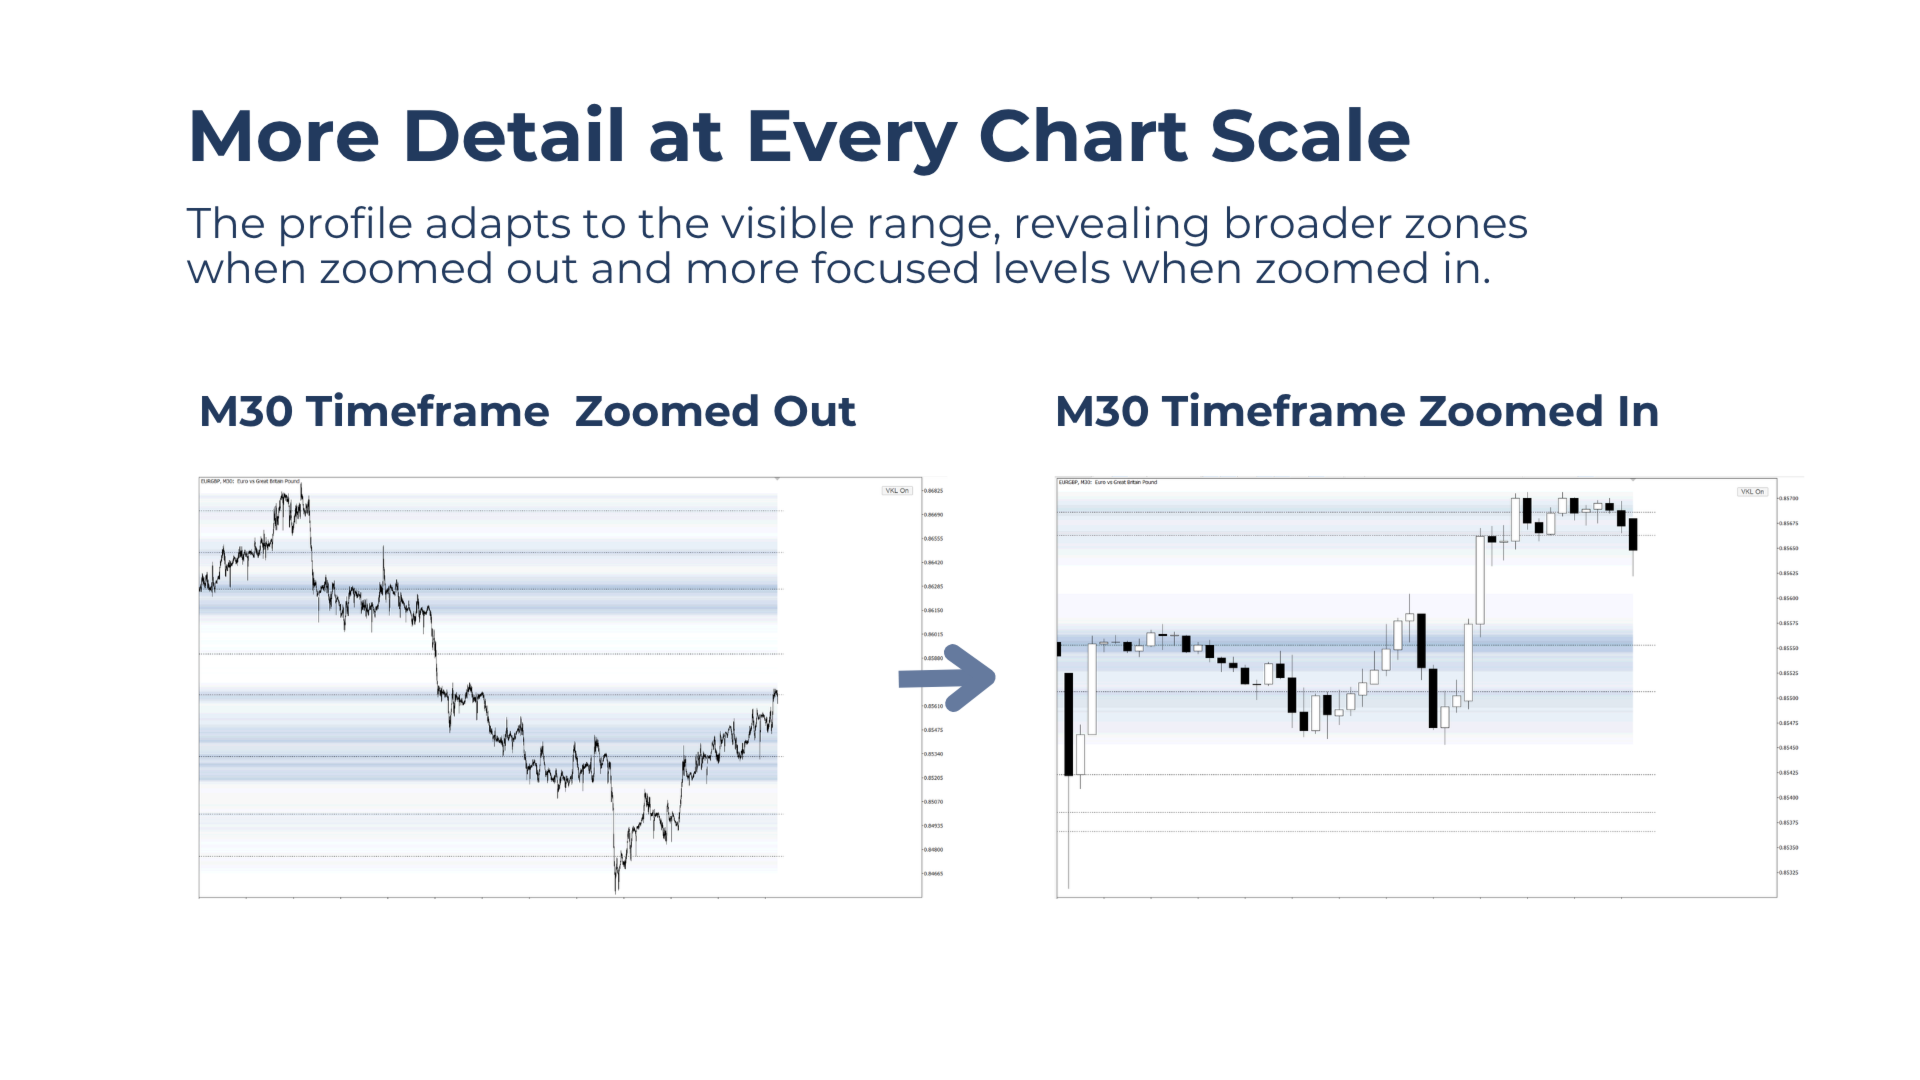
The profile adapts to the visible chart range. Zooming in creates a more focused view and can reveal more sensitive local levels.
Lightweight Performance
Zones and key levels update once per new candle, helping to keep CPU usage low.
Main features
Customizable Zone Colors
Select separate zone colors for light and dark chart backgrounds to maintain clear visibility and match the preferred chart style.
Works Across Symbols and Timeframes
Compatible with any Market Watch symbol and any standard chart timeframe.
Flexible One-Button Control
Position the control button in any chart corner for quick access without adding unnecessary panel clutter.
Strategy Tester Compatible
The tool can be tested directly in the Strategy Tester. The Every Tick model is recommended for the most reliable visual results.
Notes & Tips:
For the strongest contrast, use darker zone colors on light chart backgrounds and lighter zone colors on dark chart backgrounds.