Volume Zone Overlay MT4

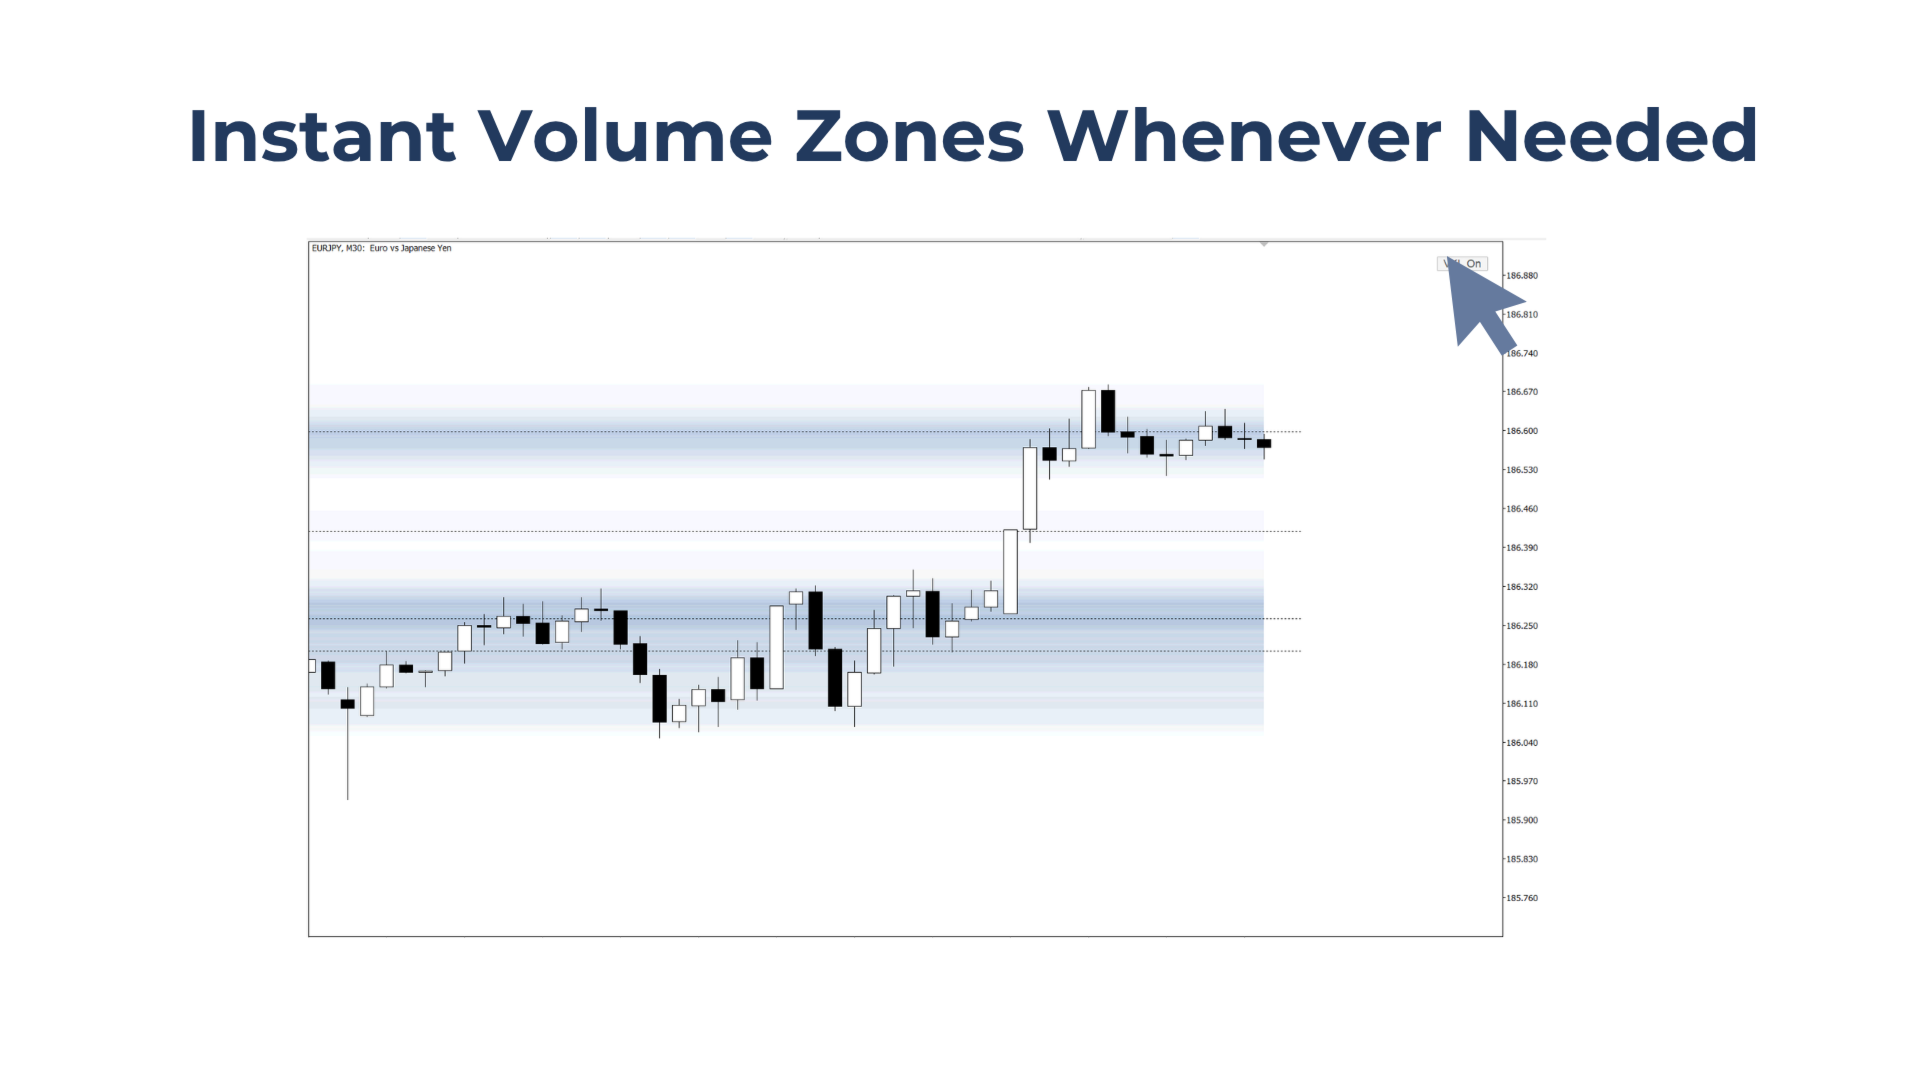
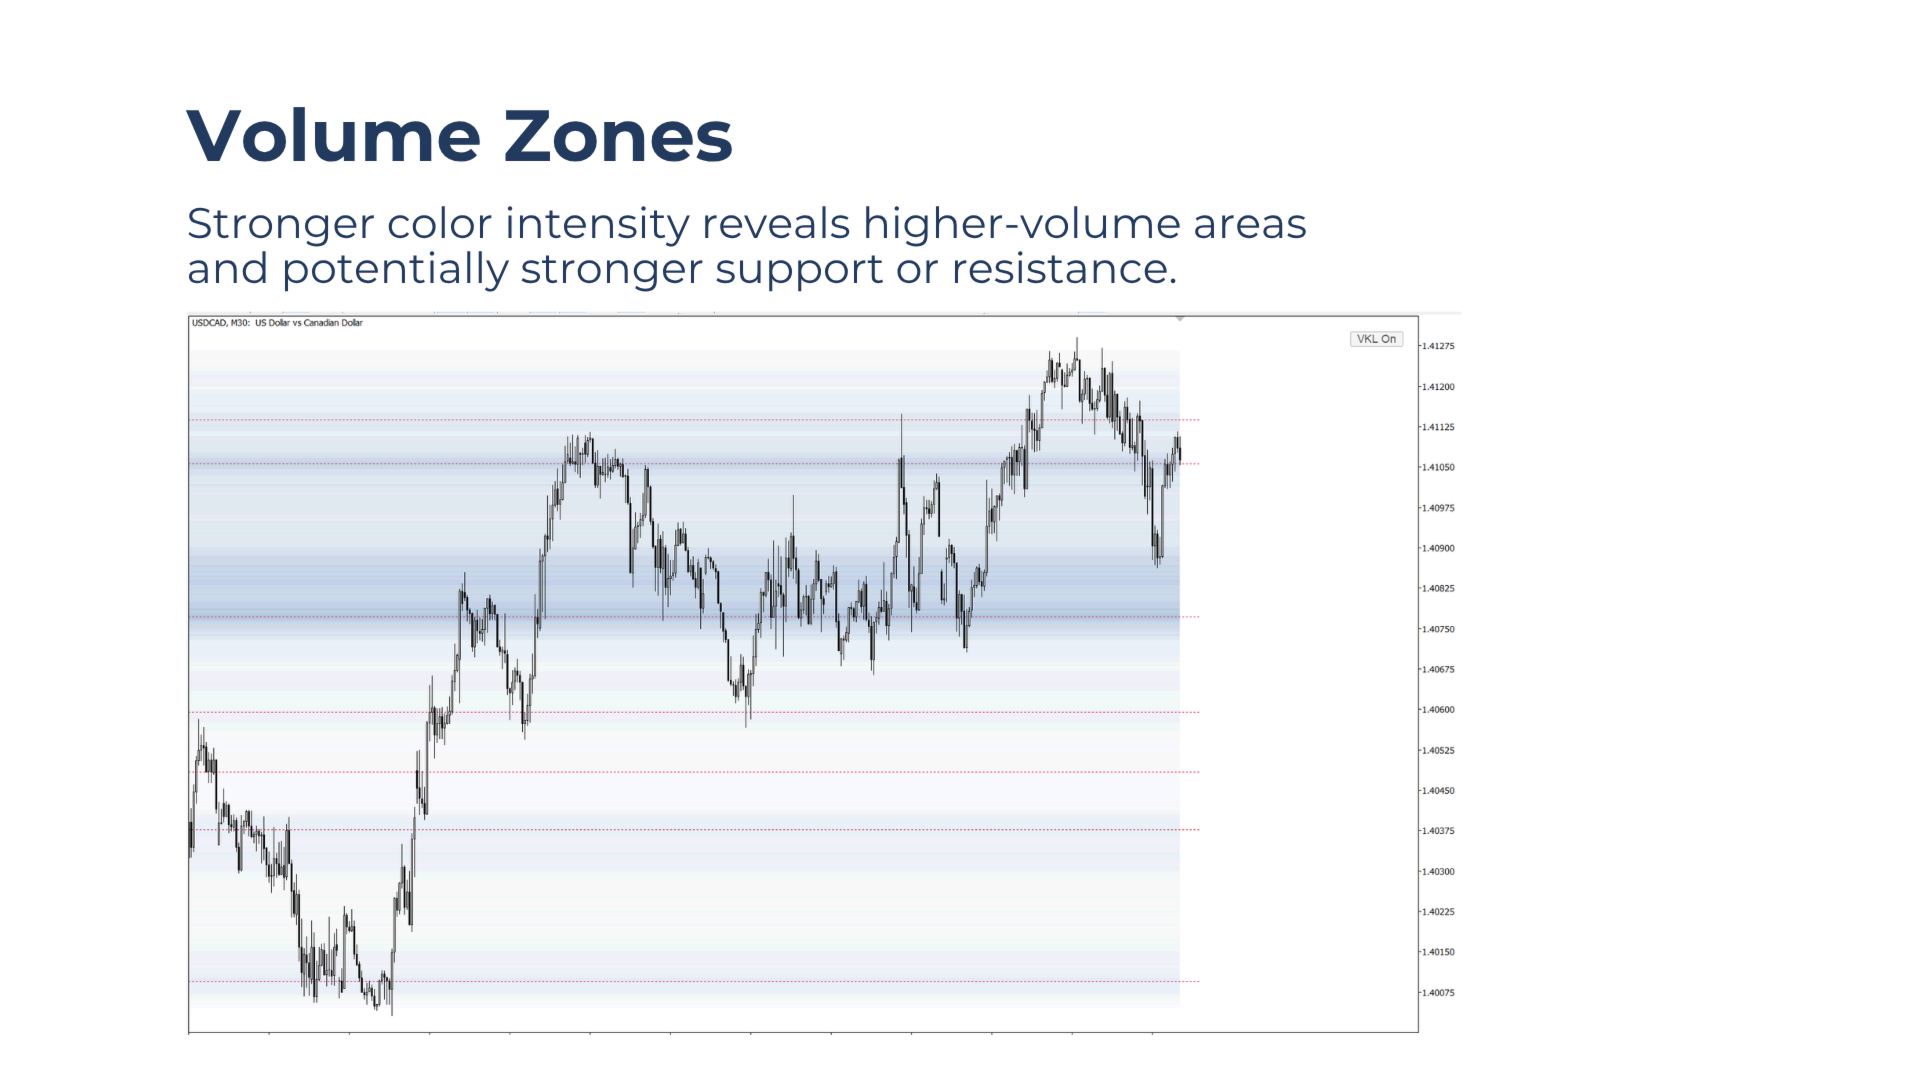
With Volume Zone Overlay, users can instantly reveal volume-based support and resistance zones where price may react. Darker colors represent higher trading volume and potentially stronger support or resistance.

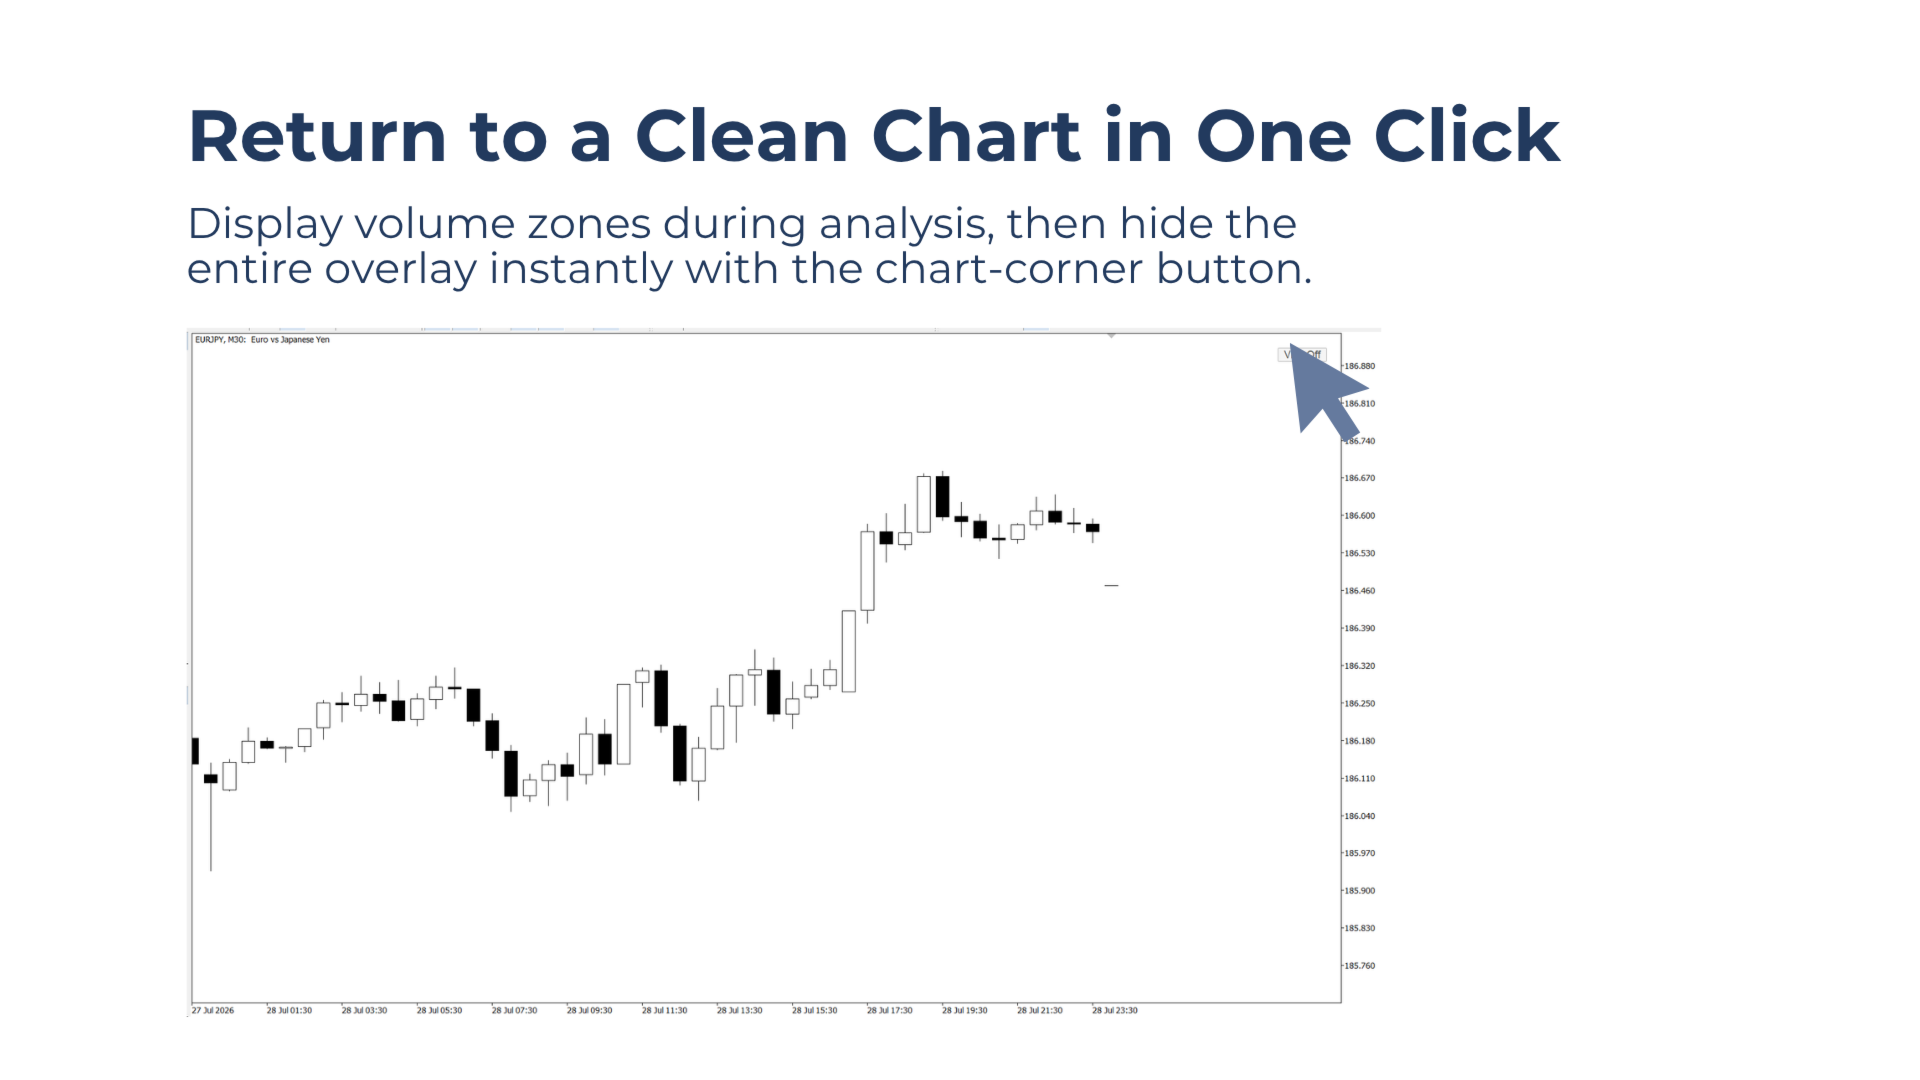
The chart-corner button shows or hides the overlay instantly, keeping the chart clear whenever the volume zones are not needed.

Download the demo and test Volume Zone Overlay directly in the Strategy Tester.


Built For Traders Who Want To:

  • Use volume-based support and resistance zones to plan entries, stop-loss areas, and targets.
  • Identify areas where price may react from the market's volume footprint.
  • Keep charts clean by displaying volume zones only when required.
  • Add volume context without relying on a permanently visible profile.


Key benefits

Volume Levels on Demand
Show the heatmap when analysing the market, then hide all zones and levels instantly with one button click.

Spot Important Volume Areas Quickly
Higher-volume areas appear with stronger colour intensity, making potentially important support and resistance zones easier to recognise.

Highlight Key Levels Within the Profile
Local volume peaks are marked as key levels, including important concentrations located within both broad and narrow volume zones.

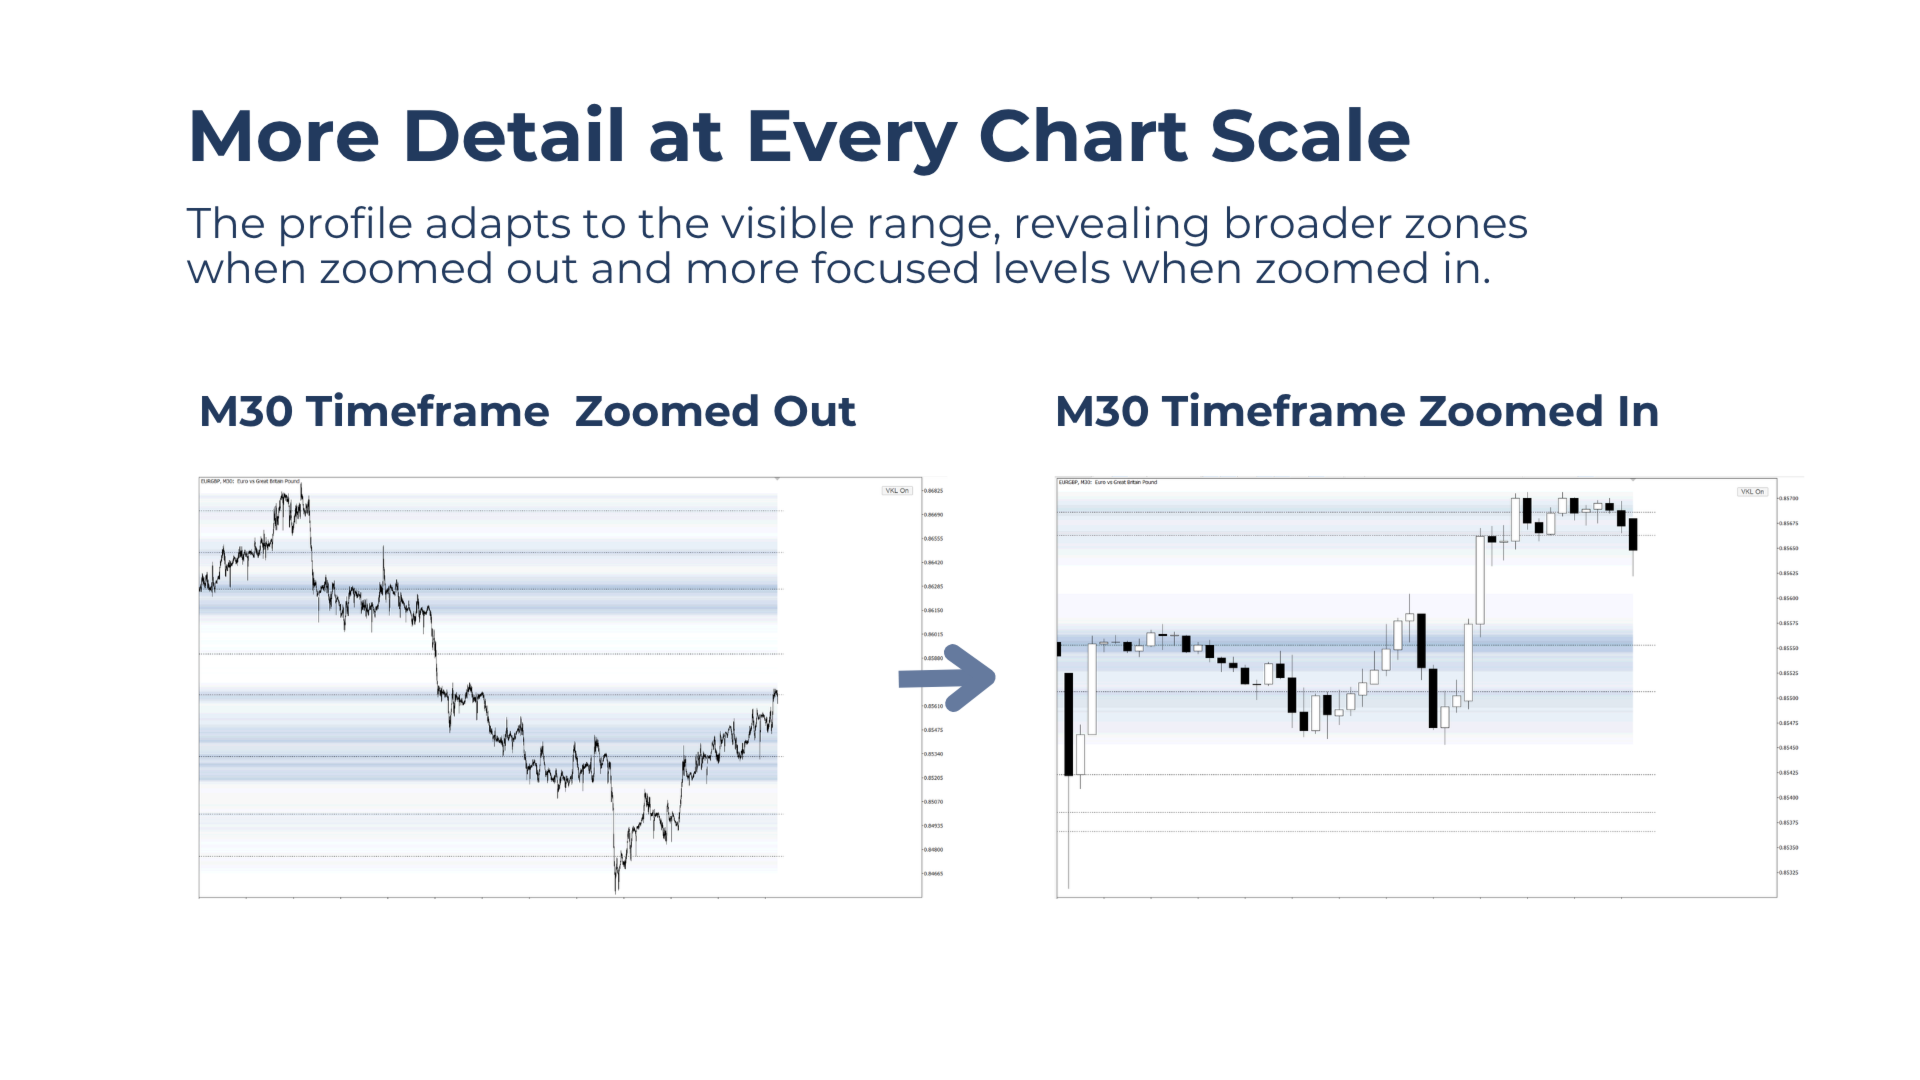
More Detail When Zooming In
The profile adapts to the visible chart range. Zooming in creates a more focused view and can reveal more sensitive local levels.

Lightweight Performance
Zones and key levels update once per new candle, helping to keep CPU usage low.


Main features

Customizable Zone Colors
Select separate zone colors for light and dark chart backgrounds to maintain clear visibility and match the preferred chart style.

Works Across Symbols and Timeframes
Compatible with any Market Watch symbol and any standard chart timeframe.

Flexible One-Button Control
Position the control button in any chart corner for quick access without adding unnecessary panel clutter.

Strategy Tester Compatible
The tool can be tested directly in the Strategy Tester. The Every Tick model is recommended for the most reliable visual results.


Notes & Tips:

For the strongest contrast, use darker zone colors on light chart backgrounds and lighter zone colors on dark chart backgrounds.
作者のその他のプロダクト
Place Fibonacci Retracements in Seconds—with Wick-to-Wick Precision. Drag Fib makes Fibonacci placement faster, cleaner, and more precise. One simple vertical drag places a retracement from wick to wick across the selected trend leg. As the move extends, the Fibonacci structure adjusts automatically. Saved placements remain anchored across timeframe changes and are stored separately for each symbol. Faster placement. Greater precision. Less repetitive chart work. Built for Traders Who Want To
Auto Fibonacci displays the 38.2, 61.8, and 78.6 Fib levels directly on the chart, helping traders who use these key retracement zones consistently for trade planning or confluence. Drawing Fibonacci levels manually over and over again can take time, especially when done with wick-to-wick precision. Auto Fibonacci removes that friction by detecting the latest trend leg and placing the main Fibonacci levels automatically. Key Benefits Shows only the major Fibonacci levels to keep the chart clean
FREE
Wait for clean candle-close break confirmations without staring at the chart. Bar Break Alerter monitors selected long-side or short-side break confirmations directly from the chart. Activate the alert at a planned setup area, step away from the screen, and get notified when the chosen break signal appears. No constant chart watching. No early FOMO entries before confirmation. Only clean break alerts when the selected condition is actually triggered. Built for Traders Who Want To: Wait for can
The MT4 Sessions Indicator highlights trading sessions directly on the chart using colored candles. It helps traders quickly identify which price action occurred during specific market sessions or times of day. The indicator is especially useful for volume profile, supply and demand, and other level-based traders, where the timing of a move can be as important as the price level itself. By visually separating trading sessions, it becomes easier to identify patterns, compare session behavior, an
FREE
The Draggable Candle Timer is a clean, minimal countdown to the next candle close. Fully customizable and freely draggable, it can be positioned anywhere on the chart without interfering with trading or analysis. The timer uses the system clock, helping avoid the delays and irregular updates that can occur with candle timers based on the Market Watch clock. To reposition the timer, drag it using the upper-left anchor point. Key Features Smooth, accurate system-time-based countdown Adjustable p
FREE
Find potential stop-run zones and get alerted when price gets there. Bank Levels Tracker highlights potential liquidity levels near prominent swing highs and lows, where retail stop-loss orders may be clustered. These levels can develop into important stop-run areas, often monitored by Smart Money Concepts traders for potential liquidity grabs, fakeouts, and reversal setups. Instead of repeatedly marking the same highs and lows by hand, Bank Levels Tracker plots these levels in advance and sends
Wait for clean candle-close break confirmations without staring at the chart. Bar Break Alerter monitors selected long-side or short-side break confirmations directly from the chart. Activate the alert at a planned setup area, step away from the screen, and get notified when the chosen break signal appears. No constant chart watching. No early FOMO entries before confirmation. Only clean break alerts when the selected condition is actually triggered. Built for Traders Who Want To: Wait for can
Draw Quick Easy & Precise Wick-to-Wick Pitchforks with One Line and Two Quick Drags. Drag Pitchfork turns accurate pitchfork placement into a fast, repeatable workflow. One vertical drag line is moved twice to define the structure, while the remaining anchor is selected automatically according to standard pitchfork rules. Switch instantly between Andrews, Schiff, and Modified Schiff variations without repeatedly rebuilding the pitchfork by hand. Download the demo and test Drag Pitchfork free i
Find potential stop-run zones before price gets there. Bank Levels Tracker highlights potential liquidity levels around obvious swing highs and lows, where retail stop losses may cluster. These areas can become important stop-run zones, often watched by Smart Money Concepts traders for possible liquidity grabs, fakeouts, and reversal setups. Instead of manually marking the same highs and lows over and over again, Bank Levels Tracker plots the levels in advance and sends an instant alert when pr
Drag Fib
Part-time Day Trader
Place Fibonacci Retracements in Seconds—with Wick-to-Wick Precision. Drag Fib makes Fibonacci placement faster, cleaner, and more precise. One simple vertical drag places a retracement from wick to wick across the selected trend leg. As the move extends, the Fibonacci structure adjusts automatically. Saved placements remain anchored across timeframe changes and are stored separately for each symbol. Faster placement. Greater precision. Less repetitive chart work. Built for Traders Who Want To
With Volume Zone Overlay, users can instantly reveal volume-based support and resistance zones where price may react.  Darker colors represent higher trading volume and potentially stronger support or resistance. The chart-corner button shows or hides the overlay instantly, keeping the chart clear whenever the volume zones are not needed. Download the demo and test Volume Zone Overlay directly in the Strategy Tester. Built For Traders Who Want To: Use volume-based support and resistance zones
フィルタ:
レビューなし
レビューに返信