Tick and Range Bars Generator
49 USD
Download demo:
55
Publicado:
18 março 2025
Versão atual:
1.0
Não encontrou o robô certo? Encomende um para você
no serviço Freelance.
Ir para o Freelance
no serviço Freelance.
Como comprar um robô de negociação ou indicador?
Execute seu EA na
hospedagem virtual
hospedagem virtual
Teste indicadores/robôs de negociação antes de comprá-los
Quer ganhar dinheiro no Mercado?
Como apresentar um produto para o consumidor final?
Você está perdendo oportunidades de negociação:
- Aplicativos de negociação gratuitos
- 8 000+ sinais para cópia
- Notícias econômicas para análise dos mercados financeiros
Registro
Login
Você concorda com a política do site e com os termos de uso
Se você não tem uma conta, por favor registre-se
https://youtu.be/xpa-X8vaz7I
Here is the video evidence showing how the utility works just as described and doesn't have a single bug. It completely counters the reviewer's allegation, which is a lie and or 100% user error if he can't get it to work:
https://youtu.be/xpa-X8vaz7I
I have to use 3200 range for getting a 100 range candles similar to other platforms.
Another problem is that I clicked multiple times on the utility to have it opened, but nothing happened
I have to use 3200 range for getting a 100 range candles similar to other platforms.
Another problem is that I clicked multiple times on the utility to have it opened, but nothing happened
The range is based in metatrader points, 10 points in is 1 pip. If you want a 10 pip bar you need to set it at 100 points, for example. But this would be a setting for regular forex pair. You have to measure in your chart the size in points of how you big you want your candles.
I have no idea what a 3200 range is in your broker and, on top of that, the historical range is set in the utility's setting, it's described in the product page how much history you can get per mode (tick or range). Has nothing to do with the size you use.
Range mode uses tick history data - it will go as far back in time as the tick history you got
Tick mode uses 1min history data - it will go as far back in time as your 1min data
You are not supposed to keep clicking on the utility to launch it, just drag and drop on the chart you want.
After playing with it, I was able to match the exact candle size from other platforms. I will change my review, since your utility indeed works as described, however I suggest you give more details about how to use it.
After playing with it, I was able to match the exact candle size from other platforms. I will change my review, since your utility indeed works as described, however I suggest you give more details about how to use it.
Ok great, I am glad you sorted it out.
Now just let me tell about some common sense tips when having issues with custom charts in metatrader:
-If the chart stops working or fails to load (doesn't show anything, or weird bars etc..) almost always it's data corruption in the custom chart. If you keep trying to generate a chart with the same custom name it won't work, you have to delete the custom chart at the symbols window.
1st you hide the symbol in the market watch tab (otherwise it will not allow you to delete the symbol)
2nd - you go to "symbols" then "custom" and there you right click and delete the problematic custom symbol.
Done, now you can generate a fresh one using the same name you used before.
And as explained in the product page, there is a high chance of having a looping problem if, after you already generated a fresh chart, you go in the utility's setting and change the tick or range size without changing the starting date. If you have to choose a different starting date (a day after, or a day before, whatever), just don't use the same starting date or you might have this data looping problem and then you will have to remove utility, load again and do the steps above to delete a corrupted custom chart.
Just one more tip when using this utility, leave the option to focus on the live candle ticked "on", this one here:
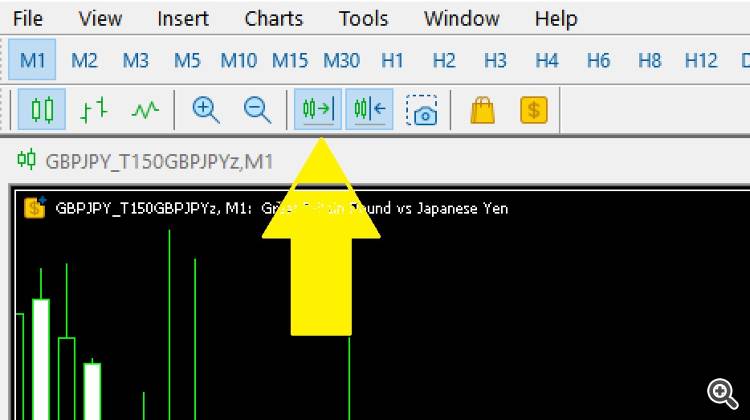
This is only needed when the market is live and new candles are forming, otherwise some "jumps" might happen when a new custom candle is printed (the chart will slide back, for example). That's a MT5 issue or quirk, nothing to do with the utility. If the market is closed, or you generated a chart and made it offline for historical study (removed the utility from the source chart), then you don't need to worry about it.