Conheça o Mercado MQL5 no YouTube, assista aos vídeos tutoriais
Como comprar um robô de negociação ou indicador?
Execute seu EA na
hospedagem virtual
hospedagem virtual
Teste indicadores/robôs de negociação antes de comprá-los
Quer ganhar dinheiro no Mercado?
Como apresentar um produto para o consumidor final?
Novos Expert Advisors e Indicadores para MetaTrader 5 - 135

The EA has the same trading principle as SMARTHEDGE . We trade simultaneously on drum instruments with high correlation. Transactions made on one instrument compensate for the drawdown of transactions on the other instrument. Thus, we can trade fairly large volumes with relatively low risk. The principle of operation is clearly visible in the video below.
In this expert Advisor, I tried to simplify the settings as much as possible, but left all the main functions from the early development.

Excellent Multiplatform Copier of deals. I use it regularly on VPS (copy from Mt5 to Mt4).
Multiplatform : copying from MetaTrader 4 to MetaTrader 4; copying from MetaTrader 4 to MetaTrader 5; copying from MetaTrader 5 to MetaTrader 4; copying from MetaTrader 5 to MetaTrader 5.
Modes: master - the current terminal is source of trades (deals are copied from it); slave - the current terminal is the receiver of trades (trades are copied to it). from myself - mode "deals multiplier" (use
Fast Trading is an intuitively handy panel for manual trading. With Fast Trading you can quickly: 1. Set pending orders. 2. Place market positions and manage them. 3. Turn on voice notifications for basic actions. Parameters
Base FontSize — size of the font in the application. Caption Color — caption color of window. Back color — background color. Interface language — must be English or Russian. Magic Number — need for market positions and pending orders. Use Voice Notify — Action noti

Great dashboard for market analytics. The panel helps to analyze the values of the Envelopes indicator and prices.
Using this panel you can: watch the current signal from Envelopes for all time frames; watch the current signal from Envelopes by different symbols; look at how far Envelopes is from the price; look at how much the value of Envelopes has changed; several types of signals for analytics.
Values in the table cell: Envelopes value upper line; Envelopes value lower line;
"the

Introduction to Fibonacci Volatility Indicator Volatility indicator can help you to detect any statistical advantage for your trading. Especially, if you are trading with Price Action and Price Patterns, then we recommend to use the Volatility indicator together with your strategy. Especically, Fibonacci Volatility indicator combines the market volatiltiy with Fibonacci Analysis to provide you more advanced volatiltiy indicator. Main Features Fibonacci Volatility in Z score Configuration Mode Fi
The utility allows you to build different types of graphs: Seconds chart from 1 second to 86400 seconds Tick chart from 1 tick and above The volume chart Delta chart Renko chart Range chart Product demo https://www.mql5.com/ru/channels/clustersecondforex Built-in indicators for volumetric analysis: daily market profile and market profile of the selected timeframe, Cluster Search Imbalance VWAP Dynamic POC, VAH, VAL the profile depth of the market vertical volume with various display options, del

HUBBLE it is a Secure Automated Software for trade Forex market and indices.
The architecture is a Fully Automatic Autonomous Robot Expert capable of
Independently analyzing the market and making trading decisions
HUBBLE It is an advanced trading system. This is a fully automatic Expert Advisor.
HUBBLE It is a 100% automatic system, The system is self-sufficient, performing all the work. Is a revolution in the customization of the trading. You can download the demo and te
CAP Zone Recovery Strategy Builder EA MT5 is a another version of our Main Product CAP Zone Recovery EA. This EA is a strategy builder type EA has more then 34+ build in indicator that you can make more then 1 million combination strategy that boost you trading strategy. Also this Builder offers an incredible amount of functionality with zone recovery strategy. So you can test your strategy easy way without knowledge of coding. [ Installation Guide | Update Guide | Submit Your Problem

The intention of the dashboard is to provide a quick overview of the daily, weekly and monthly range of configured assets. In "single asset mode" the dashboard shows you possible reversal points directly in the chart, thus making statistics directly tradable. If a configured threshold is exceeded, the dashboard can send a screen alert, a notification (to the mobile MT5) or an email. There are various ways of using this information. One approach is that an asset that has completed nearly 100% o

BeST_Keltner Channels Strategies MT5 is an MT5 Indicator based on the original Keltner Channels Indicator and it can display in the Chart all the known Variations of Keltner Channels and also the corresponding 10 totally Strategies. Every such generally consists of a Central Moving Average Line and two Boundary Bands at a distance above and below it and can be traded mainly in a Trending Mode but also in a Ranging ReEntry Mode.
BeST_Keltner Channels Strategies Indicator Draws definite Bu

Genesis Robot.
The robot analyzes atypical conditions in the market using optimization algorithms and indicators.
The robot doesn´t use Martingala.
Parameters
The robot only has one configurable parameter. Thus, It is a very easy robot to use
size_lot: This is the lot size of the open positions.
Recommendations for use.
Recomendations for use. The robot is optimized for the Forex market. It is not recommended to use in other markets.
The robot opens few positions pe

If you like to use traditional Moving Averages (like SMAs and EMAs) to provide your trades for dynamic levels of Support and Resistance, you will love the Adaptive Moving Average (AMA). Created in 1995 by Perry Kaufman and presented to the world in his book " Smarter Trading : Improving Performance in Changing Markets ", the Adaptive Moving Average (also known as KAMA - Kaufman Adaptive Moving Average) has the goal to be the perfect companion for following a trend without noise, but s
FREE

Indicador com 3 funcionalidades - Relógio : Relógio independente do gráfico, não para a contagem mesmo com o mercado fechado. - Template : Após definir uma configuração em qualquer gráfico, seja padrões de cores, indicadores, zoom... A configuração será copiada para todos os gráficos ativos. - TimeFrame : Defina o TimeFrame em um gráfico, e com apenas um clique todos os gráficos ativos serão alterados para o mesmo TimeFrame.

Qstick is a way to objectively quantify candlestick analysis and improve the interpretation of candlestick patterns. Qstick was developed by Tushar Chande and published in his book " The New Technical Trader - Boost Your Profit by Plugging Into the Latest Indicators (1994) ". Qstick is built based on a moving average of the difference between the Open and Close prices. The basis of the idea is that the Opening and Closing prices are the heart of candlestick analysis. We strongly recommend the re
FREE

Script to create arrows and lines on chart of history positions traded on account for the symbol where you launch the application. From inputs you can select: - Magic number (default is -1; -1 = all magics number) - "From" date and time (default is 1970.01.01 00:00; all positions) - "To" date and time (default is 1970.01.01 00:00; all positions) - Color for buy open positions (arrows and lines between open and close) - Color for buy closing positions (arrows) - Color for sell open positions
FREE

Utility for show on charts the visual informations about:
- a vertical line at start of each bar of selected timeframe
- a vertical line at start of each day
- a vertical line at start of each week
- vertical lines at start / end of trading sessions selected
- bid / ask prices, spread, money value for each point (of 1 standard lot) and last tick time recived"
You can enable / disable each information and set the color for each line
FREE

This indicator is an utility for have always under control, how much time is left at the end of the bar setted.
The utility show on the lower right of the chart, the countdown to the end.
When the remaining seconds is = to the seconds set in the input, the color of remaining seconds on chart, change color and play a warning sound to warn you that the bar is about the end. When the remaining seconds is < to the seconds set in the input, the utility play a beep to warn you that the bar is in
FREE

The Buffer Reader will help you to check and export the custom indicators buffers data for your current chart and timeframe. You can select the number of buffer and historical bars to read/export. The data can be exported in a CSV format and the files will be stored in the folder: \MQL5\Files .
How it works Put the number of buffers to read in the Buffers_Total input parameter. Put the number of rows to display in the Rows_Total. Choose the CSV separator in the parameter. Copy the correct na
FREE

Utility for know all informations and settings of all symbols available on your broker The informations that you can know are for example:
- Spread
- Digits
- Tick value
- Size step
- Size minimum
- Size maximum
- Swap buy and sell
- Margin required (for 1 standard lot)
- Rollover day
- Execution mode
and many other informations You can filter the symbols by group or you can also choose to see the informations only of symbols available on market watch.
FREE

Utility for know all informations and settings of account where the platform is connected The informations that you can know are for example:
- The difference from server time and time of your PC
- The limit orders that you can place at market
- The credit that you have
- The stopout mode of your broker
- The exact name of company of your broker
and other informations
FREE

Utility for know all informations and settings of terminal where the utility is loaded. The informations that you can know are for example:
- The path of folder where the terminal start
- The path of folder where the terminal store the indicators, experts advisors etc
- The path of common folder
- The permission to use DLL, to automated trading etc
- The permission to send email, FTP or notifications to smartphone
and many other informations
FREE

Script to calculate equity and balance at a specific date and time.
This script makes up for a lack of MetaTrader account history, that does not show how the balance and equity changes in time.
Balance calculation includes closed orders only.
Equity calculation includes orders closed before and orders that are still open at the specified time.
Example: date and time set to 2020/07/06 00:00. If I had a Buy 1 lot EURUSD position opened at price 1.12470 on the 2020/07/02, the program woul
FREE

Script to load on chart the orders, starting from "Signal history report" downloaded from MQL5. If you found a good signal on "Signals" section of this site and you want to see the history orders on chart, you can do it, following this steps: - Download the csv file of history orders - Copy file in the common folder - Launch the script and set the input that are: - Report type (MT4 or MT5) - File name - Delimiter (default is ;) - Name of symbol to load (if symbol on file is for example EURUSDi,
FREE

Description :
Combination EA MT5 is a simple Expert Advisor based on Combination MT5 custom Indicator. The Indicator is incorporated in the EA, therefore you don't need it as a separate tool for the EA to operate. Combination MT5 custom Indicator is based on Stochastic Oscillator and Average True Range (ATR), both are set to their default values. If you wish, you can download Combination MT5 custom Indicator for free from my product page .
The Expert Advisor settings are as follows :
Ma
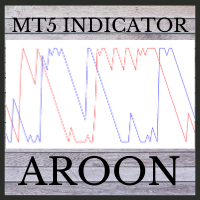
This indicator is powerful for detecting the trend.
The crossing between to line is the entry signal. Buffer 0 is UP line. Buffer 1 is DOWN line. Note: 1. Aroon is great tool for trending detecting. Please try to select the best period for each instrument.
Input AroonPeriod =14- Aroon period
MailAlert =false- Send email when entry signals appeared.
SoundAlert =false- Notify on MT5 platform.

Utility for know the performance of your acoount.
From dialog you can filter data in this modes:
- You can include or not include the open positions - You can include or not the closed positions - You can filter the data by date (from, to) - You can filter the data by simbols (multi selection) - You can filter the data by magic number (multi selection)
On bottom of table, are show the total of:
- Number of data - Total size - Total commissions paid - Total swap paids - Total profits - T

Индикатор построен на основе индикаторов VIX и RSI. Комбинация двух указанных индикаторов позволяет обнаруживать зоны крайней перепроданности, где цена с большой долей вероятности изменит направление. Наиболее сильные сигналы дает в периоды слабого тренда. Сигналом индикатора является изменение направления гистограммы (с роста на снижение) выше заданного (сигнального) уровня.
В индикаторе задан широкий спектр параметров, который позволяет оптимизировать индикатор для торговли любыми активами:

O foco principal no desenvolvimento deste EA foi a segurança, eliminando o risco de uma grande falha que normalmente está associada à maioria dos sistemas de rede do mercado. O resultado final é um desempenho muito melhor do que qualquer outro sistema semelhante. Monitoramento ao vivo (sinal) Meus sinais são definidos para alto risco em contas padrão (não ECN), onde os spreads são geralmente altos. Esta é a minha maneira de testar a EA. Minha recomendação para você será sempre as configurações

Currency Strength Meter is the easiest way to identify strong and weak currencies. The indicator shows the relative strength of 8 major currencies: AUD, CAD, CHF, EUR, GBP, JPY, NZD, USD.
By default the strength value is normalised to the range from 0 to 100 for RSI algorithm: The value above 60 means strong currency; The value below 40 means weak currency;
The indicator is created and optimized for using it externally at an Expert Advisors or as a Custom Indicator inside your programs.

Create and trade timeframes in seconds. The bar time duration is freely adjustable from 1 second and up. The chart is accurately constructed using real ticks from the broker's server. Main characteristics The indicator is an overlay on the main chart, making it possible to utilize one-click trading and on-chart order manipulation. History calculated using real tick data. Built-in technical studies: 4 moving averages (Simple, Exponential, Smooth, Linear-weighted, Volume-weighted using tick or rea
Bom dia. PortfolioHedgingStopOrderOneSymbol - tendência conselheiro, para abertura de ordens do meio do canal na terceira onda de Elliot, funciona no nível de desagregação, do usuário indicador de largura de banda (TMA, fixa S/L e T/P. Conselheiro desenvolvido para determinar o ponto ideal de entrada no mercado após a correção, se você ver a confirmação de um forte movimento de tendência, mas você é um novato e ainda estiver em dúvida sobre a regularidade de suas ações, é sempre melhor esperar

Renko é um gráfico atemporal, ou seja, não leva em consideração o período de tempo, mas a variação de preço, o que torna a variação de preço no gráfico mais clara. Hyper Renko é o indicador que fornece isso. Para configurar, você tem apenas um parâmetro, o tamanho da vela no tick * que deseja usar. * tick: é a menor variação possível de um ativo. Obrigado por escolher um indicador do Hyper Trader. Wikipedia: Um gráfico renko indica variação mínima no valor de uma variável - por exemplo o preço d
FREE

O indicador rastreia a tendência em 5 tempos gráficos diferentes do mesmo ativo, tendo como base 6 sinais par cada tempo gráfico.
O indicador tem como principal objetivo, nos mostrar a tendência majoritária do ativo financeiro em que ele foi colocado. O sistema passa as informações das tendências em diversos tempos gráficos, dessa forma o usuário consegue ter uma visão ampla do movimento do ativo, este tipo de ferramenta faz com que o usuário tenha uma maior taxa de acerto pelo fato de auxili

Este indicador reconhece um tipo especial de formação de barra interna que é formada por uma grande vela Mestre seguida por 4 velas menores (consulte a explicação da estratégia abaixo). Recursos Representa as linhas de stop de compra / venda no gráfico, bem como os níveis de take profit e stop loss. Os níveis de TP / SL são baseados no indicador Average True Range (ATR). As cores dos objetos são mutáveis. Envia um alerta em tempo real quando uma formação de vela mestre é identificada - som / pop

O indicador Hyper Force, originalmente criado em 1984 pelo David Weis, indica em formato de ondas a força da tendência de um symbol. Quanto Maior a onda, maior é a força da tendência. Ondas pequenas quer dizer tendência fraca ou mercado sem tendência. Em uma onda, quanto maio a diferença entre uma barra e outra, mais forte é a tendência. Quando a distância entre uma barra e outra começa a diminuir, quer dizer que a onda começou a perder a força de tendência. Portanto pegar a onda com a força for
FREE

Representação do valor de interceptação da regressão linear e o desvio médio absoluto simétrico ao valor de interceptação.
PARÂMETROS
• Periods: número de períodos para calcular a regressão linear
• Amplitude: multiplicador do desvio médio absoluto para definir as bandas
• Displacement: deslocamento no eixo horizontal
• AppliedPrice: preço em que os cálculos são feitos
• MainPlot: exibição do gráfico principal
• UpperPlot: exibição da banda superior
• Lower
Representação do valor da inclinação da regressão linear. Possui um gráfico de referência para determinar visualmente as alterações no valor da inclinação (aceleração / desaceleração do preço).
PARÂMETROS
• Períodos: número de períodos para calcular a regressão linear
• PeriodsReference: número de períodos para o cálculo da média móvel nos valores do gráfico principal
• Displacement: deslocamento no eixo horizontal
• AppliedPrice: preço em que os cálculos são feitos

Great smart dashboard for market analytics.
Using this dashboard you can: find signals from different indicators from all timeframes ; find signals from the Moving Average from all symbols ;
Include: 9 indicators (10 in Mt5 version); 27 signals (29 in Mt5 version); "Total" page.
Indicators and signals: MOVING AVERAGE MA cross Price - MA crosses Price; MA more/less Price - MA higher/lower Price; BOLLINGER BANDS BB crosses Price (in) - Price crosses Bollinger (upper/lower line

The Metatrader 5 has a hidden jewel called Chart Object, mostly unknown to the common users and hidden in a sub-menu within the platform. Called Mini Chart, this object is a miniature instance of a big/normal chart that could be added/attached to any normal chart, this way the Mini Chart will be bound to the main Chart in a very minimalist way saving a precious amount of real state on your screen. If you don't know the Mini Chart, give it a try - see the video and screenshots below. This is a gr

O indicador Mercadulls Trade fornece vários tipos de sinal, detectando suportes e resistências, acumulação/distribuição. O indicador varre constantemente o gráfico para análise de direção e surgimento de longas tendências. Características principais Não Repinta! Parar perda e tomar níveis de lucro fornecidos pelo indicador. Adequado para Day Traders, Swing Traders e Scalpers. Algoritmo otimizado para aumentar a precisão dos sinais. Indicador para análise técnica para todos os ativos disponível
Conversion of ".set" files created in the MT5 terminal for use in the MT4 terminal. The script is great for cross platform experts.
How to work: place the source files ".set" in the local terminal folder\MQL5\Files run the script the ".set" files for the MT4 terminal appeared in the local terminal folder (the end of the file name "* -MT4.set")
Created on MT5 build 1755 from 18/01/18 Please leave your feedback after using.
FREE

Thread indicator is calculating possible values for the upcoming periods. It is built by author’s system, with ability to learn. Input data ( recommended interval ): Sensitivity to oscillatory motion (integer value, 0 - 8) increase of value shifts priority of calculation towards high-frequency vibrations (increase loads the system) Shift of diagram (integer value, 0 - 8) shifts output of indicator to the right Diagram forecast (integer value, maximum 10) defies the number of periods calculated
FREE

The best time to trade Using this Indicator is when the time reach exactly hour,half,45 minutes,15 minutes and sometimes 5 minutes..
This indicators is helpful to those who trade boom and crash indecies.How to read this indicator first you'll see Blue allow and Red allow all these allows used to indicate or to detect the spike which will happen so the allow happens soon before the spike happen.This indicator works properly only in boom and crash trading thing which you have to consider when

Indicador Dragon SuperTrend OB
O Dragão foi um indicador desenvolvido para captar um novo inicio de tendência, ele é excelente em Opções Binárias e em Forex e até na B3 no Mini Índice e Mini Dolar.
Ele possui 4 niveis de tendência em 4 Times Frames diferentes, para você ter a certeza de que você está do lado certo da
tendência!
Ele é bem simples e fácil de usar, no final eu explico como vamos operar com o
indicador!
Modos de confirmações Confirmações da Tendência da Primeira Linh
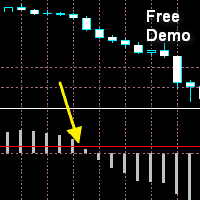
The moment when the MACD line crosses the signal line often leads to a significant price movement and trend changes. MACD Cross Prediction is an indicator that uses OSMA(MACD oscillator) and a red line. You can change the level of the red line on the indicator setting popup(and the red line moves up and down). The alerts(email, mobile push, sound, MT5 alert) will be sent when the MACD histogram touches the red line, which means the alerts can be sent just before/around the time when the MACD lin
FREE

An algorithm to detect a spike instantly with zero lag.. Use default settings for "Crash And Boom" This smart algorithm detects a spike, which can be use to filter out market spikes, give entry signals with exit. Trading:- Booming for Boom and Crashing for Crash
Spike Signal:- The less you decrease the more signals
Multiplier:- This multiplies the Signal
Time Ratio:- For adjusting the Signal
AlertProperties = "====== Alert Properties ======";
SendAlertViaAlertWindow:- if set to true it wil
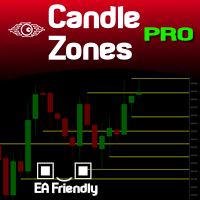
You probably heard about Candlesticks behaviors, which in most of the times could denote and trace Volume behaviors even if you are not watching Volume itself... Well, this indicator will do this. Naked traders love to rely solely on candlesticks patterns and with Candle Zones you can trap special patterns and DRAW THEM on your chart. As simple as that. There are several filters you can tweak in order to achieve the analysis you want. Just give it a try. After several months of testing, we think
AKT for MT5 (Traders Club)
機能: MAゴールデンクロスで買いサイン、デットクロスで売りサインを表示します。 MAの期間は短期足と長期足を入力できます。 MAの種類を選択できます。(SMA、EMA、SMMA、LWMA) 適用する価格を選べます。(CLOSE,OPEN,LOW,HIGH,MEDIAN,TYPICAL,WEIGHTED) サインをアラートで通知します。 サイン発生をE-mailやSNSで通知します。 表示するサインを変更することが出来ます。
サインの色を変更することが出来ます。
サインの表示された時間と価格が表示されます。
※価格は終値になります。
Indicator Noを変えることによるこのインジケータを複数適用することができます。
これにより違う MAの期間による ゴールデンクロスと デットクロスのサインを
表示できます。

ResiSupo (Traders Club)
このインジケータは直近の高値と安値を抜いたときに何ら方法で 知る方法はないかと思い開発されました。
機能: 指定したローソク足の本数で終値をベースに最高値と最安値の ラインを自動で引きます。 最高値と最安値のラインにタッチするとアラートで通知します。 通知はE-mailやSNSにも送信することができます。 最高値と最安値のラインを終値か高値または安値ベースにするかを選択できます。 Indicator Noを変えることによるこのインジケータを複数適用することができます。 これにより過去80本と20本などでの最高値と最安値のラインを引くことが可能になります。 現在のATRの値を画面に表示します。 これにより現在のボラリティーの状況が一目で分かります。 表示されているSLはディフォルトではATR値の1.5倍になっています。 この数値は現時点でのボラリティーの状況からの損切り幅の目安となります。 ATRのレベルにより表示の色が変わります。 ボタンを押すことによりアラートの通知を無効にできます。 ※ネットワークの不安

Old Partridge knew markets which are almost as old as the Earth itself are never wrong. The legend says he knew how to beat a legion of others. This system he will to me. This system I will give to you.
Example [1] = 100 pips, profit boundary [2] = 2.0, take profit [3] = 400, stop loss [4] = 200 You buy EURUSD as 1.1440. SL will be set to 1.1420, TP will be set to 1.1480, when EURUSD = 1.1460 SL will be moved to 1.1450 EA works with the pair it is run on, [5] option allows to escort positions

NorthEastWay MT5 é um sistema de negociação “pullback” totalmente automatizado, que é especialmente eficaz na negociação de pares de moedas “pullback” populares: AUDCAD, AUDNZD, NZDCAD. O sistema usa os principais padrões do mercado Forex na negociação – o retorno do preço após um movimento brusco em qualquer direção. Prazo: M15
Pares de moedas base: AUDNZD, NZDCAD, AUDCAD
Pares adicionais: EURUSD, USDCAD, GBPUSD, EURCAD, EURGBP, GBPCAD Sinais AO VIVO: MultiWayStrait MT5 Roboforex NEW2000
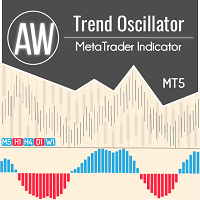
Oscilador de tendência com sistema de filtragem avançado. Ele determina a tendência, seu enfraquecimento e fortalecimento. Tem um painel multi-timeframe embutido. O AW Trend Oscillator funciona em qualquer timeframe e em qualquer símbolo (moedas, índices, petróleo, metais, ações). Versão MT4 -> AQUI / Resolução de problemas -> AQUI Características e benefícios:
Filtragem de tendências avançada Alterando a sensibilidade do indicador em um clique Fácil configuração Painel de vários períod

Expert Advisor não indicador, não usa indicadores, grade de pedido ou martingale. O número de negociações por dia pode ser estritamente limitado, apenas 1 pedido pode estar no mercado por vez. As negociações são protegidas por um stop loss, que pode ser real ou virtual (escondido da corretora). Trabalha durante a sessão asiática, em um mercado calmo. Possui proteção embutida contra deslizamento e alargamento da propagação. Não transfere negócios de segunda a sexta-feira, tem a função de fechame

Indicador projetado para medir o afastamento do preço sobre determinada média móvel.
O indicador, além exibir o valor do afastamento, conta com uma média do próprio afastamento, para auxiliar e confirmar análises. Tanto o tipo da média e a média sobre a qual será calculado o valor do afastamento, como a média do afastamento, são parametrizáveis.
Com a opção "SET AUTO LEVEL AND SHOW SIGNALS" habilitada, o indicador exibe no gráfico sinais de compra e de venda. Sinais de compra e de venda ocor

RSI Robot Easy Este robô totalmente configurável, tem como finalidade executar ordens utilizando como base o indicador RSI. É possível escolher se as entradas irão acontecer ao entrar nas áreas de sobrecompra e/ou ao sair da área de sobrevenda. É possível configurar o stoploss e o takeprofit, e também a quantidade máxima de ordens por vez.
Aurélio Machado.

Este robô tem como finalidade operar a favor de barras de força, o tamanho da barra de força pode ser configurado, o takeprofit e o stoploss podem ser definidos pelos usuários ou pode ser colocado automaticamente pelo robô (nesse caso os alvos de takeprofit e stoploss são do tamanho da barra anterior). Os valores definidos nos parâmetros devem ser alterados conforme as necessidades dos usuários.
FREE

The famous brazilian trader and analyst Didi Aguiar created years ago a study with the crossing of 3 Simple Moving Averages called "Agulhada do Didi", then later was also named Didi Index, as a separate indicator. The period of those SMAs are 3, 8 and 20. As simple as that, this approach and vision bring an easy analysis of market momentum and trend reversal to those traders looking for objective (and visual) information on their charts. Of course, as always, no indicator alone could be used wit
FREE

Este indicador de vários símbolos foi projetado para identificar automaticamente quando o preço atinge os principais níveis psicológicos. Também conhecido como números redondos, números inteiros ou níveis-chave. Como um bônus, ele também pode verificar o nível do ponto de pivô em um período de tempo selecionado. Combinado com suas próprias regras e técnicas, este indicador permitirá que você crie (ou aprimore) seu próprio sistema poderoso. Recursos Pode gravar os sinais em um arquivo que pode se

this indicator is a Spike detector indicator, it is specially designed to trade Boom 1000, Boom 500, Crash 1000 and Crash 500 We recommend using it on Deriv Boom and Crash indices only Its setting is intuitive, familiar, easy to use it has notification functions; audible notifications and push notifications. this tool is simple to use, easy to handle This update is based on different strategies for spikes

TRADE EXTRACTOR is the fastest self-learning AI Algorithm, which will learn any market situation with ease.As a Manual trader, I came across the difficulty of finding the right parameter and the right condition to trade. There are infinite combinations of indicators and objects(trendlines, gann grid, fibo levels etc) which as an human, I can’t decide their winning rate or performance. Many claim to have a winning strategy but won’t have enough statistical support to prove their claims. Due to

SETI is a Break indicator multipair searching SETI is a powerful indicator of for any par and any timeframe. It doesn't requires any additional indicators for the trading setup.The indicator gives clear signals about opening and closing trades. This Indicator is a unique, high quality and affordable trading tool. Can be used in combination with other indicators Perfect For New Traders And Expert Traders Low risk entries. Never repaints signal. Never backpaints signal. Never recalculates

Topos e Fundos Indicator GRATUITO Topos e Fundos: Um eficaz indicador para suas negociações
O indicador de topos e fundos lhe ajuda a perceber as formações de canais ascendentes e descendentes com indicações de topos e fundos ascendentes e/ou descendentes. Além disto ele informa possíveis oportunidades sinalizando com um pequeno círculo amarelo quando o indicador encontrar uma formação de impulso. Com este indicador terás mais segurança e rapidez em suas tomadas de decisão de entradas. Tes
FREE

Mr. Averager MT5 is a Expert Advisor for the MetaTrader 5 trading terminal. The trading algorithm is based on the principle of position averaging. Due to averaging, the EA is not sensitive to the quality of entry points and can work almost at any time and in almost any market. The EA supports 2 trading modes: Automatic start and Manual start. In Automatic start mode, the EA independently starts a new series of orders. In Manual start mode, the first order of the series is opened manually using

Sinais de compra e venda baseados no Setup 9.4 de Larry Williams, popularizado no Brasil pelo Palex, para falhas de reversão e continuação de tendência.
Como funciona? Para uma tendência de alta, o indicador sinaliza a compra quando temos um candle virando a MME9 para baixo e fechando abaixo dela, seguido de um candle virando ela para cima e fechando acima dela, com uma mínima mais alta que a mínima do candle anterior. Para uma tendência de baixa, o indicador sinaliza a venda quando temos um
このEAを使用することによりワンクリックによる決済、 決済したい通貨のチャートに適用しておけば様々な条件で自動で 決済することが可能になります。 パフォーマンスを考慮しているので動作が非常に軽いです。
新機能:Ver2.3
設定した利益以上になるとSLが建値(BE)に設定
新機能:Ver2.0
資金管理による買いや売りエントリ
トレード毎に自動スクリーンショット取得 詳細な情報はこちらにサイトがあります。
https://toushika.top/tc-panel-for-mt5/
機能:
ワンクリックによる全通貨決済
ワンクリックによる表示上の通貨決済
分かりやすいPips表示 移動可能
全通貨での合計Pips表示
自動利確、損切り設定
設定以上のスプレッドになった場合には画面の色が変化
Break Evenラインの表示
チャート画像の保存
決済の通知機能(Email,SNS)
パネル位置指定
Pips表示消去
他の通貨で設定した水平線で決済
下記に示した条件での利確
条件による決済:

Sinais de compra e venda baseados no Setup 9.2 de Larry Williams, popularizado no Brasil pelo Palex, para continuação de tendência.
Como funciona? O indicador ativa o sinal de compra quando um candle fecha abaixo da mínima anterior se a média móvel exponencial (MME) de 9 períodos estiver subindo.
O indicador ativa o sinal de venda quando um candle fecha acima da máxima anterior se a MME9 estiver caindo.
Como usar? Uma maneira de usá-lo, proposta por Larry Williams, é entrar no trade com

Sinais de compra e venda baseados no Setup 9.3 de Larry Williams, popularizado no Brasil pelo Palex, para continuação de tendência.
Como funciona? O indicador ativa o sinal de compra quando dois candles fecham abaixo do fechamento referência e a média móvel exponencial (MME) de 9 períodos está subindo.
O indicador ativa o sinal de venda quando dois candles fecham acima do fechamento referência e a MME9 está caindo.
Como usar? Uma maneira de usá-lo, proposta por Larry Williams, é entrar no

Fundamentação teórica A VWAP é uma média móvel ajustada pelo volume, ou seja o peso de cada preço corresponde ao volume de ações negociadas no período, dando mais importância ao período em que se tenha mais negociações. [1] VWAP = sum(price[i]*volume[i]) / sum(volume[i]) Metodologia É possível configurar o período que será utilizado para o calculo da VWAP, a cor, a espessura e o estilo da linha. A linha é desenhada desde a o começo da série disponível apenas uma vez para economizar recursos com
FREE

This EA works on the basis of channels formed by price. It trades from the boundaries of these channels (for example, when the price breaks through the border of the channel, or when it touches and comes back). It can also display the lines and channels through which it trades. They are built on the highs and lows of prices. The EA has customizable parameters for trading on multiple channels and uses some indicators to improve trading (for example, Stochastic or ADX). It also has parameters for

The Trend Rendezvous indicator searches for and displays pivot points on the price chart. The goal, which was pursued during its creation, is to obtain signals that will produce less noise and respond more quickly to price changes. The Trend Rendezvous indicator is a trend indicator that is used to search for reversals in the breakdown of its borders. The indicator is its signal and has one interesting property. It is necessary to take into account that this indicator reflects extrema and shoul
Saiba como comprar um robô de negociação na AppStore do MetaTrader, a loja de aplicativos para a plataforma MetaTrader.
O Sistema de Pagamento MQL5.community permite transações através WebMoney, PayPay, ePayments e sistemas de pagamento populares. Nós recomendamos que você teste o robô de negociação antes de comprá-lo para uma melhor experiência como cliente.
Você está perdendo oportunidades de negociação:
- Aplicativos de negociação gratuitos
- 8 000+ sinais para cópia
- Notícias econômicas para análise dos mercados financeiros
Registro
Login
Se você não tem uma conta, por favor registre-se
Para login e uso do site MQL5.com, você deve ativar o uso de cookies.
Ative esta opção no seu navegador, caso contrário você não poderá fazer login.