Conheça o Mercado MQL5 no YouTube, assista aos vídeos tutoriais
Como comprar um robô de negociação ou indicador?
Execute seu EA na
hospedagem virtual
hospedagem virtual
Teste indicadores/robôs de negociação antes de comprá-los
Quer ganhar dinheiro no Mercado?
Como apresentar um produto para o consumidor final?
Pagamento de Indicadores Técnicos para MetaTrader 5 - 23

This indicator Allow you to get notification from 7 indicators. Scan all your favorite pairs with your favorite technical indicator, and get notified on your preferred timeframes.
Settings are Customizable
(RSI, ADX, MACD, Alligator, Ichimoku, Double MA, and Stochastic)
Click to change the time frame or open new pairs
Notification: Phone/Popup/Email

O indicador Vwap Deviation Bands segue na mesma linha dos outros indicadores da White Trader, que buscam leveza, personalização e qualidade, para entregar o que há de melhor para o trader. Isto, além de combinar preço e volume (informações importantes para o trader) com uma medida estatística do desvio padrão.
Este indicador já foi utilizado e testado por outros traders que deram sugestões, inclusive, para chegarmos nesta versão final (embora ainda esteja aceitando sugestões, sempre :) ). O d

Weighted average price indicator or VWAP. The well-known standard VWAP with the beginning of the day is added with the function of selecting the periodization. It can be calculated both every day and on other periods. Also the indicator allows to exclude the volume from the calculation, which will allow using it on the cryptocurrencies and forex. There is an alert for a VWAP price crossing. There are 1 and 2 standard deviation. Settings: Volume: turning volume on and off in the calculation mecha

Este indicador cria o RENKO perfeito para que possa trabalhar com esse tipo de Candle ATEMPORAL! Por ser atemporal, as setas indicativas de negociação ficariam perdidas, porém esse indicador as ajusta e as deixa exatamente onde ocorreu a negociação! Além de demonstrar exatamente a divisão entre os dias, de modo a deixar claro para o usuário onde começou e terminou cada pregão!
Detalhes importantes: O RENKO gerado de forma automática possui acurácia de até 95% para renkos pequenos (5R) e 100% d

Midas é o acrônimo de Market Interpretation/Data Analysis System é uma abordagem de trade iniciada em 1995 pelo analista técnico Paul Levine e posteriormente desenvolvida por Andrew Coles, PhD e David Hawkins.
É possível aprender mais sobre as Midas e outros indicadores baseados nela (pesquise nos outros indicadores da White Trader e vai ver o que já desenvolvi) no livro MIDAS Technical Analysis: A VWAP Approach to Trading and Investing in Today's Markets, (vi que é possível comprar via Amazo

O indicador Vwap Bands Auto busca mapear automaticamente a frequência máxima do mercado ( atualização automática da banda mais externa ) e possui duas bandas intermedíarias que também se ajustam à volatilidade diária.
Mais uma ferramenta da White Trader que combina preço e volume, além de mapear a amplitude diária.
A banda externa é atualizada automaticamente quando a máxima ou mínima diária rompe a frequência atual, e pode ser um sinal de entrada, buscando o retorno à vwap diária.
De

FTFC refere-se a Full Timeframe Continuity, conforme definido por Rob Smith's The Strat . Este indicador desenha duas linhas no gráfico, uma das mais altas dos níveis de abertura Trimestral, Mensal, Semanal, Diário ou Horário, e a segunda do mais baixo desses valores. Isso fornece um canal acima ou abaixo do qual é mais provável que a negociação seja muito forte em uma direção. Entre as linhas, a ação do preço será mais instável e você poderá usar paradas mais amplas. Uma terceira linha trac
Blended Candle Strength PRO (BCS)
Força do Candle Combinado PRO (BCS) Qualquer estratégia de operação, seja de continuação, reversão de tendência ou rompimento requer, além da análise do contexto do movimento dos preços, de sinais de confirmação tanto para a entrada quanto para a saída das operações. E para isso se faz necessário analisar os formatos dos candlesticks e enquadrá-los em padrões conhecidos para auxiliar a tomada de decisões. Além do contexto e do formato, outras duas informações

Já conhece o indicador Start Midas? E o indicador Vwap Standard Deviation? E preciso novamente falar no livro MIDAS Technical Analysis...
O indicador Start Midas SD Channel combina os dois em um, trazendo a praticidade e eficiência da Midas com o cálculo estatístico do desvio padrão. Tudo isso com a praticidade dos indicadores Start da White Trader, onde você pode plotar o indicador e movimentá-los na tela usando atalhos de teclado.
Se você acha que este indicador vai somar no seu operaciona

Nós da Minions Labs consideramos o ATR ( Average True Range ) um dos indicadores mais fantásticos e subestimados de Análise Técnica. A maioria dos traders realmente não dá a mínima para o True Range do mercado e isso provavelmente pode ser porque eles não conseguiram aplicar essas informações de imediato e de maneira prática em seus estudos gráficos ou em sua própria estratégia de trade, deixando esse indicador no limbo da obscuridade e da dúvida.
Bem, este indicador, Bigger Than ATR , é um a

Baze Zone is a configurable combination of tools/levels (MT4 version also available at MT4 section): - Fib levels, 14, 23,50 - Fib Extension 27,61 - Pivot Points - Adds boxes to indicate range 'breakout' - ATR Range - Prev Daily Candle Range - Shortcut keys to hide/show the lines (configurable) In short, use this tool to add some extra zones to you fib tool. And use the extra's in combination with the shortcut keys to keep your chart clean. You can drag the lines for the Fib Levels.
The name
Currency Chart is a MT5 overlay indicator for 8 major currencies including AUD, CAD, CHF, EUR, GBP, JPY, NZD and USD. The chart represents one currency average prices relative to the others. The currency chart makes us easy in evaluate direction, trend, strength, support and resistant levels or even a reversal level of the currency. Good for medium-term and long-term trading styles. Chart type: Candlestick chart, bar chart or line chart. Chart timeframe: Same as MT5 timeframe. Built-in indicator
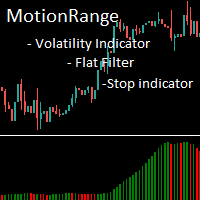
MotionRange - индикатор волатильности цены.
Индикатор не показывает направление движения цены и предназначен для наглядной демонстрации наличия трендового движения, силы тренда, ускорения и замедления трендового движения. Индикатор можно использовать для: - фильтрации флэтового состояния рынка, - открытия позиций в момент начала тренда, - закрытия позиций в момент замедления или остановки тренда.
У индикатора один входной параметр - Calculation Period. Это количество сравниваемых свечей

Session Control session indicator. Depending on from which continent the trading activity takes place in a certain period, the entire daily routine is divided into several trading sessions.
Due to the fact that at each separate time interval exchange and banking platforms from different parts of the world are connected to the trading process, and the Forex market operates around the clock.
There are 4 main trading sessions:
Pacific. European. American. Asian.
This indicator allows you t
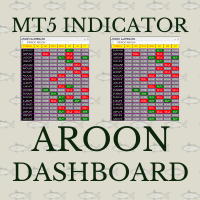
Aroon crossover Dashboard uses the value of Aroon indicator. The Aroon period can be adjusted via the Edit box of this dashboard. The monitoring pairs will be selected by adding to the Market Watch (no need to set prefixes or suffixes) , you can monitor many pairs as you like. This dashboard will check almost popular time frame (M1,M5,M15,M30,H1,H4 and D1). The colors can be customized. The Aroon indicator has been included in to this Dashboard, you do not need purchasing it. Crossover signal c
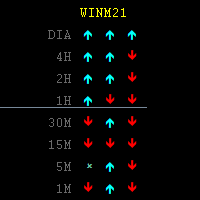
Indicador visual que mostra a direção de um ativo em diferentes times frames. Acompanhe em tempo real a variação de direção dos preços nos últimos 3 candles. É possível escolher o ativo a ser mostrado e quais times frames deseja acompanhar. Excelente para operações Day Trade. Facilita a visualização de vários times frames auxiliando assim na tomada de decisão rápida. Parâmetros de fácil configuração.

Túnel de Vegas, com até 20 níveis, permitindo plotar ou não cada nível com troca de cor, espessura das linhas e visualização ON/OFF para facilitar a utilização.
Recomendado a utilização para timeframes:
Original --> H1
Fractais --> M15, M30, H4, D1 e W1 Teste em Gráfico W1 apresentando consistência.: https://www.mql5.com/pt/signals/2211259 Acompanhe os resultados no meu sinal:
https://www.mql5.com/pt/signals/2211259
Tiago Lacerda Telegram: @tfmlacerda
E-mail: mediador@gmail.com
Yo

Este indicador mostra, no dia corrente algumas linhas de interesse, como máxima, mínima e fechamento do dia anterior, bem como o preço de abertura, máxima e mínima do dia atual.
Ele também pode mostrar o GAP (fechamento do dia anterior e abertura do dia atual) e projeções da amplitude do dia anterior, conforme o valor que você escolher no multiplicador.
Ah, ia me esquecer. Também é possível determinar o time frame, que é diário por default.
Se este indicador pode contribuir no seu operaci

Os níveis de pivô são um nível técnico bem estabelecido e reconhecido em todos os mercados. Este indicador desenhará os atuais pivôs trimestrais, mensais, semanais, diários e de quatro horas no gráfico, para qualquer símbolo. Você também pode mostrar os níveis de Suporte e Resistência para cada período e escolher qual exibir dos níveis 1 a 4. Escolha o tipo de pivô entre: Padrão Camarilha Dinamarca Woodie Fibonacci Observe que os pivôs DeMark têm um único nível de suporte e resistência de ac
Here is a Multi-Time Fram (MTF) ZigZag indicator which can draw price channel. Having ZigZag Channels of higher time frames gives you a more accurate overview of the current price action. In addition, it helps to identify any pattern or cycle that the market is creating or following. It will also help you identify support and resistance levels of higher timeframes and strong price action zones.
You can easily draw horizontal ray line for the open, high, low and close price levels of any candle with this indicator. Parameters Mode Key + click - you should press o, h, l or c keys on the keyboard first, then click on any candle. Mouse hover + click - just move your mouse and point to any candle, then press o, h, l or c keys on the keyboard. Note: in both modes, you should point the horizontal center of the candle for accurate selection. The vertical position of the pointer is irrelevant.
MAs Crossover Dashboard Pro uses the value of Moving Average indicator. The periods of 2 MAs can be adjusted via the Edit boxes of this dashboard. The monitoring pairs will be selected by adding to the Market Watch (no need to set prefixes or suffixes) , you can monitor many pairs as you like. This dashboard will check almost popular time frame (M1,M5,M15,M30,H1,H4 and D1). The colors can be customized. The parameter of MAs can be set at the input. Crossover signal can be sent to you screen, yo

Hello!
Tired of constantly subscribing to other people's signals and earning pennies?
Want to manage your own trading?
Then you are on the right page!
It's very simple ==> buy my indicator ==> put it on the chart ==> blue arrow - buy ==> red arrow - sell. Even an infant can do it!
A handy histogram to trace the market direction.
Are you still here? Then read the parameter descriptions and take a look at the screenshots: Stoch K period - period for calculating the% K oscillator line.

A ‘Supertrend’ indicator is one, which can give you precise buy or sell signal in a trending market. As the name suggests, ‘Supertrend’ is a trend-following indicator just like moving averages and MACD (moving average convergence divergence). It is plotted on prices and their placement indicates the current trend. The Supertrend indicator is a trend following overlay on your trading chart, much like a moving average, that shows you the current trend direction. The indicator works well in a tren

Este indicador cria o RENKO perfeito para que possa trabalhar com esse tipo de Candle ATEMPORAL! Por ser atemporal, as setas indicativas de negociação ficariam perdidas, porém esse indicador as ajusta e as deixa exatamente onde ocorreu a negociação! Além de demonstrar exatamente a divisão entre os dias, de modo a deixar claro para o usuário onde começou e terminou cada pregão! Além disso, os seguintes indicadores foram incluídos, de modo a dar maior poder de análise em suas negociações: SuperTre
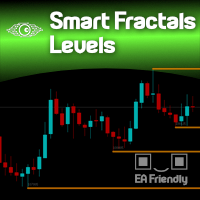
Suportes & Resistências levados ao próximo nível. O indicador Smart Fractals Levels é baseado na teoria de Bill Williams de identificação dos níveis de Suporte e Resistência através do uso dos chamados " Fractais ". A diferença entre as regiões comuns que você encontra de Suporte e Resistência tradicionais e as que o indicador Smart Fractals Levels entrega são que apenas os níveis NOVOS e intocados ainda permanecerão desenhados no gráfico (se você decidir assim), e também com base em seu próprio

Os mercados realmente adoram números redondos e geralmente atuam como suporte em um mercado em queda ou resistência quando os preços sobem. Este indicador é projetado para desenhar níveis de preços em valores redondos. Ele faz isso automaticamente, mas você também tem a opção de substituir isso e determinar os níveis que deseja ver. Um nível redondo pode ser tão simples quanto passos de 10, então 10, 20, 30 etc. ou se você estiver trabalhando com Forex, talvez queira ver mudanças em 0,1 ou 0,01.

With my custom built formula, you can visualize the market similar to displaying a heat map; with color showing at a glance the strength of the current trend, and the bar length showing the intensity of current movement. In more detail: Length of the histogram bar shows the average bar size of the last period, and color (from red to blue) shows the strength of upward or downward movement. Purple zones can indicate a change into a new trend. Bar period is adjustable so as to measure larger or sm

//////////////////////////////////////////////////// // ////////////////////////////////////// Este indicador usa regressão polinomial para plotar três canais e seis linhas de acordo. O primeiro canal e suas fronteiras com grande período, o segundo com média e o terceiro com pequeno período. A configuração é simples - você só precisa especificar as cores e ativar / desativar a exibição das etiquetas de preço. Também é muito fácil entender as leituras deste indicador. As linhas de canal são usad

Average True Range (ATR) é um indicador comumente usado que mede a quantidade de movimento no preço ao longo de uma duração definida. No entanto, o valor que ele fornece não é definido dentro de nenhum tipo de limite, o que torna quase impossível usá-lo para qualquer outra coisa que não seja stop loss ou cálculos de lucro. Este indicador é o seu indicador ATR padrão, mas introduzimos demarcações de percentil para que você possa ver os extremos. Você pode escolher entre Percentis e algo que chama
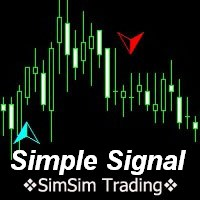
MT5 trend indicator works without redrawing. Provides signals for entering trades, works on charts of any instrument. Трендовый индикатор МТ5, работает без перерисовки. Выдает сигналы для входа в сделки, работает на графиках любого инструмента. Input parameters are for styling and messages only. / Входные параметры только для оформления и сообщений. All original signal calculations do not need additional parameters. / Все оригинальные расчеты сигнала, не нуждаются в дополнительных параметрах.

Indicador funciona com duas médias móveis, conforme elas se cruzam as médias mudam de cor. As duas médias móveis estão liberadas todos os ajustes disponíveis nele, e caso queira colocar em um expert os seus buffers também estão liberados. Caso exista alguma dúvida não pense duas vezes e me pergunte, irei responder com todo prazer, espero que goste do indicador e lhe dê bastante resultado.

You can think of these indicators as moving pivot points. MasterChartsTrading Price Action Indicators show good price levels to enter or exit a trade. The Blue indicator line serves as a Bullish Trend setter. If your instrument closes above the Blue line, we think about going Long (buying). When your trading instrument closes below the Red line, we think about Shorting (selling). It is very easy to read price action if you have a reference point. These support/resistance lines are there to help

A huge number of traders use the VolumeProfile/MarketProfile analysis method. And I think there is no need to explain such concepts as POC and VAH/VAL. However, the standard VolumeProfile representation has a drawback - we only see the current picture of the market. We see the "convexity" of the volume distribution within the period. But we don't see the main thing - the "migration" of the POC level during the price movement. Our indicator is unique. It is dynamic. The first feature is that the
An indicator of patterns #47 and #48 ("Triangle, ascending" and "Triangle, descending") from Encyclopedia of Chart Patterns by Thomas N. Bulkowski.
Parameters: Alerts - show alert when an arrow appears Push - send a push notification when an arrow appears (requires configuration in the terminal) PeriodBars - indicator period K1 - an additional parameter that influences the accuracy of pattern shape recognition K2 - an additional parameter that influences the accuracy of pattern shape recogn

A tendência permite prever o movimento dos preços e determinar os principais rumos da conclusão das transações. A construção de linhas de tendência é possível usando vários métodos adequados ao estilo de negociação do trader. Este indicador calcula os parâmetros do movimento de tendência com base na distribuição de von Mises. O uso desta distribuição permite obter valores estáveis da equação de tendência. Além de calcular a tendência, também são calculados os níveis de possíveis desvios para

DYJ Tradays Economic Calendar is calendar Indicators of macroeconomic events for fundamental market analysis. Therein you will find financial news and indicators for the largest global economies – from the US and the EU to Australia and Japan, a total of 23 economies, involving more than 60 currency pairs. More than 800 macroeconomic indicators and events are collected from public sources in real time. Historical, current and forecast values, as well as importance characteristics are available
An indicator of pattern #49 ("Triangle, symmetrical") from Encyclopedia of Chart Patterns by Thomas N. Bulkowski. Parameters: Alerts - show alert when an arrow appears Push - send a push notification when an arrow appears (requires configuration in the terminal) PeriodBars - indicator period K - an additional parameter that influences the accuracy of pattern shape recognition ArrowType - a symbol from 1 to 17
ArrowVShift - vertical shift of arrows in pixels ShowLevels - show lines ColUp - c
An indicator of patterns #39 and #40 ("Rounding Tops" and "Rounding Bottoms") from Encyclopedia of Chart Patterns by Thomas N. Bulkowski. Parameters: Alerts - show alert when an arrow appears Push - send a push notification when an arrow appears (requires configuration in the terminal) PeriodBars - indicator period K - an additional parameter that influences the accuracy of pattern shape recognition. Changes from 0 to 1 ArrowType - a symbol from 1 to 17 ArrowVShift - vertical shift of arrows
An indicator of patterns #11 and #12 ("Diamond Tops" and "Diamond Bottoms") from Encyclopedia of Chart Patterns by Thomas N. Bulkowski. Parameters: Alerts - show alert when an arrow appears Push - send a push notification when an arrow appears (requires configuration in the terminal) PeriodBars - indicator period K - an additional parameter that influences the accuracy of pattern shape recognition ArrowType - a symbol from 1 to 17 ArrowVShift - vertical shift of arrows in pixels ShowLevels - s
An indicator of patterns #37 and #38 ("Rectangle Tops" and "Rectangle Bottoms") from Encyclopedia of Chart Patterns by Thomas N. Bulkowski. Parameters: Alerts - show alert when an arrow appears Push - send a push notification when an arrow appears (requires configuration in the terminal) PeriodBars - indicator period VertexCount - the number of tops and bottoms: 2, 3, 4. ArrowType - a symbol from 1 to 17 ArrowVShift - vertical shift of arrows in piхels ShowLevels - show levels ColUp - colo
An indicator of patterns #7 and #8 ("Bump-and-Run" and "Bump-and-Run Reversal") from Encyclopedia of Chart Patterns by Thomas N. Bulkowski. Parameters: Alerts - show alert when an arrow appears Push - send a push notification when an arrow appears (requires configuration in the terminal) PeriodBars - indicator period K - an additional parameter that influences the accuracy of pattern shape recognition ArrowType - Character: from 1 to 17 ArrowVShift - vertical shift of arrows in pixels ShowL

Description
Trend Influencer is an indicator that determines the potential dynamics of the influence of trend wave movements on the market. The indicator is based on the value of moving averages corrected by the standard deviation. The indicator is displayed as a main dash-dotted moving average and a signal solid moving average. The signal moving average is colored blue or red depending on what type of trend is currently observed in the market. The indicator also draws inhibition levels - blue

O Indicador BOPCoiote é uma releitura do indicador Balance of Power proposto por Igor Livshin em Agosto de 2001, publicado na Stocks and Commodities Magazine. Uma média móvel de 14 períodos é recomendada para gráficos diários. Embora o número de períodos possa variar dependendo da natureza do mercado e dos prazos.
O nível em que ele agrupa seus fundos e topos é considerado uma das propriedades mais importantes do indicador BOP.
Durante as tendências de alta, suas máximas frequentemente tocam

A média aritmética ou mediana pode ser usada para determinar a medida da tendência central de uma série temporal. Ambos os métodos apresentam algumas desvantagens. A média aritmética é calculada pelo indicador Simple Moving Average. É sensível a emissões e ruído. A mediana se comporta de forma mais estável, mas há perda de informação nos limites do intervalo. A fim de reduzir essas desvantagens, a filtragem de sinal pseudo-mediana pode ser usada. Para fazer isso, pegue a mediana de um pequeno c

Este é um gráfico de ticks no segundo formato. Há suporte para OpenCL. As configurações são muito simples - você pode selecionar os dias da semana para os quais o indicador será calculado: por exemplo, para esses instrumentos financeiros, cujas cotações não são atualizadas nos finais de semana, você deve selecionar qualquer outro dia da semana para o 6º e 7º dias, mas, por exemplo, para bitcoin, se o corretor atualizar as cotações, você pode especifique para o 6º dia - sábado e para o 7º dia -

Binary MA Cross MA Cross indicator by 4Umbella
Create for traders both experienced and inexperienced to use it because it is a basic indicator
How to use : 1. MA Fast : Moving Average fast (Period 4 upto 50) 2. MA Middle : Moving Average Middle (Period 10 upto 100) 3. MA Slow : Moving Average Slow (Period 50 upto 200) to control trend markets.
and trader can be set for Apply to price (Close, Open,Low,High,Median,Typical,weightd)
For alert you can set to alert Next bar or instant bar
//////////////////////////////////////////////////// // //////////////////////////////////////
Uma versão melhorada do indicador Average True Range.
Isso agora é o dobro da precisão e uma linha de média colorida.
A configuração é bastante simples - você precisa especificar o período principal e o período de média.
É muito fácil entender as leituras deste indicador, o significado é o mesmo que o do intervalo médio verdadeiro padrão.
////////////////////////////////////////////////////

//////////////////////////////////////////////////// // //////////////////////////////////////
Este indicador exibe a faixa de mudanças de preço em 1 minuto. Ótimo para gerenciamento de risco. Esta é uma versão aprimorada do indicador Average True Range para Tick Chart.
Isso agora é o dobro da precisão e uma linha de média colorida.
A configuração é bastante simples - você só precisa alterar as cores se necessário.
É muito fácil entender as leituras deste indicador, o significado é o me

Unlike any indicator you’ve seen, Trend Volley is an advanced purpose-built trend trading charting system that has been successfully used in nearly every tradable market. It is unique in many ways. Trend Volley’s internal trend detector algorithm studies the market and dynamically chooses the right values for the internal parameters, to adapt to the price and to decrease consecutive trend failures. It can be applied to any financial assets: forex, cryptocurrencies, metals, stocks, indices. ITS

Uma das melhores ferramentas para se analisar o volume, o Weis Wave foi idealizado por David Weis para facilitar a leitura do fluxo direcional.
Para os discípulos do método Wyckoff, isso significa uma evolução, facilitando uma leitura preditiva do mercado, sempre buscando zonas de Acumulação e Distribuição dos ativos negociados.
Para melhor compreensão, neste indicador tentamos abrangir toda leitura de ESFORÇO (volume negociado) versus RESULTADO (alteração de preços). Assim, você poderá apli
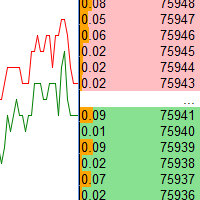
Depth of market display. Up to sixteen instruments can be displayed. There is auto-scrolling of prices, which can be turned off by clicking on "A" at the top of the window. It is quite a beautiful indicator, it can act as a splash screen, it will not be so boring to look like a regular chart, just right for meditation, especially after big losses in the market. The indicator is not for trading, so your deposit will be more complete. The video displays fast playback of previously saved data. Atte

Simple and fast MACD oscillator with MACD and signal lines and two-color histogram.
I wasn't happy with the Meta Trader MACD oscillator as it's not immediate to read and the other ones I tried felt a bit laggy or added unneeded features on top, so I decide to make one that feels familiar to me. I hope you will find it useful!
Contact me for any issues or bugs and I will try to help the best I can.
A lot of professional traders use high quality divergence signals as a part of their strategy to enter a position. Spotting correct divergences quickly can often be hard, especially if your eye isn’t trained for it yet. For this reason we’ve created a series of easy to use professional oscillator divergence indicators that are very customisable so you get only the signals you want to trade. We have this divergence indicator for RSI, MACD, Stochastics, CCI and OBV. RSI: https://www.mql5.com/en/
A lot of professional traders use high quality divergence signals as a part of their strategy to enter a position. Spotting correct divergences quickly can often be hard, especially if your eye isn’t trained for it yet. For this reason we’ve created a series of easy to use professional oscillator divergence indicators that are very customisable so you get only the signals you want to trade. We have this divergence indicator for RSI, MACD, Stochastics, CCI and OBV. RSI: https://www.mql5.com/en/ma
A lot of professional traders use high quality divergence signals as a part of their strategy to enter a position. Spotting correct divergences quickly can often be hard, especially if your eye isn’t trained for it yet. For this reason we’ve created a series of easy to use professional oscillator divergence indicators that are very customisable so you get only the signals you want to trade. We have this divergence indicator for RSI, MACD, Stochastics, CCI and OBV. RSI: https://www.mql5.com/en/

A lot of professional traders use high quality divergence signals as a part of their strategy to enter a position. Spotting correct divergences quickly can often be hard, especially if your eye isn’t trained for it yet. For this reason we’ve created a series of easy to use professional oscillator divergence indicators that are very customisable so you get only the signals you want to trade. We have this divergence indicator for RSI, MACD, Stochastics, CCI and OBV. RSI: https://www.mql5.com/en/

A lot of professional traders use high quality divergence signals as a part of their strategy to enter a position. Spotting correct divergences quickly can often be hard, especially if your eye isn’t trained for it yet. For this reason we’ve created a series of easy to use professional oscillator divergence indicators that are very customisable so you get only the signals you want to trade. We have this divergence indicator for RSI, MACD, Stochastics, CCI and OBV. RSI: https://www.mql5.com/en/

Moving Average Crossover Scanner and Dashboard For MT5 Advanced Moving Average Scanner Moving Averages Crossover Dashboard MT4 Version of the product can be downloaded: https://www.mql5.com/en/market/product/69260 The indicator scans the market and sends signals and alerts for Moving Average crossovers, death cross and golden cross.
Crossovers are one of the main moving average ( MA ) strategies.
MA Crossover ( cut ) strategy is to apply two moving averages to a chart: one longer and one s

One of the most famous phrases in the trading world is "The Trend Is Your Friend".
Trading following the current trend is one of the most successful ways in terms of probability. The hard part of it is to recognize when the market is trending or not.
that's the role of our indicator we called The Trend Is Your Friend Until It Is Not. Apart from its big name it is really easy to use and see when the market is trending or ranging. Through a little window of 3 colors you will identify if the ma
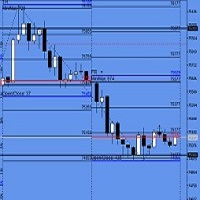
Open close levels.
Open close levels - is an indicator for MetaTrader 5, which displays High/Low, Open/Close, ATR levels (set manually) of the day, week, month on the chart. Marks round levels, signs the days of the week, numbers every week. All levels are marked with price tags with a price symbol. Also, the indicator automatically calculates and displays on the chart the distance that the price has passed from High to Low and from Open to Close by day, week and month.
The indicator di

Conta o tempo de vida de do Candle Extra até seu fechamento. É utilizada para auxiliar na entrada das operações...
...Operamos no fechamento dos Candles de um minuto, ou seja, quando o cronometro estiver em 00:xx:01. Abrimos uma ordem, e o valor dessa operação também é exibida pela ferramenta.
Extra: Para 'destravar' a escala dos preços. Clique duas vezes na escala e o gráfico será 'centralizado horizontalmente'.
Além de possibilitar a expansão e a contração da escala de preço, podemos naveg

There is a very simple rule
It is Always difficult to cross high pressure areas and easy to cross low pressure areas
MT4 version is available here
This is definitely true for price
It was so simple, it was not!
So let's get started
This indicator shows you the amount of pressure in that area according to the bars that it shows. The longer the bar, the higher the pressure in that area It also marks the most pressed area with a rectangle
From now on you can simply decide on the
Multi Time Frame Sub Panel for MT5. Monitor multiple time frames from a single chart window.
Here are some of the options available with the MTF Moving Average: Select the timeframes to be displayed (can manually type in other TF's) Customize the amount of timeframes to be displayed Define the width (number of bars) for each timeframe box Modify all the colors Display two moving averages
MTF, MA, Multi-TF, Multiple TF, Moving Average, SubPanel, Sub-panel,

For anyone studying forex charts, the aim is to identify trends, and spot reversals. If you have years of experience it may be easy, but most of us need something to make the trend apparent. If you're familiar with the popular renko charting method, you know that it was developed for this purpose. But renko charting has a flaw; the trend is often broken by false reversals. So I developed my own version - the Kenko Trend Indicator. The kenko trend indicator draws renko style trend following block

Half Trend TPSL Buy Sell Indicator calculates the open and close of the price bars over the selected period of time and applies its own calculation method to find an average line of the price movement. ATR based Take Profit and Stop Loss ATR is a measure of volatility over a specified period of time. The most common length is 14, which is also a common length for oscillators, such as the relative strength index (RSI) and stochastics. A higher ATR indicates a more volatile market, while a lowe
An indicator of patterns #35 and #36 ("Pipe bottoms" and "Pipe tops") from Encyclopedia of Chart Patterns by Thomas N. Bulkowski. Parameters: Alerts - show alert when an arrow appears Push - send a push notification when an arrow appears (requires configuration in the terminal) PeriodBars - An indicator period (number of bars that form a top/a bottom) K1 - an additional parameter that influences the accuracy of pattern shape recognition K2 - an additional parameter that influences the accuracy

Version 1.0 The Trend Snatcher is Multi timeframe indicator that can be used to catch swings on the price market chart The indicator uses two lines that targets the highest buying and lowest selling levels , the signal indicated by the two lines crossing The indicator is suitable for scalping and Swing trading, It can also be used as additional Confluence to enter a trade when Price is at a significant level of supply and demand or Trendline touch
HOW IT WORKS? Buying : Place your Buy

Sends alert when price moves from the previous alarm price by predefined points (or bps). Four alarm modes: push notifications, pop-up, e-mail and / or FTP. Highly customizable alert text and user-configurable indicator color / width / style.
Input parameters: Alert offset, in points : Alert is triggered when price moves from the previous alert by predefined points (if the last alert has not been registered, the current price is used as the last alert). The alert price is updated automaticall

Traça automaticamente a 'Proporção Áurea de Fibonacci’ entre a Máxima e Mínima do Dia anterior... ...As máximas e Mínimas são ótimas zonas de Suporte e Resistência. Os rompimentos dos níveis de Fibonacci, são pontos chave para entradas e saídas das operações. Linhas de cor Rosa, indicam que o Candle do dia anterior fechou de baixa. Linhas de cor Azul, indicam que o Candle do dia anterior fechou de alta.
Você sabe por que o mercado MetaTrader é o melhor lugar para vender as estratégias de negociação e indicadores técnicos? Não há necessidade de propaganda ou software de proteção, muito menos problemas de pagamentos. Tudo é providenciado no mercado MetaTrader.
Você está perdendo oportunidades de negociação:
- Aplicativos de negociação gratuitos
- 8 000+ sinais para cópia
- Notícias econômicas para análise dos mercados financeiros
Registro
Login
Se você não tem uma conta, por favor registre-se
Para login e uso do site MQL5.com, você deve ativar o uso de cookies.
Ative esta opção no seu navegador, caso contrário você não poderá fazer login.