Conheça o Mercado MQL5 no YouTube, assista aos vídeos tutoriais
Como comprar um robô de negociação ou indicador?
Execute seu EA na
hospedagem virtual
hospedagem virtual
Teste indicadores/robôs de negociação antes de comprá-los
Quer ganhar dinheiro no Mercado?
Como apresentar um produto para o consumidor final?
Indicadores Técnicos para MetaTrader 5 - 3

O popular indicador "SuperTrend" é uma ferramenta de análise técnica que ajuda a identificar a direção de uma tendência e possíveis pontos de entrada ou saída nos mercados financeiros. O indicador é baseado na Média do Intervalo Verdadeiro (ATR), que mede a volatilidade do mercado com base nos intervalos de preços. Ele é gratuito em outras plataformas e aqui não deve ser diferente! Ele é comumente usado de três maneiras: Para identificar a Tendência Atual: Quando o preço está acima dessa linha,
FREE

O Heikin Ashi Delta PRO aproveita a refinada elegância dos candlesticks Heikin Ashi, conhecidos por sua capacidade de filtrar ruídos do mercado e destacar tendências e reversões mais claras. Construído sobre uma base sólida, este indicador avançado integra o método da Média Móvel de Hull, aprimorando sua precisão e responsividade. Junto com um sistema de alerta intuitivo, ele transforma os dados brutos do mercado em insights comerciais acionáveis, capacitando os traders a tomar decisões mais inf

The principle of construction - on top of any number of bars set by the user, a channel is constructed with maximum and minimum lines so that the bars touch the maximum and minimum of the channel at exactly three points. The name of the indicator follows from this principle. Both vertical lines can be moved along the graph by the user, thus specifying the period on which the channel is built. After a specified period, channel rays are drawn that define a channel in which the price can move.

O indicador exibe setas no gráfico indentificando compras e vendas em confluência com os setups criados por Larry Williams, são setups simples de REVERSÃO e também de facil compreenção e execução, tornandos os assim mundialmente conhecidos entre traders de análise técnica. No indicador é possivel configurar além das opções de setup também a configuração da média movel base que é usada para geral o sinal.

--- StudentK Sync Chart --- 1. Move charts at the same time 2. Cross check among different Symbols and Timeframes 3. Plan your own trading strategies
--- Context --- StudentK is not indicated as a master or K Sir for knowledgeable person who claims for winning all the time. (But lots of traders should know the fact that it is rarely truth, especially in fluctuated period of time)
StudentK is a group of years-experienced traders who want to share amazing tools in Free and Paid versions. Aimi

Automatic fibonacci with alerts is an indicator that automatically plots a fibonacci retracement based on the number of bars you select on the BarsToScan setting in the indicator. The fibonacci is automatically updated in real time as new highest and lowest values appear amongst the selected bars. You can select which level values to be displayed in the indicator settings. You can also select the color of the levels thus enabling the trader to be able to attach the indicator several times with d
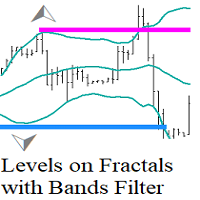
Levels on Fractals with Bands Filter é um nível baseado em fractais filtrados com o indicador Bollinger Bands.
O Levels on Fractals with Bollinger Bands Filter é uma ferramenta de análise técnica que usa uma combinação de fractais e o indicador Bollinger Bands para identificar níveis de suporte e resistência.
Como usá-lo.
Quando um fractal se forma atrás da banda de Bollinger externa (quebra de volatilidade), isso indica que o preço atingiu um nível extremo e pode mudar de direção.
E
FREE

EA included, PM after purchase! <-----
Trap Play refers to a market situation where price initially makes a new high or low, luring traders into believing a strong trend is forming. However, the price quickly reverses and invalidates the breakout, trapping those traders who entered positions based on the initial move. This sudden reversal often results in a rapid exit of positions, leading to significant price movement in the opposite direction. Trap plays can occur in various financial mar

Candle Counter é um indicador que imprime o número dos candles desde o primeiro candle do dia. O primeiro candle do dia será o número 1 e cada novo candle será aumentado em 1 nesta contagem.
Parâmetros de entrada Escolha entre par, ímpar ou todos Distância do Candle para imprimir o número Tamanho da fonte do texto Cor da fonte do texto Se você ainda tiver dúvidas, entre em contato comigo por mensagem direta: https://www.mql5.com/pt/users/robsjunqueira/
FREE

KT XMaster Formula is a buy & sell signal indicator that works magically on most of the timeframes and currency pairs when used correctly.
The indicator uses calculations based on moving averages, RSI, and MACD. It is usually appropriate for scalping and trend trading - whether you are a novice or an experienced trader, the signals generated by this indicator are simple to understand and implement.
Overview The indicator comprises green and red dots arranged in wavy lines. These dots corre

Divergence is one of the vital signals that depicts the upcoming price reversal in the market. KT Stoch Divergence shows the regular and hidden divergences build between the price and stochastic oscillator.
Limitations of KT Stoch Divergence
Using the Stochastic divergence as a standalone entry signal can be risky. Every divergence can't be interpreted as a strong reversal signal. For better results, try to combine it with price action and trend direction.
Features
Marks regular and hidde

Simplify your trading experience with Trend Signals Professional indicator. Easy trend recognition. Precise market enter and exit signals. Bollinger Bands trend confirmation support. ATR-based trend confirmation support. (By default this option is OFF to keep interface clean. You can turn it ON in indicator settings.) Easy to spot flat market conditions with ATR-based trend confirmation lines. Highly customizable settings. Fast and responsive. Note: Do not confuse ATR-based trend confirmation
FREE

MACD (short for Moving Average Convergence/Divergence) is one of the most famous and oldest indicators ever created and is widely used among beginners . However, there is a newer version of the MACD that is named Impulse MACD which have less false signals than the standard MACD. Classic MACD helps us to identify potential trends by displaying crossovers between two lines. If MACD line crosses above the Signal line it shows us that the market is potentially up trending and that

MACD divergence indicator finds divergences between price chart and MACD indicator and informs you with alerts (popup, mobile notification or email) . Its main use is to find trend reversals in the chart. Always use the divergence indicators with other technical assets like support resistance zones, candlestick patterns and price action to have a higher possibility to find trend reversals. Three confirmation type for MACD divergences: MACD line cross zero level Price returns to previous H/L Crea
FREE
Bem-vindo ao indicador de reconhecimento avançado de padrões Gartley Este indicador detecta o padrão Gartley com base em HH e LL da estrutura de preços e nos níveis de Fibonacci, e quando certos níveis de Fibonacci são atingidos, o indicador mostrará o padrão no gráfico. Versão MT4: WH Advanced Gartley Pattern MT4 **Este indicador faz parte do combo Ultimate Harmonic Patterns MT5 , que inclui todo o reconhecimento de padrões.**
Características : Algoritmo avançado para detecção do pad
FREE

O indicador constrói um semáforo de três períodos e um padrão de reversão 123 a partir do extremo. O sinal surge na abertura da segunda vela. Este padrão pode ser negociado de diferentes maneiras (ponto de teste 3, fuga e outros). A saída do canal ou o rompimento da linha de tendência é o principal gatilho para encontrar um ponto de entrada. Os ícones são coloridos de acordo com os níveis de Fibonacci. Os ícones amarelos indicam um teste de um nível em que o sinal é amplificado. Utilizando o pa

Modified oscillator MACD. A classic indicator that combines a trend indicator with an oscillator to detect entry points. Has a multi-timeframe panel and 3 types of notifications
Benefits:
Works on all instruments and timeseries Trend indicator with oscillator for inputs Multi-period panel on all timeframes Pluggable arrows when signals appear Three types of notifications: push, email, alert
MT4 version -> HERE / Our news -> HERE
How the indicator works:
AW Classic MACD - Indica
FREE

Hull Moving Average (HMA) is well-deservedly popular among traders because of the effective averaging of market noise and a relatively small delay. The current MetaTrader 5 version changes its color when the movement direction changes. Sound and text signals are available. It also supports sending email and push messages. It is possible to trigger a signal on the current incomplete bar, although such a signal may be canceled before completion if conditions are no longer appropriate. One of the p
FREE

Cybertrade Auto Fibonacci retração e projeção - MT5
##### Indicador Gratuito por tempo indeterminado. #####
O Fibonacci automático é um indicador que traça automaticamente a retração e projeção de Fibonacci com base no número de barras que você seleciona na configuração do indicador. Estão disponíveis 9 níveis diferentes para retração e 3 níveis para projeção que podem ser customizados conforme desejado. Funciona em períodos maiores do que o período visível no gráfico. Todos os valores
FREE
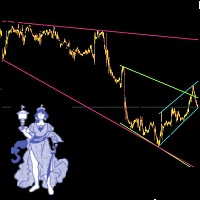
Leave a comment if you would like me to write an EA to trade these trendlines... if enough interest, will write an EA. Automatic Trendlines, updated automatically. To Set up 3 different (or mroe) Trendlines on chart, simply load the indicator as many times and name it differntly.. the example in the picture below is indicator 1 (loaded 1st time): Name: Long, StartBar: 50, BarCount: 500, Color: Pink indicator 2 (loaded 2nd time): Name: Short, StartBar: 20, BarCount: 200, Color: Green indicator 3
FREE

Este indicador encontra e exibe os padrões de análise técnica de fundo duplo e topo duplo. Sinais (exibe uma mensagem na tela) se a forma foi formada recentemente. Freqüentemente, após o aparecimento desses padrões, a tendência se inverte ou ocorre uma correção. Para não procurá-los você mesmo, ou para não perder o seu aparecimento, basta adicionar um indicador ao gráfico. O indicador pode ser usado em diferentes prazos e pares de moedas, há configurações para uma melhor busca em um determinado
FREE

Golden Star MT5 é um indicador de tendência profissional para a plataforma MT5 desenvolvido por um grupo de traders profissionais. O algoritmo de seu trabalho é baseado no método do autor original, que permite encontrar potenciais pontos de reversão de tendência com alta probabilidade e receber sinais de entrada no mercado no início da formação de uma tendência. Este indicador é adequado para trabalhar com ouro, criptomoeda e pares de moedas no Forex. O sistema de alerta (alerta, e-mail e notifi

Esta VWAP é uma VWAP simples, porém colocamos alertas nela para você saber quando o preço tocar na VWAP simplesou quando o preço cruzar a VWAP. Este indicador é um indicador de VWAP tradicional para o MetaTrader 5 (MT5). Os parâmetros padrão são os da VWAP normal, mas você tem a capacidade de usar novos cálculos e o melhor: Quando o preço tocar ou cruzar a VWAP, e você ficará sabendo por meio de alertas, notificações de celular, e-mail ou eventos sonoros. indicador gratuito de VWAPs ancoradas pa
FREE

Este indicador foi projetado para tornar as revisões de muitos gráficos em diferentes escalas de tempo mais rápidas e fáceis de fazer. Acompanhe o tempo e o preço em vários gráficos Alterar símbolo em um gráfico e todos os outros gráficos do mesmo símbolo também serão alterados. Fácil de usar, rápido para dominar O indicador permite identificar o preço e a hora em que o ponteiro do mouse está no gráfico atual, em todos os outros gráficos abertos no mesmo Símbolo. Isso permite que você veja rapid

Este é um indicador de seguimento de tendências com base no MACD, fornecendo sinais de compra quando acima dos 200 MA e sinais de venda quando abaixo. O sinal é gerado quando o MACD cruza a linha zero. O indicador também exibe um nível de suporte e resistência que pode ser usado como stop loss. Parâmetros ajustáveis incluem período da MA, EMA rápido do MACD, EMA lento e intervalo de suporte-resistência. Ele plota nos pontos mais baixos e mais altos das velas recentes. Configurações padrão: Inter
FREE

Multicurrency and multitimeframe modification of the ZigZag indicator. Displays the current direction of the market, the height of the last movement, the number of bars in this movement and the breaking of the previous point of the ZigZag (horizontal line). This is MTF Scanner.
You can specify any desired currencies and timeframes in the parameters. Also, the panel can send notifications when the ZigZag changes direction or when there was a breakthrough of the previous point. By clicking on a

Você conhece o VWAP Bands? É um indicador utilizado para identificar pontos de suporte e resistência a partir da VWAP diária e é possível usá-lo para verificar os melhores pontos de entrada e saída de posição. Este indicador não usa o princípio das bandas de bollinger. Há uma diferença na forma de cálculo. Utilize conforme sua estratégia. Veja as aplicações e quais os resultados que poderás obter. O indicador é gratuito e pode ser usado em qualquer conta.
FREE

Os sinais de entrada de atirador MFI e RSI para sintéticos Boom e Crash vêm com poderosos sistemas de alerta de entrada e, para sinais de filtro mais avançados, considere o Harmonic Hybrid Pilot Pro. Ao negociar Spikes, você tem três ordens colocadas logicamente para distribuir o risco e a terceira ordem é finalmente próximo da maior probabilidade de um pico. Os sinais são invalidados quinze minutos após a ordem final e as perdas devem ser fechadas imediatamente. Para Tp, recomendo que você saia
FREE

O indicador Magic Histogram MT5 é uma ferramenta universal, adequada para escalpelamento e negociação de médio prazo. Este indicador usa uma fórmula inovadora e permite determinar a direção e a força da tendência. Magic Histogram MT5 não é redesenhado, então você pode avaliar sua eficiência usando dados de histórico. É mais adequado para M15, M30, H1 e H4.
Benefícios do Indicador Excelentes sinais indicadores! Adequado para iniciantes e comerciantes experientes. Usando as configurações flex

Introduction
The Bounce Zone indicator is a cutting-edge non-repainting technical tool built to identify key areas on the price chart where market sentiment is likely to cause a significant price reversal. Using advanced algorithms and historical price data analysis, this indicator pinpoints potential bounce zones. Combined with other entry signal, this indicator can help forex traders place the best trades possible
Signal
A possible buy signal is generated when price is in the green zo
FREE
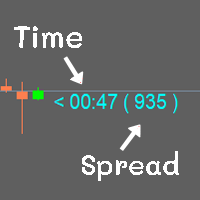
Show the time of candlesticks and spread. All data will be displayed in a rod. Can change color Can fix the size as needed
MT4 : Link https://www.mql5.com/en/market/product/102742 MT5 : Link https://www.mql5.com/en/market/product/102834
Most free code on various websites I didn't write it myself. I only do a little bit.
If you like it, please give 5 stars with it. Thank you.
FREE

The worktime indicator helps you identify the most important times to day to trade the currency pairs. It was created based on the ICT day trading free tutorials that are freely vailable on his youtube channel. You can use this indicator together with my other indicators that i have shared freely with you like the true day, custom periods, daily month, weekly open lines - they together complement each other very well.
Nuggets from this indicator: 1. Draws the asian session box showinng you th
FREE

The Expert Advisor for this Indicator can be found here: https://www.mql5.com/en/market/product/115445 The Break of Structure (BoS) and Change of Character indicator is a powerful tool designed to identify key turning points in price movements on financial charts. By analyzing price action, this indicator highlights instances where the market shifts from a trend to a potential reversal or consolidation phase.
Utilizing sophisticated algorithms, the indicator identifies breakouts where the str
FREE

Indicador MACD Sniper que foi melhorado por vários métodos. existe um filtro adicional é suavizado várias vezes para obter o máximo de resultados um indicador de volume também é adicionado a ele para exibir com mais precisão as informações sobre o mercado e a condição atual do preço Eu aconselho você a usar o indicador nos períodos de tempo de m1 a m30, pois está configurado para prazos de curto prazo Eu aconselho você a negociar em pares de moedas altamente voláteis, por exemplo, como eur.usd -
FREE

This indicator automatically identifies demand and supply zones on a number of 1000 candles or more, and you can change that number of settings.
It also carries a high level of accuracy in describing the type of each zone, as it contains:
Weak areas .
Untested areas . Strong areas . Role-taking areas . Areas tested + number of times visited . Areas to which a return is expected, depending on the direction . The indicator contains alert zones.
For signals and more free indicators, you ca
FREE

Supply or demand zones refer to price areas where a significant amount of supply or demand had previously entered the market, causing prices to either fall or rise. If the price returns to the demand or supply zone, it is likely to bounce off due to the large number of orders previously placed within the zone. These orders will be defended in these areas.
The Fair Value Gap (FVG) is a concept used to identify imbalances in the equilibrium of buying and selling. Fair Value Gaps are formed in a

Volume Weighted Average Price (VWAP) The volume weighted average price (VWAP) is a trading benchmark used by traders that gives the average price a security has traded at throughout the day, based on both volume and price. It is important because it provides traders with insight into both the trend and value of a security. This indicator VWAP V2 is free and is the manual version of the extended Easy VWAP indicator (30 Euro), where the date and time properties are automatically entered. Wit
FREE

The indicator looks for consolidation (flat) in the market at a certain time, builds a box-channel and marks levels indented from it for a breakdawn. After crossing one of the levels, the indicator marks the zone for take profit and calculates the corresponding profit or loss in the direction of this entry on the panel. Thus, the indicator, adjusting to the market, finds a flat area of the market, with the beginning of a trend movement to enter it. Version for MT4: https://www.mql5.com/en/market
FREE

This Engulfing Candle Indicator as the name implies can detect engulfing candlestick patterns on the chart. The indicator alerts the user of the presence of an engulfing candle (Bearish engulfing candle and Bullish engulfing candle) by using visual representation of arrows on the chart. - Blue arrow for Bullish engulfing - Red arrow for Bearish engulfing Extra modifications can be added based on request.
FREE

This indicator allows to display Renko charts in the indicator window. Renko charts show only price movements that are bigger than the specified box size. It helps to eliminate noise and allows to focus on main trends.
Time is not a factor here. Only price movements are taken into account. That's why Renko chart is not synchronized with the main chart it is attached to. Indicator works in two modes: CLOSE - only close prices are taken into account while building the chart HIGH_LOW - only high/
FREE

The indicator analyzes the volume scale and splits it into two components - seller volumes and buyer volumes, and also calculates the delta and cumulative delta. The indicator does not flicker or redraw, its calculation and plotting are performed fairly quickly, while using the data from the smaller (relative to the current) periods. The indicator operation modes can be switched using the Mode input variable: Buy - display only the buyer volumes. Sell - display only the seller volumes. BuySell -
FREE
Introduction to the Candle Time Indicator The Candle Time Indicator for MetaTrader 5 (MT5), helps users know how much time on a candlestick is remaining. This is a simple but incredibly powerful and useful tool. To download the Dagangduit CandleTimer.ex5 indicator, check the bottom of this post. It’s one of the best forex time indicators in its category. The function of the indicator will not change, even if you change the name of the indicator. The candlestick countdown timer will tell you how
FREE
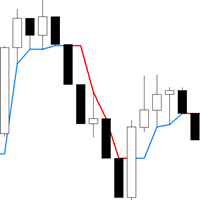
Indicador de acompanhamento de tendências para ajudá-lo na negociação, análise ou gerenciamento de riscos de tendências.
Sem repintura e funciona em todos os prazos.
Sistema de alerta robusto
Benefícios:
Nunca redesenha os resultados, o sinal está estritamente no fechamento da vela Pode ser usado em um consultor Um ótimo complemento para uma estratégia de negociação ou estratégia independente Algoritmo de filtragem de ruído de mercado Adequado para qualquer ferramenta Por que escolher o
FREE
MT4 Version Available Here: https://www.mql5.com/en/market/product/43528
Telegram Channel & Group : https://t.me/bluedigitsfx
V.I.P Group Access: Send Payment Proof of any of our Paid Products to our Inbox
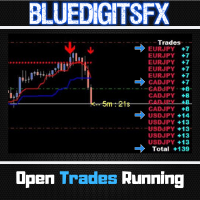
Recommended Broker: https://eb4.app/BDFXOsprey * The Most Sought After Pip Counter for Metatrader ! Features
Will show Currency Symbol in BLUE for Buy positions. Will show Currency Symbol in RED for Sell positions. Will Show pips in BLUE Color for Positive Pips Will Show pips in
FREE

FOR CRASH 500 ONLY!! MT5
*This is a smooth heiken ashi setup meant to be used on CRASH 500 in combination with other indicators. *You are welcome to test it on other markets aswell. *I will be posting other indicators aswell to help with trading the crash 500 market. *You can use this to help smooth out price if you do struggle with reading the charts as is. * Just note heiken ashi doesnt represent real price action only smoothes it out for ease of read.
FREE

"Hunttern harmonic pattern finder" base on the dynamic zigzag with the notification and prediction mode
This version of the indicator identifies 11 harmonic patterns and predicts them in real-time before they are completely formed. It offers the ability to calculate the error rate of Zigzag patterns depending on a risk threshold. It moreover sends out a notification once the pattern is complete.
The supported patterns:
ABCD BAT ALT BAT BUTTERFLY GARTLEY CRAB DEEP CRAB CYPHER SHARK THREE
FREE

To download MT4 version please click here . - This is the exact conversion from TradingView: "Linear Regression Candles" By "ugurvu". - The overall look of the indicator is like Heiken Ashi. - It can be used as a trend confirmation indicator to detect the right trend direction. - This indicator lets you read the buffers for Candles' OHLC. - This is a non-repaint and light processing load indicator - You can message in private chat for further changes you need. Thanks

Contador de velas Este indicador conta as velas e exibe os números delas com base em um período de tempo mais longo Com este contador de candles, você pode saber quantos candlesticks há desde o ultimo ciclo de tempo maior Barras dentro de um timeframe maior Você pode escolher o período diário como " Bigger Timeframe " e executá-lo em qualquer gráfico que tenha o menor período de tempo. que o contador contará as barras de acordo com o gráfico diário . Se você passar o timeframe " H1 " como parâme
FREE

Quer tornar-se um comerciante forex de 5 estrelas constantemente lucrativo? 1. Leia a descrição básica do nosso sistema de negociação simples a sua principal actualização estratégica em 2020 2. Envie uma imagem da sua compra para obter o seu convite pessoal para o nosso chat comercial exclusivo
Lighthouse é um incrível indicador preciso e fiável de apoio e resistência.
Apresenta os níveis comerciais mais importantes e desenha-os de acordo com a sua relevância.
Se um nível for
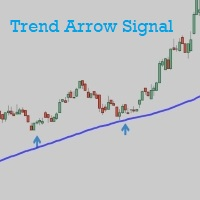
Trend Arrow Signal gives buy/sell signals and alerts with up and down arrow at potential reversal of a pullback or a trend continuation pattern. As the name indicated, this is an indicator which gives signals based on trend => It works best in trend market with the principle is to ride on the trend not trade against the trend. The main trend is determined by EMA 50 and can be changed manually to suit your preference. Trend arrow signal can work on all time frames. It gives signal at close of th
FREE

The DR IDR Range Indicator PRO plots ADR, ODR and RDR ranges for a given amount of days in the past. A key feature that appears is that it calculates the success rate of the ranges for the shown days. This indicator is perfect for backtest since it shows ranges for all of the calculated days, not just the most recent sessions. In the PRO version you can now: use fully customizable advanced statistics to base your trades on get an edge via calculating statistics on up to 3 different day period

For those who struggle with overbloated Volume Profile/Market Profile indicators, here is a solution that contains only the Point of Control (POC) information. Super-fast and reliable, the Mini POC indicator presents this vital information visually within your chart. Totally customizable in splittable timeframes, type of Volume, calculation method, and how many days back you need.
SETTINGS Timeframe to split the POCs within the day. Volume type to use: Ticks or Real Volume. Calculation method
FREE

RubdFx Perfect Reversal , The reversal indicator is used to determine areas of support and resistance by Drawing an arrow with a level of supply and demand ( ReversalZones ). - You will catch more swings by reducing the period, and less swings if you increase period - Mobile, computer and email alerts available . it is not pushed by price which means the arrow will stay in one place,suitable for scalping and long term trading Also Compatible with all forex paris , BUY RULES; open a buy positio

Negociação dinâmica:
1.pp pivot
2. r1 r2 r3, s1 s2 s3 Necessary for traders: tools and indicators Waves automatically calculate indicators, channel trend trading Perfect trend-wave automatic calculation channel calculation , MT4 Perfect trend-wave automatic calculation channel calculation , MT5 Local Trading copying Easy And Fast Copy , MT4 Easy And Fast Copy , MT5 Local Trading copying For DEMO Easy And Fast Copy , MT4 DEMO Easy And Fast Copy , MT5 DEMO
Cooperação QQ: 556024 "
Coop
FREE

Was: $69 Now: $34 Blahtech VWAP - Volume Weighted Average Price (VWAP) is the ratio of price to total volume. It provides an average price over a specified time interval. Links [ Install | Update | Documentation ] Feature Highlights
Configurable VWAP Line Sessions, intervals, anchored or continuous Previous day settlement line Standard Deviation bands Alerts at bar close or real time Automatic Broker or Tick volumes Significantly reduced CPU usage
Input Parameters
Expert Advisor

A representação duma vela Heikin Ashi padrão tem um valor de abertura equivalente a uma média móvel exponencial (EMA) do Preço Total , do qual o valor de alfa do EMA é fixo em 0,5 (equivalente a um período EMA de 3,0). Nesta versão dinâmica, o período pode ser alterado para qualquer valor que se queira usar, o que também permite uma análise aproximada de vários períodos de tempo ou o uso dum valor baixo ou alto como uma espécie de stop-loss . O cruzar do preço real de fechamento sobre o valor de
FREE

Fair Value Gaps (FVG) and Liquidity Voids are price ranges you can exploit for better entries and exits on your trades. They're similar concepts, so let's look at them from the top and break it down. Think of FVG and Liquidity voids as soft-spots in the market. They are paths of least resistance. That doesn't mean price will go through them, but price could go through them more easily.
To find and locate it is easy but tidiest to repeat the same thing all over again. This helps to boost your
FREE

Este é um indicador muito simples e fácil de usar para todos. No entanto, é muito visual, útil e eficaz. É adequado para todos os símbolos Forex e qualquer período de tempo. Mas, com base em meus testes e investigações, não recomendo usá-lo com os prazos M1, M5, M15. Contexto. - Escolha alerta On/Off (padrão ON). - Selecione o tempo (segundos) entre 2 alertas. O padrão é 30 segundos Como funciona? - Uptrend—Quando a cor da barra é verde. - Tendência de baixa—Quando a cor da barra é laranja. - U
FREE

Necessary for traders: tools and indicators Waves automatically calculate indicators, channel trend trading Perfect trend-wave automatic calculation channel calculation , MT4 Perfect trend-wave automatic calculation channel calculation , MT5 Local Trading copying Easy And Fast Copy , MT4 Easy And Fast Copy , MT5 Local Trading copying For DEMO Easy And Fast Copy , MT4 DEMO Easy And Fast Copy , MT5
DEMO
砖图 Renko PRO->>>
The display of the brick map on the main map.
The Renko chart ideal
FREE
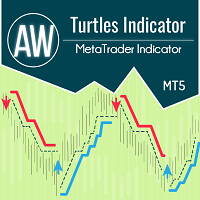
O indicador funciona de acordo com o sistema Turtle e classicamente assume um intervalo de tempo de 20 e 55 velas. Uma tendência é monitorada durante um determinado intervalo de tempo. A entrada é feita no momento da quebra do nível de suporte ou resistência. O sinal de saída é um rompimento de preço na direção oposta da tendência do mesmo intervalo de tempo. Vantagens:
Instrumentos: pares de moedas, ações, commodities, índices, criptomoedas Prazo: Classicamente D1, também adequado para traba
FREE

Advanced Stochastic Scalper MT5 is a professional indicator based on the popular Stochastic Oscillator. Advanced Stochastic Scalper is an oscillator with dynamic overbought and oversold levels, while in the standard Stochastic Oscillator, these levels are static and do not change. This allows Advanced Stochastic Scalper to adapt to the ever-changing market. When a buy or a sell signal appears, an arrow is drawn on the chart and an alert is triggered allowing you to open a position in a timely ma

non-repaint free MT5 technical indicator works on all timeframes 1 minute to the monthly timeframe the trade vision buy and sell arrow is a multi currency and synthetic indicator Trade vision buy and sell arrow comes with Push Alerts purple arrow look for selling opportunities white arrow look for buying opportunities. wait for candle to close and arrow to appear before taking any trades.
FREE

Boom and crash Gold Miner v2 trend histogram which works in conjunction with the indicator above that has arrows as shown in the video. PLEASE Note: That the top indicator and the bottom indicator are two separate indicators. the top indicator is https://www.mql5.com/en/market/product/98066 the bottom one is free. which is the histogram at the bottom. the trend histogram trading tool that helps to easy detect the trend blue color indicates an uptrend. Orange color is a down trend.
FREE

This is Wilder's ADX with cloud presentation of DI+ & DI- lines. Features
4 standard lines of the ADX indicator: DI+, DI-, ADX, ADXR cloud presentation of DI+/DI- lines with transparent colors applicable to all time-frames and all markets
What Is ADX
J. Welles Wilder Jr., the developer of well-known indicators such as RSI, ATR, and Parabolic SAR, believed that the Directional Movement System, which is partially implemented in ADX indicator, was his most satisfying achievement. In his 1978 boo
FREE

Este é um indicador de volume convencional, que exibe o volume de ticks ou o volume real (se disponibilizado pela sua corretora). Porém ele tem outros recursos como: 5 esquemas de cores: única, ao cruzar com média móvel, ao cruzar um nível especificado, ao ter diferença de volume entre as barras e conforme a cor das velas. Poder ter uma média móvel personalizável. Poder ter a linha indicativa de valor. Agradeço ao Diego Silvestrin pelas ideias da versão 1.1 e ao Konstantin Demidov pela sugest
FREE

Description Helps you detect the structure of the market, using different types of Smart Money concepts. This should help you to upgrade your trading strategy in every way. Smart Money Features: Color candle to signal the type of structure Shows CHOCH and BOS Equal Lows and Highs Order Blocks Internal and Swings Weak and strongs high and lows Fair Value Gaps High and Lows in daily weekly and monthly timeframes Premium and discount Zones KEY LINKS: How to Install – Frequent Questions - All

The indicator works to convert normal volume into levels and determine financial liquidity control points.
It is very similar in function to Fixed Volume Profile.
But it is considered more accurate and easier to use than the one found on Trading View because it calculates the full trading volumes in each candle and in all the brokers present in MetaTrade, unlike what is found in Trading View, as it only measures the broker’s displayed prices.
To follow us on social media platforms:
tel
FREE

The Inversion Fair Value Gaps (IFVG) indicator is based on the inversion FVG concept by ICT and provides support and resistance zones based on mitigated Fair Value Gaps (FVGs). Image 1
USAGE Once mitigation of an FVG occurs, we detect the zone as an "Inverted FVG". This would now be looked upon for potential support or resistance.
Mitigation occurs when the price closes above or below the FVG area in the opposite direction of its bias. (Image 2)
Inverted Bullish FVGs Turn into P

This is just a MACD with multi symbols, multi timeframes, and multi colors. features. different symbols and timeframes from the main chart. draw main line, signal line, and histogram. each line can be erased. the ascent and descent can be distinguished. Due to the above features, this MACD is suitable for multiple lineups in a single chart. This can be used in the same way as MiniCandles.
FREE

Spike Catch Pro 22:03 release updates Advanced engine for searching trade entries in all Boom and Crash pairs (300,500 and 1000)
Programmed strategies improvements Mx_Spikes (to combine Mxd,Mxc and Mxe), Tx_Spikes, RegularSpikes, Litho_System, Dx_System, Md_System, MaCross, Omx_Entry(OP), Atx1_Spikes(OP), Oxc_Retracement (AT),M_PullBack(AT) we have added an arrow on strategy identification, this will help also in the visual manual backtesting of the included strategies and see h
FREE
Você sabe por que o mercado MetaTrader é o melhor lugar para vender as estratégias de negociação e indicadores técnicos? Não há necessidade de propaganda ou software de proteção, muito menos problemas de pagamentos. Tudo é providenciado no mercado MetaTrader.
Você está perdendo oportunidades de negociação:
- Aplicativos de negociação gratuitos
- 8 000+ sinais para cópia
- Notícias econômicas para análise dos mercados financeiros
Registro
Login
Se você não tem uma conta, por favor registre-se
Para login e uso do site MQL5.com, você deve ativar o uso de cookies.
Ative esta opção no seu navegador, caso contrário você não poderá fazer login.