Conheça o Mercado MQL5 no YouTube, assista aos vídeos tutoriais
Como comprar um robô de negociação ou indicador?
Execute seu EA na
hospedagem virtual
hospedagem virtual
Teste indicadores/robôs de negociação antes de comprá-los
Quer ganhar dinheiro no Mercado?
Como apresentar um produto para o consumidor final?
Novos Indicadores Técnicos para MetaTrader 5 - 8

Do you believe that financial markets and celestial bodies operate in separate realms? Our indicator begs to differ! Based on the innovative theory of William Gann, which emphasizes the influence of celestial planet movements on financial market dynamics, we present to you the "Gann Planetary Lines Indicator". Features of the Indicator : Precision : Accurate projection of the 360 degrees of planetary orbits onto price charts. Advanced Customization : Ability to display or hide any planet line,
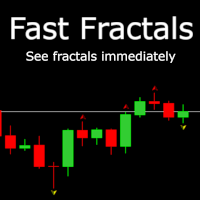
Info: It's like built in Fractals indicator but faster. Usually it shows the signal after 2 bars but FastFractals indicator shows signals immediately and that's is incredible. You can create scalp strategies with it or trade yourself. This indicator uses neural network to analyze price graph and predict. It was trained on 4 hours interval on EURUSD pair, but you can use it with different periods and instruments. There is only one minus in this indicator, it hasn't got 100% accuracy. See pictures

The " Pure View " indicator is designed to quickly display and hide indicators on the chart. Description
1. Currently Pure View works with Stochastic, MACD, RSI indicators 2. Displaying and hiding indicators occurs using hot keys 3. The key combination Shift + C will display or hide the "Stochastic" indicator on the chart 4. The key combination Shift + V will display or hide the "RSI" indicator on the chart 5. The key combination Shift + B will display or hide the "MACD" indicator on the chart
FREE

"Moving Ratio Candle" serve para verificar o quão distante uma vela de um ponto de pressão teórico. Além disso, temos dois limitadores o primeiro pela média e o segundo pela mediana. O desenho do indicador é em formato de barra e a linha que cruza cortando a barra da esquerda para direita é a partir do calculo do fechamento para ambos os lados. O resto segue um calculo mais padrão. O mesmo poderia ser feito como linha, mas eu quero saber o comportamento desse indicador em relação a vela de preço
FREE

O "ZScore Quantum Edge" é baseado em um algoritmo avançado que combina análise de volume e movimento de preços, proporcionando uma representação clara e precisa das tendências do mercado. Seu design intuitivo, com uma interface de fácil compreensão, exibe informações em tempo real. Características principais: Análise de Tendência Aprofundada : O indicador utiliza um período configurável para análise de tendência, permitindo que os traders ajustem a sensibilidade do indicador de acordo com suas e

Princípio de Funcionamento: O "RSDForce" combina análises de volume de negociação e movimentos de preço para fornecer insights valiosos sobre o mercado. Ele funciona assim: Análise de Volume e Preço : O indicador analisa o volume de negociação (quantidade de ativos negociados) e as variações de preço ao longo do tempo. Cálculo de Força de Mercado : Ele calcula um valor que reflete a 'força' do mercado, indicando se a tendência de preço é forte e se baseia em um volume de negociação substancial.

"Introducing Dynamic Supply and demand Pro – Your Ultimate Supply and Demand Trading Companion! Unleash the power of precision with this advanced indicator designed for traders seeking unparalleled market insights. Dynamic Supply and demand Pro dynamically identifies key reversal zones, showcasing the delicate dance between supply and demand forces.
This cutting-edge tool provides a comprehensive view of the market, highlighting potential turning points with pinpoint accuracy. Witness the ebb

McS Super Trend -This is one of the most popular classic trend indicators. It has a simple setting, allows you to work not only with the trend, but also displays the stop loss level, which is calculated by this indicator. Benefits:
Instruments: Currency pairs , stocks, commodities, indices, cryptocurrencies. Timeframe: М15 and higher. Trading time: Around the clock. Shows the direction of the current trend. Calculates the stop loss. It can be used when working with trading. Three types of n
FREE
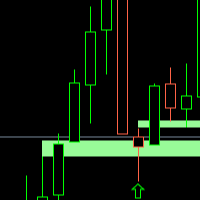
FVG WATCHER is an indicator that helps traders identify fair value gaps in the market. The indicator draws fair value gaps and alerts the user when the fair value gap has been swept. It allows users to specify how it should be swept, what time range to alert, and the size of the fair value gap to alert. It also allows the user to apply a moving average trend filter for better choice of alerts. The indicator also allows push mobile notifications. What makes FVG Watcher special is that it can be

Tatino Super Signals is Non Repaint Indicator for Binary Option trading and Forex trading. Recommendations:
Timeframe: All timeframes. For best results we recommend using it on M1, M5 and M15 timeframes. Currency pairs: All Pairs Account type: All Type Broker time: Any Brokers : Alls Binary Trading : Expired 1 Candle Buffer Buy=1, Sell=0, Entry Next Candle Recommended Forex trading stop loss : 15 pips Recommended Forex tradingTake profit levels : 15 pips
Specifications:
Does not repaint
O indicador grafico de rompimento foi desenvolvido para elevar a precisão e confiabilidade na identificação de oportunidades de rompimento no mercado financeiro. Projetado com algoritmos avançados, este indicador destaca barras de rompimento com uma precisão notável, permitindo que traders identifiquem pontos de entrada e saída estratégicos. Recursos Principais: Precisão Aprimorada: Utiliza algoritmos avançados para identificar barras de rompimento com uma precisão excepcional. Alertas em Tempo
FREE

MT5 Candlestick Pattern Alert Indicator: Enhance Trading Precision and Speed Overview The MT5 Candlestick Pattern Alert Indicator stands as a robust solution tailored to empower traders by swiftly detecting candlestick patterns and delivering timely alerts through various channels. This advanced tool facilitates efficient analysis of patterns, enabling traders to seize potential profitable trades promptly. Significance of Candlestick Patterns Candlestick patterns play a pivotal role in technical

RFX5 Bull Bear Powers indicator shows the absolute power of bulls and bears controlling the market. Both powers are shown simultaneously with red and green colors for bear and bull powers respectively. When red line goes over the green line it means that bears are controlling the market. When green line goes over the red line it means that bulls are controlling the market. The green/red horizontal symbol line at the bottom of the indicators shows which party has more strength. Time Frame: M3
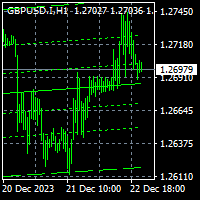
To get access to MT4 version click here . This is the exact conversion from TradingView: "Linear Regression Channel" by "LonesomeTheBlue". This is a repaint indicator. Buffers are not available for processing. You need to parse objects on chart. All input fields are available. You can message in private chat for further changes you need. Thanks for downloading

Right hand очень точно воспроизводит колебания цены. Когда рынок растет, кривая Right hand идет вверх. Хотя иногда бывает так, что кривая идет вверх, в то время как цена консолидируется и нет тренда вверх. Аналогично, когда рынок падает, кривая тоже убивает, исключения возникают так же в зоне консолидация рынка. Анализ большого количества графиков Индекса Направленнрго Тренда ( DTI )позволяет выявить его специальные характеристики, полезные при отслеживании тренда. В положительной области т.е

移動平均線の傾斜角度をラベルに表示するだけのシンプルなインジケーターです。ラベルのフォントサイズ、色の調整、移動平均線の設定など全て行えます。また、移動平均線の傾斜角度というものは、MT5のウインドウサイズを変更すると、移動平均線自体の傾斜角度も変更されてしまうことをご了承ください。これは、インジケーターの仕様ではなく、移動平均線の傾斜角度というもの自体の仕様です。
また、MT5には、OnCalculateから値を取得してしまうと、インジケーターを削除する際にオブジェクトが残ってしまうという公式のバグが存在します。その為、当インジケーターでは、OnCalculateから移動平均線の傾斜角度の値を取得し、それを、OnTimer関数で1秒毎に評価し、オブジェクトに傾斜角度を出力しております。なので、傾斜角度の出力レベルはほぼティック毎と変わりませんことをご理解下さい。
また、今後のアップデートで、時間足毎に移動平均線の傾斜角度を評価できるようアップデートして参ります。

O indicador básico de oferta e procura é uma ferramenta poderosa concebida para melhorar a sua análise de mercado e ajudá-lo a identificar áreas-chave de oportunidade em qualquer gráfico. Com uma interface intuitiva e fácil de usar, este indicador Metatrader gratuito dá-lhe uma visão clara das zonas de oferta e procura, permitindo-lhe tomar decisões de negociação mais informadas e precisas / Versão MT4 gratuita
Dashboard Scanner para este indicador: ( Basic Supply Demand Dashboard )
FREE

O Ai Trend Spotter (D Originais).
A queda do Forex.
Muitas vezes perguntamos “Como a Corretora ganha dinheiro ?”, e celebramos quaisquer pequenas negociações vencedoras do nosso lado.
Mas depois de usar (D Originals) você se perguntará "Como fiquei rico da noite para o dia?".
Tão profundo, a ação fala mais alto que a voz.
Com o Ai Trend Spotter, não tenha medo de:
*Manipulação de Mercado
*Reversão de mercado
* Entrada e existência de atirador
* Salto de vela
O indicador

This is the best Support and Resistance Indicator on the market, and it shows both confirmed Support and Resistance as well as Retests. Support & Resistance: Support marks where buying demand halts price declines, acting as a safety net. Resistance caps price surges, driven by selling pressure. Traders leverage these levels to predict reversals, plan entries, exits, and manage risks, making them trading's fundamental guideposts. You can also find Premium and Discount Levels, Strong High/Low,
FREE

Este painel descobre e apresenta as zonas de oferta e procura no gráfico, tanto no modo de escalpelamento como de longo prazo, dependendo da sua estratégia de negociação para os símbolos seleccionados. Além disso, o modo de scanner do painel de controlo ajuda-o a verificar todos os símbolos desejados num relance e a não perder nenhuma posição adequada / Versão MT4 Indicador gratuito: Basic Supply Demand
Características
Permite-lhe ver oportunidades de negociação em vários pares

This is a simple order block locator. Searched for the existence of order blocks only at extremums. If you want multi criteria order block location check my other indicator which is more powerful here These order blocks are ICT order blocks without any buttering.
The indicator can be a useful tool for detecting reversals, continuations. You can also use the indicator as confluence with your other tools
FREE

Se você chegou até aqui, é porque já conhece a versão gratuita do Scanner de estratégias . E também, você quer aquela ferramenta com alertas, porque é importante para você: alertas no MetaTrader alertas no celular alertas ou no e-mail alertas sonoros Esses alertas sempre vão te notificar quando uma seta diferente surgir no ativo na linha do seu Rule Plotter Scanner. Você pode escolher entre alertas sonoros, alertas no MetaTrader, alertas no seu smartphone e alertas no seu e-mail. Use todo o pode

Cobra Pivot Points é um indicador para traçar os melhores pontos de pivô otimizados, que você mesmo pode testar baixando o DEMO.
1. Selecione os dois melhores modos de pivô: Cobra Pivots ou Camrilla Pivots
2. Você pode usar qualquer período de tempo não limitado a D1.
3. Você pode brincar com o valor High Low Close do dia anterior com o parâmetro Shift. 1 = Barra anterior, 2 = Barra antes da barra anterior e assim por diante. Esses parâmetros irão ajudá-lo na pesquisa e desenvolvimento

Muitas pessoas negociam por meio de hedging. Por exemplo, uma posição longa em EURUS e uma posição curta em GBPUSD. No entanto, muitas pessoas não têm indicadores quantitativos profissionais para calcular com precisão o verdadeiro spread entre as duas variedades relacionadas. O indicador de hedge qingfeng oferece a solução perfeita para visualizar as variações reais dos spreads de duas variedades relacionadas ao longo de décadas.
É como nunca antes, totalmente original, inovador.
Permite ch

An extended version of the indicator for visualizing the time ranges of key trading sessions: Asian, European and American. The main advantage of this indicator is the automatic construction of a price profile for a trading session. The indicator has the functionality to set the start and end time of each trading session, as well as automatically determine the time zone of the trading server. The indicators include the ability to work with minimal CPU usage and save RAM. In addition, the option

The provided MQL5 indicator offers a powerful tool for traders seeking to identify potential market trends and moving average crossovers. Tailored for timeframes like M15 and H1, the indicator showcases CrossUp and CrossDn arrows, indicating the dynamic interplay between fast and slow moving averages. A State label conveys the prevailing market sentiment—bullish or bearish. Users can fine-tune moving average parameters, including period, shift, method, and applied price, catering to diverse trad
FREE

Boom and crash spike detector a highly advanced Non-repaint indicator the indicator appears on current candlestick and does not disappear for scalping use the one minute timeframe for swing trading use the hourly timeframe Made for pairs such as Boom and crash 1000 , 500 and 300 blue arrow look for buys red arrow look for sells close in profits once the spike has appeared.

An indicator for visualizing time ranges of key trading sessions: Asian, European, and American. The indicator features functionality for setting the start and end times of each trading session, as well as an adjustable timezone of the trading server. The main advantages of the indicator include the ability to operate with minimal CPU load and memory usage. Moreover, it offers the option to specify the number of displayed historical days, providing the user with flexible market dynamics analysis
FREE

This is a simple trend strenght indicator that is based on 5 moving averages on five diferente timeframes. As for now, the end user has no access to the SMA configurations but ill implement that on the future.
This indicator has 7 diferents trend indexes they are. Strong bearish, bearish, slighly bearish, normal, slighly bullish, bullish and strong bullish. You can change the gauge colors to better fit your taste and the chart background.
FREE

Stochastic indicator alerts when EA Available in comments , must have indicator installed buys stochastic main line is above signal line stochastic is below 30 rsi 5 is below 20 sell stochastic main line is below signal line stochastic is above 70 rsi 5 is above 80 ADD to chart Stochastic k 30 - d 9 - slowing 3, levels 30/70 rsi 5 lelels 20.80
Full alerts push, mobile , email ect All input settings variable feel free to contact for more information or alert sugestions
FREE

This Mt5 Indicator Signals when there is two opposite direction bars engulfed by current bar. has a recent Exponential Moving Average Cross and past bar was oversold/bought Expert Advisor Available in Comments Free Version Here : https://www.mql5.com/en/market/product/110114?source=Site  ; Full Alerts for mt5 terminal , phone , email, print to file, print to journal Buy Signal ( blue line ) Past ema cross ( set at 30 bars back ) Past bar rsi is oversold ( level 40 ) Engulfing bar closes
FREE

Double Line Donchian Channel MT5/Meta Trader 5 Indicator, this is customized Indicator to show only 2 Lines of Highest and Lowest PRICE line where you can add a MA (MOVING AVERAGE) for center line. What is Donchian Channel?
Donchian Channels are three lines generated by moving average calculations that comprise an indicator formed by upper and lower bands around a midrange or median band. The upper band marks the highest price of a security over N periods while the lower band marks the lowest
FREE

Alert Indicator for exponential moving average cross blue arrow for buy alert , fast ema 14 crosses above 50 pink arrow for sell alert , fast ema 14 crosses below 50 Default 14 ema fast & 50 ema slow add these indicators to chart Full Alerts , push, email, phone inputs for moving average lengths and alarm on off settings Please contact for help of an indicator alert suggestion
FREE

Description : Enhance Your Trading Strategy with the Advanced Vortex Indicator for MT5! Discover the power of the Vortex Indicator (VI), a robust technical analysis tool now available for MetaTrader 5. This custom-built indicator is designed to help traders identify trends and reversals, offering a critical edge in the dynamic Forex market. Key Features: Dynamic Trend Identification : With the VI's unique calculations of VI+ (positive) and VI- (negative) lines, you can easily spot trend strength
FREE

Camarilla Swing Trade Indicator is an Indicator. Support and resistance points are calculated from the High Low Close of the previous TF Week's price.
What are Camarilla Pivot Points?
1.Camarilla Pivot Points is a modified version of the classic Pivot Point. 2.Camarilla Pivot Points was launched in 1989 by Nick Scott, a successful bond trader. 3.The basic idea behind Camarilla Pivot Points is that price tends to revert to its mean until it doesn't. 4.Camarilla Pivot Points is a mathematical
FREE

This indicator converted from 5 min Buy and Sell Range Filter - guikroth version on TradingView Popularity of the Range Filter
The Range Filter is a very popular and effective indicator in its own right, with adjustments to the few simple settings it is possible to use the Range Filter for helping filter price movement, whether helping to determine trend direction or ranges, to timing breakout or even reversal entries. Its practical versatility makes it ideal for integrating it's signals into

Hello, In this indicator, I started with a simple moving average crossover algorithm. However, in order ot get more succesfull results, I created different scenarios by basin the intersections and aptimized values of the moving averages on opening, closing, high and low values. I am presenting you with the most stable version of the moving averages that you have probably seen in any environment. We added a bit of volume into it. In my opinion, adding the Bollinger Band indicator from the ready-

Description: Unlock the power of precise trading with our Dynamic Support and Resistance Indicator for MetaTrader 5. Designed for both novice and experienced traders, this sophisticated tool offers an unparalleled edge in identifying key price levels in the market. Key Features: Customizable Lines : Easily set up to 5 support and 5 resistance lines. Customize them according to your trading strategy, whether for short-term scalping or long-term trend following. User-Friendly Inputs : Adjust the p

Key Features: Robust Algorithm: Based on John F. Ehlers’ renowned Fisher Transform formula, our indicator excels in pinpointing major price shifts, facilitating more informed trading decisions. Versatile Application: Works seamlessly with any asset, including forex, stocks, commodities, and indices, offering wide-ranging applicability for diverse trading strategies. Customizable Settings: Tailor the indicator to your trading style with adjustable parameters, including the transformation length,
FREE

Title : Ultimate Oscillator - Multi-Timeframe Momentum Indicator Description : Overview : The Ultimate Oscillator is a powerful and versatile technical analysis tool developed by renowned trader Larry Williams. This indicator is specially designed to capture market momentum across three different timeframes, providing a comprehensive view of the market's dynamics. Unlike traditional oscillators, which are confined to a single timeframe, the Ultimate Oscillator integrates short-term, medium-term,
FREE

All about time and price by ICT. This indicator provides a comprehensive view of ICT killzones, Silver Bullet times, and ICT Macros, enhancing your trading experience. In those time windows price either seeks liquidity or imbalances and you often find the most energetic price moves and turning points. Features: Automatic Adaptation: The ICT killzones intelligently adapt to the specific chart you are using. For Forex charts, it follows the ICT Forex times: In EST timezone: Session: Asia: 20h00-0
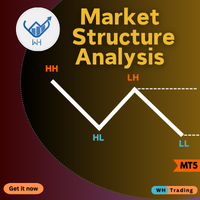
Are you tired of missing crucial market movements? Do you wish for a tool that not only identifies swing points but also provides insights into price action movements?
Look no further – our Market Structure Analysis indicator is here to revolutionize the way you analyze markets on MQL5! MT4 Version : WH Market Structure Analysis MT4 Key Features:
Swing Point Detection: Our indicator excels at identifying significant swing points in the market, helping you understand key turning points with

Our indicator will help you to make a decision whether to Buy or Sell , including where to set the Take Profit and Stop Loss . The Buy/Sell signal will not redraw nor repaint until new signal occurs. The Take Profit and Stop Loss will change following the market conditions. Our indicator will give alert to your mobile/handphone when new buy/sell signal arrive. For best result, combine this indicator with your knowledge on price action and support & resistance, also don't forget to watch for the

40% DE DESCONTO PARA O NATAL! AUMENTO DE PREÇO PARA $250 EM 1º DE JANEIRO!
Apresentando GoldenGate Entries: Uma Solução de Negociação de Ponta!
Descubra uma abordagem revolucionária para a negociação com o GoldenGate Entries (GGE), um indicador avançado projetado para elevar sua experiência de negociação. O GGE oferece um conjunto abrangente de recursos para capacitar os usuários com precisão e confiança em suas decisões de negociação.
Pares: Qualquer (FX - Commodities - Equities - Ações

Magic Candles é um novo produto que permite identificar a fase atual do mercado (tendência de alta, tendência de baixa ou flat).
Este indicador pinta barras em cores diferentes dependendo do estado atual do mercado e sinaliza ao usuário sobre mudanças de tendência com alertas.
Magic Candles é perfeito para negociar moedas (incluindo criptomoedas) e opções binárias.
Vantagens Adequado para scalping e negociação intradiária. O indicador não redesenha (recalcula), os sinais são gerados est

Introdução ao Smart Engulfing MT5:
Adentre no mundo do trading refinado com o Smart Engulfing MT5 – seu indicador profissional para identificação de padrões envolventes de alta qualidade. Desenvolvido com precisão e facilidade de uso em mente, essa ferramenta é exclusivamente criada para usuários do MetaTrader 5. Descubra oportunidades de trading lucrativas de forma fácil, já que o Smart Engulfing MT5 guia você com alertas, setas e três níveis distintos de take-profit, tornando-se o companheiro

This indicator presents an alternative approach to identify Market Structure. The logic used is derived from learning material created by DaveTeaches (on X)
When quantifying Market Structure, it is common to use fractal highs and lows to identify "significant" swing pivots. When price closes through these pivots, we may identify a Market Structure Shift (MSS) for reversals or a Break of Structure (BOS) for continuations. The main difference with this "protected" logic is in how we determine

Você já pensou em ter um scanner que escaneia todas as estratégias e mostra os pontos de compra e venda de todos os timeframes desse ativo, tudo isso ao mesmo tempo? É exatamente isso que este scanner faz. Esse scanner foi projetado para mostrar os sinais de compra e venda que você criou no Rule Plotter: criador de estratégias sem precisar de programação e rodar elas dentro deste scanner em diversos ativos e timeframes diferentes. A estratégia default do Rule Plotter é apenas os candles bullish
FREE

Indicador de Visualização do Livro de Ofertas Nível 2 Nosso indicador inovador integra de forma transparente os dados do livro de ofertas nível 2 diretamente no seu gráfico de negociação, oferecendo uma visão em tempo real da profundidade de mercado e a dinâmica de oferta e demanda. Com suas duas principais funcionalidades, você pode aprimorar sua análise de mercado e tomar decisões de negociação mais informadas: Destaque do Maior Volume: Esta entrada permite que os traders identifiquem instant
FREE
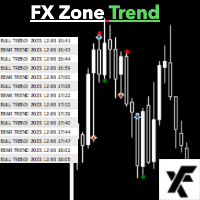
Desbloqueie seu potencial de negociação com o FX Zone Trend - O caminho simples para a lucratividade! Por que escolher o FX Zone Trend? Negociação simplificada: Sem gráficos complexos ou indicadores confusos. O FX Zone Trend fornece sinais claros para facilitar a tomada de decisões. Versatilidade em sua essência: Seja você um trader experiente ou iniciante, o FX Zone Trend complementa qualquer estratégia de negociação. Crie sua própria abordagem ou use-o como uma camada adicional de

O Fibonacci Master Pro é um indicador avançado de projeção Fibonacci projetado para otimizar suas estratégias de trading. Este indicador incorpora os princípios da análise técnica de Fibonacci, fornecendo projeções precisas e oportunidades de entrada e saída no mercado.
Fibonacci Master Pro mostra Projeções Fibonnaci para cima e para baixo baseadas no valor máximo e mínimo de uma vela que você especifica.
Principais Características : **Projeções Precisas:** Utilizando algoritmos sofistic

O Indicador de Projeção de Volume é uma ferramenta especializada projetada para traders que se concentram na relação entre o volume e a ação do preço. Este indicador intuitivo projeta o volume esperado para a vela em andamento, auxiliando na tomada de decisão durante as condições de mercado ao vivo. O indicador apresenta os dados de volume em formato de histograma diretamente no gráfico para uma análise rápida. Características: Representação de Volume Altista : Cada barra verde no histograma rep
FREE

Unlock the power of trend analysis with the Candle Trend Bars Indicator – your go-to tool for identifying and understanding market trends like never before. This innovative indicator transforms traditional candlestick charts into a dynamic and visually intuitive representation of market trends. Key Features: Trend Clarity: Gain a clear and concise view of market trends with color-coded bars that instantly convey the direction of price movements. User-Friendly Design: The indicator is designed wi
FREE
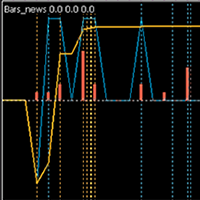
Indicator of news linked to a bar. The published current value of the news has a characteristic impact on the currency it relates to: positive, negative, neutral . The indicator summarizes all these values for the selected period, taking into account the importance of the news: high, medium, low . As a result, a percentage is calculated for the currency pair, which shows the news of which currency is dominant. If the value is positive, then the pair has news pressure towards BUY, if negative - S

Introducing FX Zone Custom Time OHLC Candle - Your Effortless Solution for 1-Minute Chart Analysis! Unleash the Power of Precision with Simplicity! Are you tired of complex indicators that clutter your charts? Meet FX Zone Custom Time OHLC Candle, a user-friendly tool designed for traders who value simplicity and precision in their 1-minute chart analysis. Key Features: Easy and Intuitive: Navigate effortlessly with a clean interface, making chart analysis a breeze. Custom Time OHLC

The Price Spectrum indicator reveals opportunities for detailed market analysis. Advantages: Market Volume Profile Creation : The indicator assists in analyzing the dynamics of trading volumes in the market. This allows traders to identify crucial support and resistance levels, as well as determine market structure. Filtering Insignificant Volumes : Using the indicator helps filter out insignificant volumes, enabling traders to focus on more significant market movements. Flexible Configuration S

QuantumAlert Stoch Navigator is a free indicator available for MT4/MT5 platforms, its work is to provide "alerts" when the market is inside "overbought and oversold" regions in the form of "buy or sell" signals. This indicator comes with many customization options mentioned in the parameter section below, user can customise these parameters as needful. Join our MQL5 group , where we share important news and updates. You are also welcome to join our private channel as well, contact me for the p
FREE

QuantumAlert CCI Navigator is a free indicator available for MT4/MT5 platforms, its work is to provide "alerts" when the market is inside "overbought and oversold" regions in the form of "buy or sell" signals. This indicator comes with many customization options mentioned in the parameter section below, user can customise these parameters as needful. Join our MQL5 group , where we share important news and updates. You are also welcome to join our private channel as well, contact me for the pri
FREE

FusionAlert StochRSI Master is an indicator available for MT4/MT5 platforms, it is a combination of RSI & Stochastic indicator which provide "alerts" when the market is inside "overbought and oversold" regions combined for both indicators, results in more precise and accurate signals to be used as a wonderful tool, in the form of "buy or sell" signals. This indicator comes with many customization options mentioned in the parameter section below, user can customise these parameters as needful. Jo
FREE

QuantumAlert RSI Navigator is a free indicator available for MT4/MT5 platforms, its work is to provide "alerts" when the market is inside "overbought and oversold" regions in the form of "buy or sell" signals. This indicator comes with many customization options mentioned in the parameter section below, user can customise these parameters as needful. Join our MQL5 group , where we share important news and updates. You are also welcome to join our private channel as well, contact me for the priva
FREE
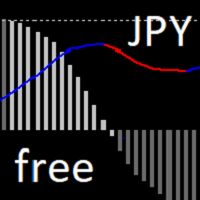
The same as https://www.mql5.com/en/market/product/109542 , but only for JPY pairs. Enjoy it, enjoy it, enjoy it, enjoy it, enjoy it, enjoy it, enjoy it, enjoy it, enjoy it, enjoy it, enjoy it, enjoy it, enjoy it, enjoy it, enjoy it, enjoy it, enjoy it, enjoy it, enjoy it, enjoy it, enjoy it, enjoy it, enjoy it, enjoy it, enjoy it, enjoy it, enjoy it, enjoy it, enjoy it, ...
FREE

This is my trusted friend of trading.
So... I musted re-write this in MQL5 to use in brokers where there is only MT5.
The indicator is like a mother-in-law, who talks often, talks a lot and often inappropriately.
The indicator, in addition to giving us an entry signal on parameters which I will then list, monitors the trend of the hourly timeframe, OSMA to understand the entry direction, RSI to sense any overbought or oversold conditions from which to abstain, ATR for the volatility and ADX
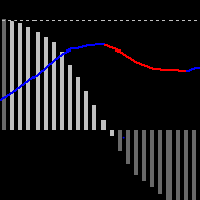
This indicator shows the MACD line and the difference WMACD - MACD to it. that is, the divergence between price and weighted acceleration. Divergence is shown with a histogram. It took a bit of math to get a readable result.
What does the histogram say?
If the course is consistent with the price movement, then the price is driven by volumes. It is passing through an area of higher liquidity, the market is being manipulated by strong money. Within Wyckoff's theory, these are typically climax an

Introducing the Ultimate Custom Time Range Indicator: Unlock Precision in Your Trading Strategies! Versatile Applications: Ideal for kill zones, trading sessions, and time macro analysis, silver bullet timings. You can have as many time ranges as you need to help identify the highest to lowest range within the specified start to end broker time. Note: most brokers operate in GMT +3 - so please convert and use your own broker time.
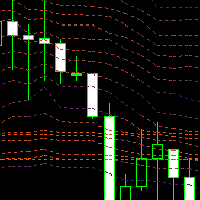
Market Profile, Volume Profile? Extra paid in TradingView, displayed for the last moment in time or discreetly, e.g. after 24 hours. Counting super-accurate values from a histogram...?
None of these ways suited me. I was looking for an expression of the dynamics of the market, its liquidity, I just wanted to clearly see where the money was flowing. I thought I would calculate the volume weighted price percentiles for a certain period.
To make the calculation more accurate, I calculate from a l

O IX Power traz finalmente a precisão imbatível do FX Power para símbolos não-Forex.
Determina com exatidão a intensidade das tendências a curto, médio e longo prazo nos seus índices, acções, mercadorias, ETFs e até criptomoedas favoritos.
Pode analisar tudo o que o seu terminal tem para oferecer. Experimente e veja como o seu timing melhora significativamente quando negoceia.
Características principais do IX Power
Resultados de cálculo 100% precisos e sem repintura - para tod
Experimente negociar como nunca antes com nosso incomparável Indicador MT5 de Gap de Valor Justo, (FVG)
aclamado como o melhor da sua classe. Este indicador de mercado MQL5 vai além do comum,
fornecendo aos traders um nível incomparável de precisão e visão sobre a dinâmica do mercado.
Características:
Melhor análise de lacuna de valor justo da categoria. Costumização. Alertas em tempo real. Perfeição fácil de usar Compatibilidade perfeita Benefícios:
Precisão incomparável: tome dec
FREE

O comportamento de diferentes pares de moedas está interligado. O indicador Visual Correlation permite exibir diferentes instrumentos em um gráfico enquanto mantém a escala. Você pode definir correlação positiva, negativa ou sem correlação.
Alguns instrumentos começam a se mover mais cedo do que outros. Esses momentos podem ser determinados pela sobreposição de gráficos.
Para exibir um instrumento em um gráfico, insira seu nome no campo Symbol. Version for MT4 https://www.mql5.com/pt/m
FREE

Este indicador rastreia com eficiência quaisquer outros castiçais de período que você deseja acompanhar no mesmo gráfico
1. Selecione qualquer período superior para carregar barras no mesmo gráfico
2. Personalize as cores e o estilo dos castiçais
3. Escolha o número de barras para desenhar castiçais
4. Acompanhe velas completas de prazos mais altos junto com o pavio e o corpo
5. Fácil e conveniente para quem não deseja mudar de gráfico.
MEDE A FORÇA DAS RESISTÊNCIAS E DOS APOIOS
O indicador RSD - Resistência, Suporte e Direção - é a ferramenta operacional do trader especialista.
É o indicador que realmente faz a diferença.
é um indicador indispensável para qualquer tipo de negociação funciona perfeitamente em qualquer período de tempo recebe como entrada o número de velas para as quais calculará as resistências e os suportes desenha as resistências e os suportes: quanto
Você sabe por que o mercado MetaTrader é o melhor lugar para vender as estratégias de negociação e indicadores técnicos? Não há necessidade de propaganda ou software de proteção, muito menos problemas de pagamentos. Tudo é providenciado no mercado MetaTrader.
Você está perdendo oportunidades de negociação:
- Aplicativos de negociação gratuitos
- 8 000+ sinais para cópia
- Notícias econômicas para análise dos mercados financeiros
Registro
Login
Se você não tem uma conta, por favor registre-se
Para login e uso do site MQL5.com, você deve ativar o uso de cookies.
Ative esta opção no seu navegador, caso contrário você não poderá fazer login.