Conheça o Mercado MQL5 no YouTube, assista aos vídeos tutoriais
Como comprar um robô de negociação ou indicador?
Execute seu EA na
hospedagem virtual
hospedagem virtual
Teste indicadores/robôs de negociação antes de comprá-los
Quer ganhar dinheiro no Mercado?
Como apresentar um produto para o consumidor final?
Novos Indicadores Técnicos para MetaTrader 5 - 3
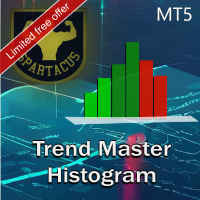
Trend Chart Histogram é um indicador baseado em um algoritmo que usa duas médias móveis e vários osciladores. Graças ao seu código de cores, permite identificar rapidamente a tendência e aproveitar os maiores impulsos do mercado.
As cores claras indicam a tendência, as escuras definem os impulsos e o cinza indica que você não deve entrar no mercado.
Versão MT4 aqui.
Parâmetros de entrada:
- Período 1 (período rápido)
- Período 2 (período lento)
- Período do oscilador
Você pode a

The "Rejection Block" MetaTrader 5 Indicator offers traders a comprehensive tool for identifying and visualizing rejection candlestick patterns, commonly known as rejection blocks. These patterns are pivotal in discerning potential market reversals or continuations, making them invaluable for traders seeking to enhance their analysis. Key Features: Rejection Block Detection: The indicator diligently scans price data, pinpointing instances of rejection candlestick patterns. These patterns typical
FREE

The Fair Value Gap Detector is a MetaTrader 5 indicator designed to identify and draw rectangles on the chart wherever fair value gaps (FVGs) are detected. Fair value gaps occur when there is a significant disparity between the current price and the fair value of an asset. These gaps can provide valuable insights into potential trading opportunities, as they often indicate overbought or oversold conditions in the market. Key Features: FVG Detection: The indicator utilizes a proprietary algorith
FREE

Higher Timeframe Chart Overlay will display higher timeframe candles, including the number of candles high/low you specify.
You no longer need to switch timeframes to check the candles. Everything can be shown in one chart. MT4 Version : https://www.mql5.com/en/market/product/115680 Almost everything can be change as you want. You can change/set:
- Choose different colors for the body and top/bottom wicks.
- Panel's height and width.
- The width of the body and wicks
- Change backgrou

Higher Timeframe Chart Overlay will display higher timeframe candles, including the number of candles high/low you specify.
You no longer need to switch timeframes to check the candles. Everything can be shown in one chart. Get Full Version - https://www.mql5.com/en/market/product/115682 Please feel free Contact me if you have any questions regarding this tool.
FREE

This is my version of Currency Strength Meter.
One of the best indicators for spotting weak and strong currencies. Based on the information obtained, its very simple to decide which currency buy and which sell.
It is very simple to use, but extremely effective.
General rules are: - Buy currencies above level 0
- Sell currencies below level 0
You can also mix the main currencies together -->
EURUSD > 0 and USDJPY < 0 --> BUY on EURJPY
FREE

ST Ultimate Rectangle
Introducing our latest MT5 indicator: the upgraded Rectangle Object Indicator. This powerful tool boasts an enhanced rectangular object, allowing for simultaneous color fill and outlining. Plus, it offers the flexibility to display prices conveniently at both the top and bottom of the rectangle. Streamline your trading analysis with this versatile indicator, designed to provide clarity and precision in every trade.
We value your input in further refining our indicator
FREE

1. CONSTITUTION Goby Momentum it consists of two oscillator and three dynamic bands (upper, middler, lower). The inputs can be used to adjust the oscillators, the dynamic bands and the alert signals. 2. UTILITY This indicator detects the exhaustion of correction movements within a trend, thus giving entry points for new trades. Entry signals can be generated for both smaller timeframes (>M5) and larger ones (<H1). 3. OPERATION CONDITIONS Buy signal: When the Waterfall [thick line] is above the u

up down v6 for mt5 is no repaint all timeframe and all pairs indicator. red histogram cros trigger that is up point,and put a red point on histogram. and blue histogram cros trigger that is deep point.and put blue point on histogram. this indicator need to sometimes zoom out .for thise pres + button. if newly comes signal is too high makes before invisible.red and blue points are there.to see the signals. indicator is no repaint and can use all time frame and all pairs. only need minimum 500 bar

O indicador Spread Pulse MT5 é uma ferramenta eficaz que fornece aos traders informações sobre o spread atual no gráfico. Spread é a diferença entre o preço de compra e o preço de venda de um instrumento.
O indicador é apresentado na forma de texto exibido no gráfico. Isto permite ao trader rastrear facilmente o spread atual.
Uma das principais vantagens do indicador Spread Pulse é a visualização de cores. Dependendo do tamanho da página espelhada, a cor do texto muda. Por padrão, quand

O Pips Hunter PRO foi desenvolvido ao longo de vários anos e é uma versão melhorada do seu antecessor. Este poderoso indicador analisa o mercado e o histórico de preços para gerar entradas de compra e venda. Para o cálculo destas entradas, utiliza diferentes indicadores que funcionam em conjunto, bem como um logaritmo estatístico complexo que filtra as entradas menos favoráveis e as elimina / versão MT4 . O preço aumentará progressivamente devido à procura constante de manter um elevado n

Os sinais de entrada de atirador MFI e RSI para sintéticos Boom e Crash vêm com poderosos sistemas de alerta de entrada e, para sinais de filtro mais avançados, considere o Harmonic Hybrid Pilot Pro. Ao negociar Spikes, você tem três ordens colocadas logicamente para distribuir o risco e a terceira ordem é finalmente próximo da maior probabilidade de um pico. Os sinais são invalidados quinze minutos após a ordem final e as perdas devem ser fechadas imediatamente. Para Tp, recomendo que você saia
FREE

The RSI Advanced tool will help traders capture trends and optimal entry points by:
- Enter a Buy order when the green line crosses the yellow line. Provided that the yellow line is near line 32 or 20 - Enter a Sell order when the green line crosses the yellow line. Provided that the yellow line is near line 68 or 80
Additionally, you can combine it with the convergence divergence that occurs at the green line.
**When you purchase the Mastering the RSI MT4 or Mastering the RSI MT5 indicat

The Expert Advisor for this Indicator can be found here: https://www.mql5.com/en/market/product/115567 The Contraction/Expansion Breakout Lines with Fair Value Gaps (FVGs) Indicator for MetaTrader 5 (MT5) is a powerful technical analysis tool designed to help traders identify and visualize breakouts at critical levels of contraction and expansion in financial markets. By incorporating Fair Value Gaps (FVGs), this indicator enhances traders' ability to gauge market sentiment and anticipate poten
FREE

The ICT Zone Arrow Indicator is an innovative tool developed based on ICT principles. It provides ease and efficiency in identifying key trading areas in the market. Based on the 'killzone' concept, this indicator provides traders with important support and resistance levels by identifying places where large changes in price direction could potentially occur.
The ICT Zone Arrow Indicator provides visual graphical markers that help traders identify trade entry zones with a high probability of
FREE

Se você é (ou foi) um fã do indicador RSI, vai adorar o indicador Dynamic Momentum Index de Tushar Chande, que, em termos simples, é um RSI de comprimento variável dinâmico, tornando-o mais poderoso. O indicador DMI usa internamente um número variável de barras em seus cálculos, levando em consideração os níveis de volatilidade do mercado atual que você está analisando. Dessa forma, o indicador DMI usará mais barras conforme a volatilidade diminui e menos barras quando a volatilidade aumenta, pr
FREE

** NOTE: This indicator uses realtime data. Thus DO NOT download Demo version. If you still need demo version, please refer to free version .
Symbol Chart Changer is an indicator/utility that offers you the option to switch between symbols and timeframes.
You can choose any symbol and timeframe on the same chart with just a few clicks. In addition, this indicator also shows the profit of the symbol through the color of the buttons.
Features: Click buttons on the chart to monitor all your

Velas Multi Time Frame
Las velas multi time frame, también conocidas como "MTF candles" en inglés, son un indicador técnico que permite visualizar velas japonesas de un marco temporal diferente al marco temporal principal en el que estás operando. Este enfoque ofrece una perspectiva más amplia del comportamiento del precio, lo que resulta especialmente útil para los traders que emplean estrategias de acción del precio. A continuación, se detallan los conceptos clave relacionados con este indi
FREE
Supertrend is a trend following indicator based on the Average True Range (ATR) . Calculating the odd line combines trend detection and volatility. It can be used to detect changes in trend direction and position stops.
Basic knowledge Supertrend is a trend following indicator. It takes up space on the main chart and its plots show the current trend. A Supertrend can be used for varying durations (daily, weekly, intraday, etc.) and varying instruments (stocks, futures or forex). Super

Certainly! Let’s discuss the RSI Rush , an aggressive momentum indicator that combines weighted moving averages (WMAs) at lows, mid-price, and tight highs. Here are the key components: Weighted Moving Averages (WMAs) : The RSI Rush employs three WMAs: WMA at Lows : Calculated based on the lowest prices during a specific period. WMA at Mid-Price : Considers the average price (midway between highs and lows) during the same period. WMA at Tight Highs : Based on the highest prices during the speci

Introduction to the Candle Time Indicator The Candle Time Indicator for MetaTrader 5, helps users know how much time on a candlestick is remaining.
Overview of Candle Time Indicator settings. TextColor: set the color of the countdown clock; FontSize: set the size of the font; Installation Guide Copy and paste the CandleTime.ex5 indicator files into the MQL5 folder of the Metatrader 5 trading platform. You can gain access to this folder by clicking the top menu options, that goes as follows: Fi
FREE
Indicator Name: Signal Generator Non Repaint. The arrow is non-repaint. Its a non-repaint arrow or money back guarantee. Arrow appeared after candle closed. Very accurate. Time Frame: Any Assets: Any This is MT5 version I use this to trade Gold, US30, Nasdaq and Dax at New York and London Opening. TF m5/m15 Parameters: Push Notifications = True ( You can set the alert send to your mobile phone)
To Setup Sending Alert to your mobile phone 1. At Metatrader Options > Options > Notifications > Ena

StartPoint是一个很好的短线交易指示器,这个指标可以单独使用,但是最好是配合 HighQualityMap 一起使用,适用于任何时间框架,喜欢超短线的朋友可以使用M5时间框架。它能很好的体现出短期趋势的启动点,你可以很快的从这个指示器上寻找到最佳的buy和sell位置,同时也能很好根据指示器去坚守自己的持仓定订单。指标不含有未来函数,不会重新绘制,不仅能够应用到自己的手动交易过程中,还能完全可以写入到自己的EA中。(如果你感觉到这个指标能够帮助你进行更准确的交易,请帮忙给个好评,希望我的作品能够帮助更多有需要的人) ===================参数列表===================== 所有参数均采用默认参数即可,无需更改,若为激进型交易者,可以根据自己的需要来调整参数。 =================参考使用方法=================== 此指标可以适用于任何交易品种。

Introduction
One of the patterns in "RTM" is the "QM" pattern, also known as "Quasimodo". Its name is derived from the appearance of "Hunchback of Notre-Dame" from Victor Hugo's novel. It is a type of "Head and Shoulders" pattern.
Formation Method
Upward Trend
In an upward trend, the left shoulder is formed, and the price creates a new peak higher than the left shoulder peak . After a decline, it manages to break the previous low and move upward again. We expect the pric

Description: Dimatis Watchtower is a powerful backtesting tool designed for traders seeking for an efficient way to test and optimize their trading strategies on the MetaTrader 5 platform. With a minimalist interface and advanced features, this tool provides an outstanding solution for evaluating the performance of your strategies in various market conditions. Key Features: Backtesting: Perform precise and reliable backtests of your strategies using historical data from your broker directly on M
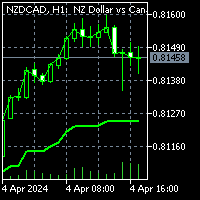
To get access to MT4 version please click here . This is the exact conversion from TradingView: "G-Channel Trend Detection" by "jaggedsoft". This is a light-load processing and non-repaint indicator. You can message in private chat for further changes you need. All input options are available. Buffers are available for processing within EAs. Highlight option is omitted as does not show good in Metatrader.

Description of ADTGroup_Oscillator.mq5 Indicator
The ADTGroup_Oscillator.mq5 indicator is a custom technical analysis tool created by avydel. It is designed to provide insights into market trends and potential trading opportunities. Here is an overview of its key features and functionality:
- **Indicator Type:** This oscillator is designed to be displayed in a separate window on the trading platform. - **Indicator Plots:** It utilizes one buffer for plotting data. - **Plot Style:** The indi
FREE

The indicator shows divergence between the slope of lines connecting price and MACD histogram peaks or troughs. A bullish divergence (actually a convergence) occurs when the lines connecting MACD troughs and the lines connecting the corresponding troughs on the price chart have opposite slopes and are converging. A bearish divergence occurs when the lines connecting MACD peaks and the lines connecting corresponding price peaks have opposite slopes and are diverging. In such a case, the indicato
Linear regression AI powered Indicator: Linear regression is a simple yet effective AI technique that is the foundation of complex neural networks, This indicator is built based on linear regression analysis and tries to make predictions on the upcoming event in the market Inputs : train_bars: This controls the number of bars that the price information will be collected and used to train the AI inside it, The greater this value the better also the slower the indicator becomes during initializati

The " YK Find Support And Resistance " indicator is a technical analysis tool used to identify key support and resistance levels on a price chart. Its features and functions are as follows:
1. Displays support and resistance levels using arrow lines and colored bands, with resistance in red and support in green.
2. Can be adjusted to calculate and display results from a specified timeframe using the forced_tf variable. If set to 0, it will use the current timeframe of the chart.
3. Uses
FREE

Unlock the full potential of your Pro Thunder V9 indicator with our revolutionary new plugin - Auto Trend Lines! Are you looking for a competitive edge in today's dynamic market? Look no further. With Auto Trend Lines, you can harness the power of precise market trend analysis to make informed trading decisions. This innovative plugin seamlessly integrates with your Pro Thunder V9 indicator, providing you with real-time trend data and pinpointing exact entry and exit points for your trades. Key
FREE

** This is the short version of Symbol Changer . You might want to refer to full version with further features. Symbol Chart Changer is an indicator/utility that offers you the option to switch between symbols and timeframes. You can choose any symbol and timeframe on the same chart with just a few clicks. In addition, this indicator also shows the profit of the symbol through the color of the buttons. For MT4: Symbol Chart Changer Features
All symbols selected in MarketWatch, that allow y
FREE

The best quality application of the famous Super Trend indicator that requires no introduction. It is completely faithful to the original algorithm and powered by the CCI indicator.
- easy to trade - It implements all kinds of warnings. - It implements a multi-timezone dashboard. - It cannot be repainted or backpainted.
Input parameters - ATR Period – This is the average true range period. - ATR Multiplier - The ATR multiplier that defines the trend. - CCI - Makes trend following powerful. -

The Expert Advisor for this Indicator can be found here: https://www.mql5.com/en/market/product/115564 The Contraction/Expansion Breakout Indicator for MetaTrader 5 (MT5) is a powerful tool designed to identify and signal the breakout of bullish and bearish contraction or expansion formations in financial markets. Utilizing advanced algorithmic calculations, this indicator helps traders spot significant price movements that often accompany these formations, providing valuable insights for stra
FREE

Heikin Ashi Heikin Ashi is a charting technique that can be used to predict future price movements. It is similar to traditional candlestick charts. However, unlike a regular candlestick chart, the Heikin Ashi chart attempts to filter out some of the market noise by smoothing out strong price swings to better identify trend movements in the market.
To create Heiken Ashi, a formula is used in which price data is entered, while ordinary candles are built only on bare numbers, without using any

An invention that will turn your working principles upside down.
Especially in horizontal and stagnant markets, annoying losses can occur.
Besides, following trend lines, support and resistance can be tiring.
To put an end to all this, I decided to create a professional "moving average" indicator.
All you have to do is follow the colors.
If you need additional support, I recommend the "Heiken-Ashi" candle indicator in my profile.
I wish you lots of profit..

Schaff Trend Cycle (STC) "CON ALERTAS"
El Indicador Schaff Trend Cycle (STC) es una herramienta técnica utilizada en el trading e inversión para identificar tendencias y generar señales de compra o venta. ¿Qué es el Schaff Trend Cycle? El STC fue desarrollado por Doug Schaff para mejorar las medias móviles incorporando análisis de ciclos. Su objetivo es identificar tendencias y cambios de tendencia midiendo la fuerza y velocidad de los cambios de precio. Es un oscilador que mide la velocida
FREE

El indicador técnico Trend Magic es una herramienta de análisis de tendencias que combina el Índice de Canal de Mercancía (CCI) y el Rango Verdadero Medio (ATR) para identificar la dirección de la tendencia del mercado. Aquí tienes un resumen de sus pros y contras, así como las mejores condiciones del mercado para su uso:
Pros: - Identificación clara de la tendencia: Cambia de color para indicar tendencias alcistas (azul) y bajistas (rojo), lo que facilita la visualización de la dirección del
FREE

El Trend Detection Index (TDI) es un indicador técnico introducido por M. H. Pee. Se utiliza para detectar cuándo ha comenzado una tendencia y cuándo ha llegado a su fin. El TDI puede usarse como un indicador independiente o combinado con otros; se desempeñará bien en la detección del comienzo de las tendencias.
Los indicadores de tendencia son esenciales para detectar las tendencias de los mercados financieros. Estos indicadores ayudan a determinar la dirección que probablemente siga el acti
FREE

Sentimento de Mercado é um indicador que usa os dados do nosso principal indicador: Market Strength Radar.: https://www.mql5.com/pt/market/product/114568?source=Site +Profile+Seller Ele imprime um gráfico de linhas que deve ser comparado com o gráfico de preço para entendermos o sentimento do mercado. As divergencias são pontos importantes de inflexão. As convergências mostram força da tendência atual.
FREE

Versión Beta El indicador técnico Non Lag MA MTF (Non-Lagged Moving Average Multi-Time Frame) es una versión avanzada del Non Lag MA que permite visualizar la media móvil en varios marcos temporales simultáneamente. Pros: - Visión integral: Proporciona una visión más completa al mostrar la media móvil en diferentes marcos temporales en un solo gráfico. - Anticipación de tendencias: Ayuda a anticipar cambios de tendencia al observar la convergencia o divergencia de las medias móviles en distint
FREE
Buy DEMA 3 Scalp Indicator, Signaling and Trend Finder for Forex DEMA 3 indicator is a professional indicator for finding trends as well as finding entry and exit points for a symbol. This indicator is designed based on the DEMA indicator, which can tell you the signals accurately and quickly. The DEMA 3 indicator can give you accurate and early entry points for swings. Features of the DEMA indicator 3
Receive signals as notifications on the Metatrader mobile application. Receive signals by em

This indicator shows the strength of each currency compared to the US dollar by calculating the rate of change in price over a specified time period. When you open the indicator, you'll see a list of different currencies on the price chart. Each currency will have a numerical value indicating its strength level compared to the US dollar, where: If the value is higher than the US dollar, it will be displayed in green, meaning that currency is stronger than the dollar. If the value is lower than t
FREE

El indicador técnico Non Lag MA (Non-Lagged Moving Average) es una variante de la media móvil que busca reducir el retraso inherente a las medias móviles tradicionales.
Pros: - Menos retraso: Al estar diseñado para reducir el retraso, el Non Lag MA puede proporcionar señales más rápidas que las medias móviles tradicionales. - Tendencias claras: Las líneas del Non Lag MA muestran claramente las tendencias alcistas y bajistas, lo que facilita la interpretación de la dirección del mercado. - Per
FREE

Indicador Maestro del Trader
Características Principales: Spread del Mercado en Tiempo Real : Visualiza el diferencial entre el precio de compra y venta directamente en tu gráfico. Cuenta Regresiva del Cierre de Vela : No más sorpresas al final de la vela. El indicador muestra un cronómetro que te informa cuánto tiempo queda antes de que se cierre la vela actual. ¡Actúa con precisión en los momentos cruciales! Ganancias o Pérdidas en Tiempo Real : ¿Estás en verde o en rojo? El Indicador Maes
FREE

Introducing the Bollinger Band Box: A Trading Revolution! Description : The Bollinger Band Box, crafted with love by the ingenious minds at MQ4.ORG, is not your ordinary indicator. It’s like Bollinger Bands decided to ditch their old-school wavy lines and donned a sleek, futuristic exoskeleton. Let’s dive into why this little box is causing a stir among traders: Visual Clarity and Precision : Say goodbye to squinting at those zigzagging Bollinger Bands. The Bollinger Band Box wraps
FREE
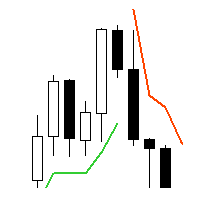
Supertrend - невероятно мощный и универсальный индикатор, предназначенный для помощи трейдерам в определении текущего тренда на конкретном торговом инструменте. С помощью двух встроенных индикаторов, Average True Range и Standard Deviation, трейдеры могут выбрать наиболее подходящий индикатор для своей стратегии торговли. Пользователи также могут настроить период этих индикаторов и выбрать цену (Close, High, Low, Open, Weighted), к которой он должен быть применен, с Typical price в качестве опци

Este indicador desenha o Parabolic SAR. Linhas superior e inferior com cores personalizáveis. Com um parâmetro adicional denominado “Validate Signals”, que identifica falsos rompimentos e altera a cor da linha para cinza.
Parâmetros de Entrada: Step (padrão é 0.02 ) Maximum (padrão é 0.2 ) Applied Price High (padrão é High price) Applied Price Low (padrão é Low price) Validate Signals (valor booleano para filtrar falsos rompimentos, padrão é true)
FREE
Este indicador é um oscilador de escala semilogarítmica ancorado. Uma escala logarítmica é amplamente utilizada por cientistas de dados profissionais para mapear com mais precisão as informações coletadas ao longo de um período de tempo, da mesma forma que o MT5 mapeia os dados de preços. Na verdade, a lógica subjacente a este indicador foi obtida gratuitamente de um cientista biotecnológico estrangeiro.
Um gráfico log-log exibe valores logarítmicos nos eixos x (horizontal) e y (vertical), o

Advanced Market Analysis Tool : Dive into market depth with the MT5 Volume Profile Indicator. Seamless MT5 Integration : Perfectly compatible with the MT5 platform. Enhances Pro Thunder v9 : Integrates smoothly with Pro Thunder v9 for deeper market insights. Detailed Volume Analysis : Explore market dynamics through in-depth volume data. ️ Simple Installation : Easy-to-follow setup steps for quick integration with MT5. Efficient Single Chart Application : Best used on a single c
FREE

Brilliant Reversal Indicator for MetaTrader 5 - Your Ultimate Alert-Driven Trading Solution Unlock unparalleled trading success with the "Brilliant Reversal Indicator" tailored for MetaTrader 5. This powerful tool has been meticulously designed to empower traders by identifying critical reversal opportunities with lightning-fast alerts. Key Features: Precise Reversal Detection: The Brilliant Reversal Indicator for MT5 specializes in pinpointing potential trend reversals, providing you with a str

PreCogniTrade : Un Indicador Técnico Avanzado para Predecir el Mercado (Fase Beta) El PreCogniTrade es un indicador técnico revolucionario diseñado para los traders que buscan una ventaja competitiva en los mercados financieros. Este indicador no solo analiza las tendencias actuales, sino que también predice los movimientos futuros de los precios con una precisión asombrosa, lo que lo convierte en una herramienta de incalculable valor para cualquier estrategia de trading. Características Pr
FREE

This indicator identifies the global trend and has a powerful algorithm for filtering out any type of noise that can interfere with trend direction identification. A special filter shows areas of sideways trend, consolidation or flat, which allows you to avoid any uncertainties in the market movement vision and gives a clear understanding of the global trend movement.
This indicator has no analogues and gives it unique advantages in the analysis of price movements and determination of the dir
The " Session Control " indicator is designed to display trading sessions on a price chart. This allows the trader to see at what points of activity the most important trading sessions occur: Pacific, European, American and Asian. Each of these sessions is characterized by a certain volatility and activity in the market, which is important for making trading decisions.
Peculiarities: Displaying sessions : The indicator shows time periods on the price chart corresponding to different trading s

** All Symbols x All Time frames scan just by pressing scanner button ** *** Contact me after the purchase to send you instructions and add you in "Order Block group" for sharing or seeing experiences with other users. Introduction: The central banks and financial institutions mainly drive the market, Order block is considered a market behavior that indicates accumulation of orders from banks and institutions, then the market tends to make a sharp move(Imbalance) on either side once

El **Heiken Ashi Smoothed** es una versión suavizada del indicador técnico Heiken Ashi, que se utiliza en el análisis de gráficos de velas para identificar tendencias del mercado y pronosticar movimientos de precios. Este indicador se basa en el promedio de datos de precios para formar un gráfico de velas que ayuda a los traders a filtrar el ruido del mercado.
**¿Para qué sirve?** Este indicador se utiliza para identificar cuándo los traders deben permanecer en una operación y cuándo está por
FREE

This is my version of the famous VWAP indicator.
Channel Group: Click Here
You get: - Default VWAP Line - First and second deviation zones - Previous day levels Very simple to use, one of the best tools for day trading. Can be used on any TF and on any symbol. Don't use for entries, use as a trend filter. Add supporting indicators
I would recommend to use the indicator on either 15M or 5M chart.
FREE

The "YK-LOT-SIZE" is a custom indicator for MetaTrader 5 (MT5) that displays the total lot sizes and profits for both buy and sell positions on the current chart. Key features of the indicator: It calculates the total lot sizes for all open buy and sell positions of the current symbol. It calculates the total profits (including commissions and swaps) for all open buy and sell positions. The indicator displays the information on the chart using two lines of text: "BUY Lots: [total buy lots] | BUY
FREE

El indicador técnico conocido como Líneas de Tendencia Perfecta . Este indicador es una herramienta valiosa en el análisis técnico y se utiliza para mejorar la toma de decisiones en el trading. Aquí tienes una descripción paso a paso de cómo funciona y cómo puede ser utilizado por los traders: Identificación de Tendencias : Las líneas de tendencia perfecta se dibujan conectando dos o más puntos de precio en un gráfico, revelando así la dirección general del mercado. Una línea ascendente indica
FREE

The YK-SMART-EMA is an indicator that displays multiple Exponential Moving Average (EMA) lines on a price chart to help analyze price trends. This indicator features five EMA lines: EMA14 (red line): Calculated based on the closing prices of the last 14 candles. EMA30 (blue line): Calculated based on the closing prices of the last 30 candles. EMA50 (green line): Calculated based on the closing prices of the last 50 candles. EMA100 (orange line): Calculated based on the closing prices of the last
FREE

Brief Description: A tool to display historical Open, High, Low, and Close (OHLC) price points for various time periods. Gain insights into market behavior with data from yesterday, the day before, the previous week, and the previous month. Recognize liquidity zones effectively. Features: 1. Comprehensive Timeframe Insights: Visualize crucial OHLC points for different timeframes. Historical data for yesterday, day before yesterday, previous week, and previous month. 2. Built on ICT's Teachings:

Un indicador técnico de múltiples osciladores es una herramienta de análisis que combina varios osciladores para proporcionar una visión más completa de la dinámica del mercado. Los osciladores son fórmulas matemáticas que se calculan a partir de los datos de los precios y se representan gráficamente para ayudar a identificar la tendencia actual, el sentimiento del mercado y posibles puntos de giro.
**¿Para qué sirve?** Este indicador sirve para identificar condiciones de sobrecompra y sobrev
FREE

La **Media Móvil de Tercera Generación (TGMMA)** es una versión avanzada del indicador estándar de **Media Móvil (MA)**. Fue descrita por primera vez por Manfred G. Dürschner en su artículo "Gleitende Durchschnitte 3.0" (en alemán). Aquí están las características clave de la TGMMA:
1. **Reducción del Retraso**: - A diferencia de las MAs tradicionales, la TGMMA reduce significativamente el retraso. Se adapta más rápidamente a los cambios de precios, lo que la hace ideal para traders que bus
FREE

Buy CTS scalping indicator, provide buying and selling signals, automatic channeling and sending signals to mobile phones
Using technical analysis and price action methods and modern methods, CTS indicator can draw price channels and recognize price trends with high accuracy and issue entry and exit signals according to them. Traders can easily fluctuate using this indicator in different time frames and in different markets. With the CTS indicator, you can signal in different ways. This indicat

This is a tool to estimate your probability of bankruptcy. features. estimate a probability of bankruptcy (Nauzer J. Balsara) from your trade history usually, it is small print and never interfere with trades alert in large prints and color when it exceed the alert level you can set parameters(i.e. winning ratio) fixed and simulate freely *1: this value is for reference only and is not guaranteed to occur.
FREE

Introducing the Consecutive Green/Red Candle Alert Indicator for MT5 - Your Trend Spotting Companion!
Are you ready to take your trading to the next level? We present the Consecutive Green/Red Candle Alert Indicator, a powerful tool designed to help you spot trends and potential reversals with ease. Whether you're a new trader looking for clarity in the market or an experienced pro seeking additional confirmation, this indicator is your trusted companion.
Key Features of the Consecutive Gre

O indicador básico Renko é uma ferramenta poderosa para os comerciantes que procuram uma perspetiva de mercado clara e concisa. O nosso indicador não só simplifica a visualização de tendências, como também oferece alertas precisos para inversões, proporcionando uma vantagem estratégica na sua negociação / Versão MT4 gratuita
Características Totalmente personalizável: Adapte o indicador às suas preferências comerciais com opções avançadas de personalização. Desde as cores às definições d
FREE

Este indicador desenha o Canal Donchian, preenchendo o fundo com cores. A cor da linha do meio é alterada seguindo a tendência atual, com base na interpretação padrão do Canal Donchian.
Parâmetros de Entrada: Period of the Channel (padrão é 20) Validate Signals (valor booleano para filtrar falsos rompimentos, padrão é false) Background Settings Show Background ( padrão é true) U ptrend Color ( padrão é DodgerBlue ) Downtrend Color (padrão é Orchid) Background Transparency (padrão é 90%
FREE

Você está pronto para levar sua negociação para o próximo nível? Apresentando WH Divergence Pro MT5 ,
um indicador de divergência avançado que permite escolher entre uma variedade de indicadores técnicos populares.
Agora, você pode adaptar seus sinais de divergência para corresponder à sua estratégia de negociação exclusiva. Entre em contato comigo após a compra para orientá-lo sobre os profissionais Características principais :
Seleção de Indicador : Escolha seu indicador preferi

O painel verifica as leituras de dois indicadores: ‘MACD’ e ‘Estocástico’. Exibe sinais em três colunas: para MACD, para Estocástico e a coluna resultante (se o sinal for o mesmo para ambos os indicadores). A digitalização pode ser selecionada em um ou mais períodos de tempo. Se você desabilitar todos os prazos, o painel ainda será carregado, mas com configurações específicas para esses casos. Os sinais são sempre verificados para a barra zero (a barra zero é a barra mais à direita do gráfico) d
O Mercado MetaTrader contém robôs de negociação e indicadores técnicos para traders, disponíveis diretamente no terminal.
O sistema de pagamento MQL5.community está disponível para todos os usuários registrados do site do MQL5.com para transações em todos os Serviços MetaTrader. Você pode depositar e sacar dinheiro usando WebMoney, PayPal ou um cartão de banco.
Você está perdendo oportunidades de negociação:
- Aplicativos de negociação gratuitos
- 8 000+ sinais para cópia
- Notícias econômicas para análise dos mercados financeiros
Registro
Login
Se você não tem uma conta, por favor registre-se
Para login e uso do site MQL5.com, você deve ativar o uso de cookies.
Ative esta opção no seu navegador, caso contrário você não poderá fazer login.