Conheça o Mercado MQL5 no YouTube, assista aos vídeos tutoriais
Como comprar um robô de negociação ou indicador?
Execute seu EA na
hospedagem virtual
hospedagem virtual
Teste indicadores/robôs de negociação antes de comprá-los
Quer ganhar dinheiro no Mercado?
Como apresentar um produto para o consumidor final?
Expert Advisors e Indicadores para MetaTrader 4 - 96

My aim is to design an EA that trades with the trend and not against it like most EA. Quincy EA uses a grid to open long/short in the direction of movement catching small profits immediately and closing trades. This will only work if you have a good low spread chart and preferably trending pair. See its potential: https://www.mql5.com/en/signals/316939
How It Works Quincy EA will open trades in a grid format with a long or short trade depending on the direction of the particular market. It doe

This is a panel which can be used by the users to place a pending order in which they can customize their order while working on the chart. This panel allows its user to input their trade values. It is an easy to use panel from which user can place their pending orders quickly.
Inputs of this Panel Includes Price - The user inputs the price to place pending trade. Type - The user inputs the type of pending trade (BL,SL,BS,SS). Lot Size - The user inputs the lot size for the trade. Risk% - The

Alpha Trend is a trend indicator for the MetaTrader 4 platform; it has been developed by a group of professional traders. The Alpha Trend indicator finds the most probable tendency reversal points, which allows making trades at the very beginning of a trend. This indicator features notifications, which are generated whenever a new signal appears (alert, email, push-notification). This allows you to open a position in a timely manner. Alpha Trend does not redraw, which makes it possible to evalua

This indicator is a simple and handy tool, the main tasks of which are: Remind the trader of the approaching closing of the current bar. Visually display the remaining time on the chart before the end of the current bars of the charts with periods M1, M5, M15, M30 and H1. Notify the trader of the breakdown of High and/or Low bar set in the indicator settings. Notify the trader of the breakdown of the specified trend lines. In addition, notify the trader about the server connection loss. Setting
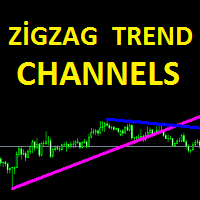
ZigZag Trend Channels indicator is designed to find channel trends. This indicator uses the zigzag indicator, some channel lines and some algorithms. This indicator also sends signal warnings for processing entry points. Up trend, down trend and triangle trend formations. Easy to use and understandable. Channel lines appear on the screen and trend forms are written.
Suggestions and Features This indicator has 3 trend features. They are up trend, down trend and triangle trend formations. This i

Cougar Scalper is a fully automated expert advisor. That is a medium-term trend scalper. Our EA has been created to work confidentially. So, it can close orders with actual account currency value at profit or loss. Also works with stop loss. The EA's strategy has been improved to make reasonable and low-medium risk profit. But, you can also increase your risk, although we do not recommend doing that. The EA's logic is little bit complicated. However, easy to use. Most of settings are set by the
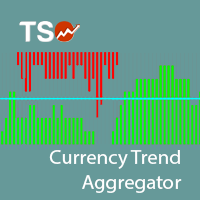
The TSO Currency Trend Aggregator is an indicator that compares a selected currency's performance in 7 different pairs. Instantly compare how a currency is performing in 7 different pairs. Easily get confirmation of a currency's strength Combine the indicator for both currencies of a pair to get the total view of how strong/weak each currency is. The trend is classified as positive (green), negative (red) or neutral (grey). Can easily be used in an EA (see below)
Currencies EUR USD GBP JPY AUD

Salva EA is an advanced and fully automated system, which passes backtesting since 2005. The basis of this strategy is the price chart itself, trading is performed based on the price movement range. Dynamic algorithms and filters are used for taking profit or closing trades. Built-in reworked system for filtering market entries and exits: Checking the trading direction using integrated trend indicators. Checking the channel range for the minimum and maximum values. Checking for the price exceedi

This indicator is based on CCIs indicators and is fully automated. Line shows trendline by CCIs. This indicator calculates CCIs of All timeframes and shows current line on each timeframe. You can use it on any timeframe you wish, trendline is calculated for this timeframe. Settings are not needed. Test it on Demo account before Real Account. Trading is risky. You trade at your own risk.

Professional traders know that a reversal in market price is the best entry points to trade. The trend changes K line state changes the most obvious. The SoarSignal is good to identify these changes, because we have incorporated the KDJ indicators. It is the closest to the K line state of the indicators. The two lines of KDJ Winner move within a range of 0 and 100. Values above 80 are considered to be in overbought territory and indicate that a reversal in price is possible. Values below 20 are

Cybernetics EA is a fully automated Expert Advisor. That is a medium-term trend follower.
Our EA has been created to work confidentially. So, it can close orders with actual account currency value at profit or loss. Also works with stop loss. The EA's strategy has been improved to make reasonable and low-medium risk profit. But, you can also increase your risk, although we do not recommend doing that.
The EA's logic is little bit complicated. However, easy to use. Most of settings are set by
The Funicular is a functional indicator knowing all the rules of the market and performing constructions more accurate and faster than any professional analyst. The Funicular helps you see the exact points of the "entrance", and it draws trends with great accuracy determinig their strength and fluctuation time. The main difference from the others is that it builds lines that are independent of timeframe allowing you to perceive the chart as a whole. Simply put, you need The Funicular, because i

A robot is designed for trading on a real account. The robot trades inside a channel formed by Bollinger bands. Trades are only opened with trend, near the border line of the channel. Take Profit is set at the opposite side of the channel. Deals are always by stop losses.
Trading Strategy Characteristics The robot calculates the channel formed by Bollinger bands. Market entries will be made near the channel borders if there is a sufficient gradient. Profit is fixed on the opposite side of the

The Expert Advisor determines the moments of strong movements and opens a position in the direction of the most probable price movement. The strategy always uses stop loss and take profit. Several independent orders can be in the market (the maximum number is set in parameters). The goal of the EA's underlying trading system is the quantitative excess of the number of profitable deals over the number of losing ones. Recommended: EURUSD 5m; GBPUSD 5m; USDJPY 5m. The Expert Advisor is able to work
This indicator was created to determine the overall trend of the market. Pivot points are support/resistance level areas, at which the direction of price can change. Many people are looking at those Pivot Point levels, which causes the levels to become almost self-fulfilling. Use this indicator to identify reversal points, so you can place your orders or combine it to recognize key price levels that needs to be broken to take a good breakout trade. With this indicator, its easy to find important
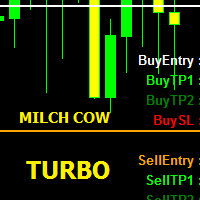
MILCH COW Turbo EA is primarily a multi-currency strategy. It supports 9 or 10 pairs as collection of currencies (GBPJPY, GBPUSD, EURCHF,EURGBP, EURJPY, EURUSD, USDCAD, USDCHF, USDJPY). If you choose Trade_Calc = false, only one pair is turned on. The EA depends on a special indicator to set Buy stop, Buy limit, Sell stop and Sell limit orders Note: If enabled Pendingorders = false, the EA will use the prices shown on the chart in live orders (buy and sell). In this case, the EA uses stop loss a

Vino EA is a grid expert advisor using mainly customized oscillators to analyze the market prices and volatility in order to identify trend reversals. It uses a grid of orders which increases the lot size only after the stop loss is reached. Grid size can be limited for more safety.
Requirements Default parameters has been optimized for EURUSD with timeframe M15 Minimum recommended deposit is $1000 for initial lot set to 0.1 ECN broker with low spread is recommended to get better results. Comp
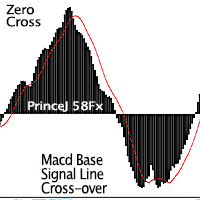
Purpose : Used as a tool for Traders and Investors This product is a Macd alert Indicator, which gives two (2) sets of Alerts: Main line and Macd Signal line cross over for early indications of retracements or trend change above or below. While the zero cross is the flipping over effect of the histogram to the opposite side of the zero line, which can be seen on the standard Macd Oscillator. Regular Arrows: Up and down arrows shows the cross over Of the Signal Line and Main Line from above for
This Is An Oscillatory Indicator Which Has OnlyTwo Lines: Main Line - The calculation for this value is based upon the open, high, low and close prices of chosen input parameters (within the set periods.) Signal Line - The Calculation for the signal line is based on the addition (& multiplication) of several moving averages of the Father, Son & Holy Spirit Periods (all applied to the main line's value).
Input Parameters Please Note that by way of combination, each input parameter plays several
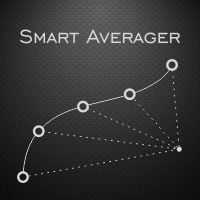
The Smart Averager Expert Advisor is the cost averaging system. The EA algorithm is based on the following principle: the Expert Advisor finds the trend section based on the specified parameters. Then it finds the moment when the price starts to gradually turn against the trend. The EA makes the first entry. Further, if the price continues to move in the trend direction, the EA opens additional positions based on the same algorithm. Profit of all positions is fixed after reaching the specified r
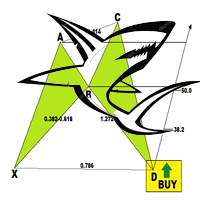
The Shark Pattern is dependent upon the powerful 88.6% retracement and the 113% Reciprocal Ratio, works extremely well retesting prior support/resistance points (0.886/1.13) as a strong counter-trend reaction. Represents a temporary extreme structure that seeks to capitalize on the extended nature of the Extreme Harmonic Impulse Wave. The indicator demands immediate change in price action character following pattern completion. Extreme Harmonic Impulse Wave utilized depends upon location of 88.6
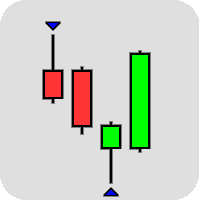
This indicator was created to spot potential reversals in the market. The Pinbar, or Pinnochio Bar, pattern is a a great candlestick pattern which can yield good trading results if traded properly. The idea behind this pattern is that price tries to trick us into thinking the wrong direction. When a Bullish Pinbar for example has formed, it tries to convince us price is going higher but in reality price is going down at the end of the bar. These patterns can be powerful reversal signals when use
Fractalicious shows Fractals of any length, higher or lower highs and lower of higher lows, the fractal channel and the breakout of the channel. Fractals are an important trend and price action pattern. Fractalicious can be used on any timeframe and symbol.
Settings Fractalicious default settings are good enough most of the time. Feel free to fine tune them to your needs. Show last fractal - Set to true to show fractals from the last completed bar. (This could move the fractal if the current b
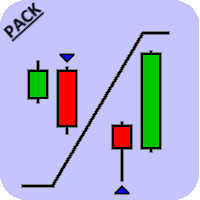
This is a pack which contains both the Engulfing Scanner as well as the Pinbar Scanner . The indicator comes with several sorts of alerts which makes it easy for a trader to wait for a pattern to be formed, have it signaled and then check the chart to see what the bigger story tells you.
Pinbar Scanner The Pinbar, or Pinnochio bar, pattern is a a great candlestick pattern which can yield good trading results if traded properly. The idea behind this pattern is that the price tries to trick us i

Entry Arrow Alerts: Finds market entry opportunities then notifies you via mobile or desktop alerts The key features include: Conservative mode . One entry signal per direction. Ideal for the patient trader looking to capture longer term moves. Aggressive mode . Multiple possible entry signals per direction. Ideal for the active trader looking to capture multiple moves within the same trend. Trigger Line . Price entry line helps cut down on false signals. Display Window . Allows you to instantly
This indicator works on the binary options It uses stochastic strategy to indicate the upcoming trend of the market This indicator helps traders to place a trade with the prediction involved on the stochastic strategy. This indicator makes use of the symbols to indicate the prediction regarding the order.
Symbols The upward symbol predicts the trend going up, so that traders can place trades accordingly. The downward symbol predicts the trend going down, so that the trader can place trades ac

The 'OHLC Breakz ' indicator was developed to show breakouts of reversals with custom price action patterns. The arrows show price action of reversal conditions with trendlines which indicate long term trend formations.
Key Features Custom price action pattern indicating a reversal/breakout from the prior bar. There are visual options available as well as modes which are all non-repaint. Non-repainting signals presented at the beginning of a new bar and at bar 0. Showcasing support & resistanc

MACD BBands is a trading system based on MACD and Bollinger Bands placed in a single window. The indicator shows moving average slope angle (trend) change, compares their ratio (convergence/divergence) and allows sorting out signals using Bollinger Bands. The indicators are calibrated in such a way that the middle Bollinger Bands line is the zero level of the MACD indicator.
Parameters
Period - Bollinger Bands period; Deviations - number of standard deviations; Shift - shift relative to price
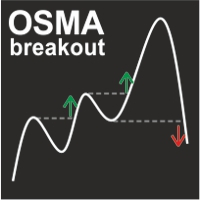
OSMA Breakout indicator displays signals formed at the time of overcoming the previous extremum of OSMA while simultaneously forming the extremum point on the price chart. If the extremum of the previous wave is punched, but the price remains in flat (in a narrow range), the signal is not displayed. This approach allows you to reduce the number of false signals in a long trend and the divergence of the indicator. The indicator works on any trading instrument and timeframe.
Parameters Fast EMA

This indicator displays the ZigZag Pointer Fibonacci Expansion Triangle movements timeframes only M1-W1.
Parameters InDepth: Displays the Depth movements. InDeviation: Displays the Deviation movements. InBackstep: Displays the Backstep movements. Fibonacci Expansion: Displays the Fibonacci Expansion movements. Fibonacci Expansion true.(false) Triangle: Displays the Triangle movements. Triangle true.(false) How to understand the status: If the Triangle is green, trend is up. If the Triangle is

The indicator plays sound alerts when the price reaches certain levels, specified by trader. You only need to draw a trendline and then press the alert button in the panel. The texts of the notification you determine. Notification via a smartphone or email address is possible. Note for "Free Demo" : MetaTrader 4 does not support displaying an alert window or playing sounds in the strategy tester, only in live or demo accounts.
How it works Draw a trendline Click the "Alert" button (Trendline

This indicator will show Buy (color Aqua) or Sell (color Magenta) arrow at the moment when a Long or a Short local trend (local to the current TimeFrame) is expected. The huge advantage is that the indicator does not have any input parameters. So, you will not waste your time and will not struggle to change them for different TimeFrames and currency pairs. This indicator is universal, but it will work better on H1 and lower TFs.

The Super Cross Trend indicator is designed for trend and signal trading. This indicator generates trend signals. It uses many algorithms and indicators to generate this signal. It tries to generate a signal from the points with the highest trend potential. This indicator is a complete trading product. This indicator does not need any additional indicators. You can only trade with this indicator. The generated signals are displayed on the graphical screen. Thanks to the alert features you can ge
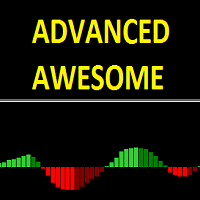
Advanced awesome indicator is a modified and advanced version of the standard awesome oscillator. With this indicator you can now make adjustments that you can not do on the awesome indicator. You can change and edit this indicator to suit your strategy. You can easily use it to recognize large and small trends.
Features The period can be set to define larger and smaller trends with the fast and period slow feature. You can change the input mode with the price mode. You can use Simple, Exponen

Shark Surfer is a new generation indicator applying a well-established trend-following trading. The product is good both for scalping, as well as medium- and long-term trading. Shark Surfer analyzes a selected symbol and shows the recommended market entry, take profit and stop loss levels. Shark Surfer trades on all symbols and timeframes. It also features email and push notifications concerning the new trading signals. The indicator searches for suitable market entry points on an already formed
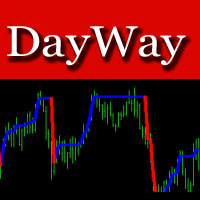
The DayWay indicator shows the current trend direction on the chart as a colored line. The best timeframes for operation are M5 and higher. Works on all currency pairs. Suitable for any scalping strategies. Quite easy to use.
Recommendations on usage When a blue line appears, wait for a candle to close and open a buy order. When a red line appears, wait for the current candle to close and open a sell order.
Parameters Periods - period of the indicator.
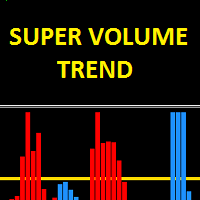
The Super Volume Trend indicator uses a set of algorithms and indicators. The purpose of this indicator is to find healthy trends with specific volume movements. It uses some filtering systems to find these trends. The indicator is easy to use, simple and understandable. This is a standalone trend indicator which does not need additional indicators. Users can apply it together with other indicators that are appropriate to their strategy.
Suggestions and working style The period settings have b

Hello, this EA is designed to scalp the market in the direction of the trend. I give you the ability to modify a lot of parameters in order to optimize the EA on different assets and timeframes. As a matter of fact, I noticed that the strategy is relatively adaptable among some Forex pairs and some assets from the daily timeframe to the 5 minutes one. I hope that you will be able to diversify your portfolio thanks to this skill. All backtests are done with a real tick database.
Parameters OBlo
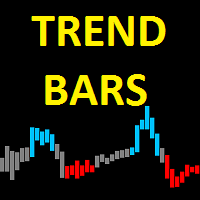
Trend Bars indicator is a trend indicator working with a set of algorithms and a set of indicators. Trend finds trends by using many factors while you are there. This indicator has 4 mode features. Mode 1 represents short-term trends. Mode 2 represents medium to short term trends. Mode 3 represents medium to long term trends. Mode 4 represents long term trends. Easy to use and simple indicator. The user can easily understand the trends. This indicator has 3 trend features. Up trend, down trend a

The indicator is designed for binary options. It produces a sound alert, after which you should instantly enter the market. The indicator operates based on signals form RSI and CCI, as well as support and resistance levels. When the chart is in overbought and oversold zones, the indicator finds a level in this zone and notifies you using a sound and a message.
Indicator Parameters dist - the number of points to generate a signal. Suitable values are from 21 to 50. Filtr_SMA - the filter, use

This indicator is constantly calculating the probability of a trend. The result of those calculations is shown in the upper left corner of the chart. It is shown in a green color text if the trend is expecting to go Up, in a red text if the trend is expending to go Down, and in a white text if "no trend" is calculated. It can show cross lines in color of your choice or you can delete those cross lines by setting Cross color to "None". This indicator can show a radar vector in color of your choic
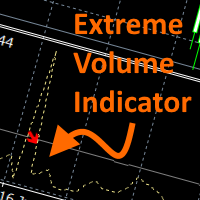
The extreme volume indicator helps identify turning points in the market by pinpointing spots of higher than average volume. Such points usually indicate the start of a trend or a turning point in the market. The indicator averages out volume readings over an extended period of time and calculates a volume threshold level. When this level is breached, it identifies the most likely trend direction using the trend of the candle that breached the volume threshold. The direction indicator (red or gr
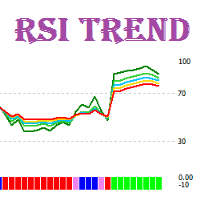
RSI Trend is a trend indicator that interprets the current market situation based on multiple RSI indicators with different periods.
Indicator Benefits Displays zones of an evident trend movement, overbought/oversold zones, as well as transition zones; Can be used in scalping strategies, as well as medium-term and long-term strategies; Has a minimum of settings; The standard line colors and selected for a comfortable operation with the black and white styles of the chart; Can be used in Expert
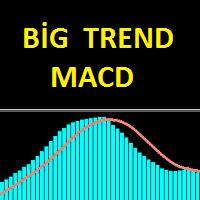
The Big Trend MACD indicator is an advanced model of the standard MACD indicator. It is very easy and simple to use. The main purpose of the indicator is to find great trends. With this indicator you can easily detect in small trends. This indicator can be used as two different trend finding tools for big trends and small trends. Try to use the big trends suggested, or with other suitable chart-appropriate indications.
Features and Trends This indicator has period, signal, period color, signal

This StrongCurrency is a complete trading system based on a variety of technical indicators, moving averages and pivots. Each of those elements can be assessed in defined rules and coefficients (depending on the indicator) providing limitless optimization scenarios for the StrongCurrency. In order to work the StrongCurrency creates a trend strength and entry point signal list display by evaluating these data, that takes data from all symbols. It extrapolates all the information in order to get t
Strongest and Weakest Currency Analysis This product shows the strength of the main currencies in FOREX based on average pip gain/loss in different time-frames! Depending on the strength of the currency, the indicator colors changes from blue to red also the orders may also be changed, allowing you to find the strongest and weakest currency at a glance!
Advantages Whatever your trading method and strategy are, it is always important to choose the correct pairs, so this indicator will help you

The Expert Advisor uses a trading strategy based on Fibonacci levels. On the levels of ~38.2,~50.0 and ~61.8, it sets virtual pending orders (Buy Limit, Sell Limit). A grid of virtual pending orders is built in trend direction. Trend is determined using the ZigZag indicator. Orders are closed at a total virtual take profit or a total virtual stop loss. The EA makes a decision at the opening of a new candlestick, so optimization can be performed using open prices.
Settings and Input Parameters

This indicator studies the price action as a combination of micro-trends. All micro-trends are analyzed and averaged. Price movement is filtered based on this averaging. IP_High and IP_Low (blue and red dashed lines) show the instantaneous price movement. They display the forecast only for the current price values, taking into account only the number of bars defined by the 'Filter level' parameter. SP_High and SP_Low (blue and red solid lines) smooth the price movements with respect to history.

Signal Lock Scalper is a signal-based scalper with locking of unprofitable orders , followed by subsequent transfer to breakeven using profitable orders . The EA trades the trend strategy with the use of original built-in indicator for opening and closing orders. To protect the deposit from unexpected circumstances, the EA provides the ability to either lock all orders when reaching the specified drawdown levels, as well as setting a fixed stop order as an oppositely directed pending order. Ther

Samurai Scalping Indy is indicator signal strategy trading with Heiken Ashi, Smoothed Moving Average, and Ichimoku. It'll alert signal with an audio or pop up on the chart for Entry BUY/SELL and Exit BUY/SELL alert signal. Helpful for your system trading. Its easy use to filter major trend and help for scalping strategy to follow the trend. You can ON/OFF audio alert signal on the chart, Notifications alert on mobile, Email message alert. (Setting the alert on Mobile/Email in MT4. Go to Tools >>
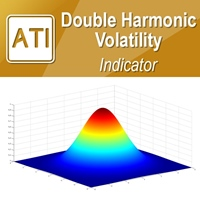
Introduction to Double Harmonic Volatility Indicator Use of the Fibonacci analysis for financial trading can nearly go back to 85 years from today since the birth of Elliott Wave Theory by R. N. Elliott. Until now, traders use the Fibonacci analysis to identify the patterns in the price series. Yet, we could not find any one attempted to use Fibonacci analysis for the Volatility. Harmonic Volatility Indicator was the first technical analysis applying the Fibonacci analysis to the financial Volat

The EA "Opposite" is a full automated trading expert. The EA uses the hedging strategy as follows: He opens a buy and a sell position at one moment and closes one of the positions after reaching the take profit. Then he opens again two orders in two directions, but in one direction the lot size is bigger than in the other one. Thus one has two possibilities: Either one takes the profit in the direction with less lot size or one takes the profit in the direction with bigger lot size. In the last

This long-term trading system works on 10 pairs and M5 timeframe. It uses various trading systems, such as trend trading, countertrend trading and others. This increases the chances of sustained growth and reduces exposure to a single pair or individual operations. The risk is very controlled. The settings are very simple, there is no need to change them. Optimization is not required as well. Realistic management of internal adjustments. Instead of trying to find the exact values that fit the h

Djinn EA is a fully automated trading robot. Djinn expert system analyzes situation on the market and opens positions in a trend direction. The EA is optimized for GBPUSD pair. When used on H1 chart it is prepared to gain profit in long-term period. Recommended charts are M1 and H1.
Settings Lot - volume of the opened position MaxTrades - maximum number of opened buy or sell trades Maxspread - maximum allowed spread Global_TakeProfit - set to True if you want to automatically close orders when

A combination of trend, pullback, range breakouts and statistics in one indicator Mainly functions as an Entry indicator. Works in any pair and timeframe.
Suggested Combination Cluster Helix with Strength Meter Strategy: Confirm signals with ideal strength levels Watch Video: (Click Here)
Features Detects range breakouts on pullback zones in the direction of the trend Analyzes statistics of maximum profits and calculates possible targets for the next signal Flexible tool, can be used in many

MACD ColorBars paints bar frames according to a trend, as well as changes the histogram color when MACD bars are rising or falling (if Color Bars is enabled in the inputs window). The growth of bars indicates a divergence between the fast and slow moving averages, while the decrease indicates their convergence.
Parameters
Fast Moving Average - period of the fast moving average; Slow Moving Average - period of the slow moving average; MA method - moving average smoothing method (simple, expone
Eureka OpgtsFx is a Custom Indicator created to alert the trader when there is a cut-across trend correlations from Daily (D1) to Monthly (MN) Time frames with the belief that the major trend dominates the market and also save the traders from being eaten for breakfast by the big dogs in the financial industry. This indicator is suitable for both the Swing and the Long term Traders due to their peculiar styles of trading and waiting for days, weeks or probably months before taking their profits

The trend beads indicator is software that does not include trend indicators such as moving average, Bollinger bands. This indicator works entirely with price and bar movements. The purpose of the indicator is to calculate the most likely trends. To assist the user in determining trend trends. The user determines the trend direction with the colors on the screen. You can use this indicator alone as a trend indicator. Or with other indicators suitable for your strategy.
Trade Rules Rising trend
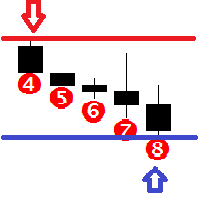
Features This indicator determines consecutive bullish and bearish bars; Determines the High and Low for the last N bars (N can be changed in the settings); It shows the Buy and Sell signals based on the values of other indicators, such as Bollinger Bands, Stochastic and MACD; It graphically displays from 4 to 12 consecutive bullish and bearish bars with an alert; It is possible to disable the alert and unnecessary graphical elements; It is also possible to adjust the number of bars in history,
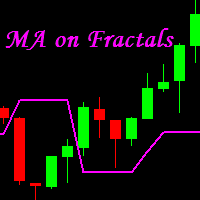
MA on Fractals is a professional trend-following indicator for MetaTrader 4 . It builds a moving average using Bill Williams' fractals. We believe that MA on Fractals is much more efficient than a standard moving average. Its combination with other indicators allows receiving more accurate trading signals. It is most suitable for M15, M30, H1 and H4.
Advantages Unique indicator. Generates minimum false signals. Suitable for beginners and experienced traders. Simple and easy indicator configur

"The Niffler is a fluffy, black and long-snouted beast. This burrowing creature has a predilection for anything glittery. Nifflers are often kept by goblins to burrow deep into the earth for treasure." Newt Scamander, "Fantastic Beasts and Where to Find Them". Niffler is a multicurrency trend trading Expert Advisor based on moving averages. A classic seasoned with the magic of modern technology. Niffler uses SMA, EMA, LMA, SWMA, HMA, AMA, TMA, EPMA and RMA on the timeframes M15, M20, H1, H3, H6,

The super oscillator trading system is a trend finding tool. This system consists of a few indicators and a few algorithms. The aim of this indicator is to direct the investor to find healthy trends.
Trade Rules This indicator has two channel lines. These channels are red lines below zero and above zero. There is a line in two places to process. These are blue lines. There is one trend line, the yellow line. Up trend rules Rule 1 - the yellow trend line should close below the red line below th

The EMA Trend indicator is a trend indicator using two moving averages. These two moving average is the main trend indicator with 89 EMA. 89 EMA is generally regarded as a trend in the Forex market. The second moving average is 49 EMA. A trend was created using two moving averages. You can use this display alone as a trend indicator. Or with other indicators suitable for your strategy. This indicator sends a warning every new trend starts.
Features You can select and edit the periods. Time fra

Range bands works the same way as Bollinger bands except that they are self adapting, with range trading in mind. Unless you are familiar with Bollinger bands, it is a standard deviation indicator that is based around the concept that when price deviates to quickly from the average, it's going to encounter resistance. This is true for all period settings, since standard deviation 2 or 3 is an extreme on any data. This indicator automatically chooses the period that is currently most suitable for

Olofofo Fx Scanner is a Custom Indicator created to scan through the currency pair it is being attached to in the market on ALL time frames simultaneously from a Minute to Monthly looking for just 3 things that make Forex trading exciting and worthwhile to invest in. Once these are found, it alerts the User immediately for a timely action on the part of the Trader. This is a self-fulfilling prophecy of the market, meaning that even if you are a newbie, by the time you see the graphical display o

This simple indicator helps defining the most probable trend direction, its duration and intensity, as well as estimate the possible range of price fluctuations. You can see at a glance, at which direction the price is moving, how long the trend lasts and how powerful it is. All this makes the indicator an easy-to-use trend trading system both for novice and experienced traders.
Parameters
Period - averaging period for the indicator calculation. Deviation - indicator deviation. Lag - calculat

Real Trend Lines is an indicator that calculates trends using a set of channels and using a set of algorithms. This indicator helps to find trend return points. It generally represents an oscillator. This trend tracking system helps the investor to understand small or large trends and determines the direction according to it.
Trending features Up trend Rule 1 - yellow trend line should be below zero level. Rule 2 - the yellow trend line should be in the green and orange channel. Rule 3 - the t

This tool is developed to make your trading risk and profit management easier. It is able to move all of your opened transaction's take profit and stop loss on to one similar price.
How to use Draw a trend line/horizontal line and name it to "tp_" as the take profit line and "sl_" as the stop loss line. The EA will modify all of your orders' and pending orders' take profit and stop loss to the given line. You can drag the gray box to drag the line. You can see the risk in the account currency
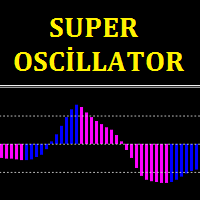
Super oscillator indicator is an oscillator designed to calculate trend reversal points. A set of bar calculations and a set of algorithms to calculate trend reversals. Level probing system with high probability trends. All of these features combine to make it easier for investors to find trends.
Suggestions and Features There are two levels on the super oscillator indicator. They are at levels of 0.5 and -0.5. The oscillator bar should be below -0.5 to find the upward trend. And a blue color

OneWayTicket indicator is based on CCI indicator. In fact, it analyzes multiple CCIs from several timeframes. There are four Ways of OneWayTicket, read from left to right - 15 min, 30 min, 1 hour and 4 hours. The idea is to enter the market when all four CCIs agree on a trend. A trader chooses which timeframes to monitor. When all four ways of the OneWayTicket are green - Buy . When all four ways of the OneWayTicket are bright red - Sell . Original idea from the author: tageiger, revised for the
O Mercado MetaTrader contém robôs de negociação e indicadores técnicos para traders, disponíveis diretamente no terminal.
O sistema de pagamento MQL5.community está disponível para todos os usuários registrados do site do MQL5.com para transações em todos os Serviços MetaTrader. Você pode depositar e sacar dinheiro usando WebMoney, PayPal ou um cartão de banco.
Você está perdendo oportunidades de negociação:
- Aplicativos de negociação gratuitos
- 8 000+ sinais para cópia
- Notícias econômicas para análise dos mercados financeiros
Registro
Login
Se você não tem uma conta, por favor registre-se
Para login e uso do site MQL5.com, você deve ativar o uso de cookies.
Ative esta opção no seu navegador, caso contrário você não poderá fazer login.