 MetaTrader 5
 Experts
 Indicadores
 Bibliotecas
 Utilitários
 Widgets
 Regras
Conheça o Mercado MQL5 no YouTube, assista aos vídeos tutoriais
Como comprar um robô de negociação ou indicador?
Execute seu EA na
hospedagem virtual
hospedagem virtual
Teste indicadores/robôs de negociação antes de comprá-los
Quer ganhar dinheiro no Mercado?
Como apresentar um produto para o consumidor final?
Novos Expert Advisors e Indicadores para MetaTrader 4 - 249
 Os robôs de negociação irão ajudá-lo a fazer transações nos mercados automaticamente, por outro lado, graças aos indicadores você poderá analisar melhor as cotações e prever seu comportamento.
Com ajuda desses aplicativos, você poderá realizar transações no MetaTrader 4 de forma mais informada e melhorar seu potencial.

The background trend is an indicator that helps us to know the trend that is dragging the market. The indicator has 2 possibilities: 1) If the indicator is above zero the trend is buying and the indicator will be green.
2) If the indicator is below zero, the trend is selling and the indicator will be red.
You can download the demo and test it yourself.
The indicator has a text help in the upper right corner, in which it shows whether the indicator has a bullish or bearish background trend.
This is a Semi-Automatic Martingale EA
It is Semi-Automatic because It waits for the first executed order available and then opens a grid of pending limit orders in the same direction of the first one The first order that we usually call the master trade can be opened manually or via any other EA, indipendent from this one There is a dedicated Telegram Group with use cases and best settings here , feel free to join and ask for a functional copy in demo accounts before buying
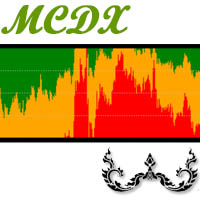
MCDX is an indicator based on specific formula to detect Buy and Sell momentum Red Bar means Price go up and Buy momentum. Green Bar means Price go down and Sell momentum" Height of RED bar > 50% means Bull is in control. i.e. RED more than GREEN to go buy. Lower of Green bar < 50% means Bear is in control. i.e. GREEN more than RED to go sell. DARKER RED COLOR - STRONG Up Trend or Strong Bullish Power
LIGHTER RED COLOR - WEAK Up Trend or Weak Bullish Power
LIGHTER GREEN COLOR - STRONG Down Tr

EA based on Trend and Support Resistance Levels option usage of Auto SL and AutoLot with variable risks results given on EURUSD H1 for last 2.5 years *** used parameters on H1 timeframe bars 25 shift 5 ma index 0.85 open OrdersTotal = 2 Profit Per = 3 % profit to Equity to close trades for lower time frames Inputs will me doubled or tripled ... for higher time frames inputs should me divided / minimized you can use manual entered Lot and Disable AUTOLOT Or you can enable Auto-Lot and

GOLDTRON is a Trend Momentum Algorithm Expert Advisor, specializing on GOLD. It tries to only look for trades on safer periods of the day.
Extremely SIMPLE & EASY-TO-USE, with settings optimized at the backend already. Just set to your desired Risk level and go!
Most of the time, the trades will TP with 1 entry. Like a experienced human trader, It can utilize several grid averaging trades to gain a overall winning edge.
BACKTEST SETTINGS (make sure u have 90-99% tick quality from history cent

PinTouch indicator calculates and draws high-probability direction Entry points with arrows. Moving Averages are applied as the direction filter and visualised at the chart.
To identify Exit points is recommended to use one of these options:
1. The nearest levels calculated by the PivoZone Indicator under the link: https://www.mql5.com/en/market/product/57066
2. Reversal signal
3. Calculated by RR-ratio 4. Of course, your options (post me a message)
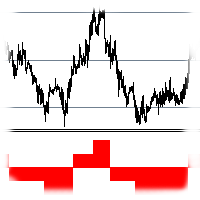
Индикатор показывает количество и направление переходов цены между уровнями сетки. Шаг сетки устанавливается в настройках. Индикатор будет особенно полезен трейдерам, торгующим по Мартингейлу, как инструмент для определения оптимальной точки входа.
ПАРАМЕТРЫ Step: размер шага сетки (например: step = 50, shift = 0, тогда уровни будут иметь значения ...1.1050, 1.1100, 1.1150...) Shift: сдвиг сетки (например: step = 50, shift = 25, тогда уровни будут иметь значения ...1.1075, 1.1125, 1.1175...)

EA RSI MODIF is robot expert advisor with indicator RSI,but this ea use more strategy. Open order BUY = If indicator RSI < Signal buy. Open order SELL = If indicator RSI > Signal sell. More Strategy from Ea RSI MODIF IS = Can use strategy hedging,martingale,lock profit,target profit perday (work on forward test),and many more of strategy. Parameters EA RSI MODIF = ==> Setting indicator RSI : RSI PERIOD = 14 . SIGNAL BUY = 30 .

Hello
This EA for send any indicator Signals (buffer) to your channel in Telegram with photo for chart also you can share your signals with your clients in your telegram please watch the photos
you must have Telegram channel then make bot and give it Permission and get token (watch this video to know how do it) https://www.youtube.com/watch?v=x1bKWFOjSBE
and you must download this files https://drive.google.com/file/d/1pYpnWUr4Kb4aIwdoGVD_9zSH1HWX-tt3/view?usp=sharing then unzip files then pu
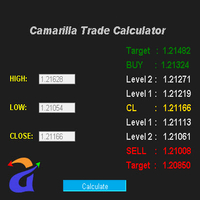
Advanced Camarilla Calculator is one of the most commonly used trading calculators. This calculator can be used to generate levels. Scenario 1 Open price is between H3 and L3 For Long - Wait for the price to go below L3 and then when it moves back above L3, buy. Stop loss will be when price moves below L4. Target1 - H1, Target2 - H2, Target3 - H3 For Short - Wait for the price to go above H3 and then when the price moves back below H3, sell. Stop loss will be when price moves above H4. Targe
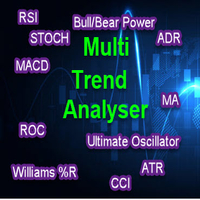
Multi Trend Analyzer MT4 indicator provides signals from the following technical trading indicators: RSI, STOCH, STOCHRSI, MACD, ADX, Williams % R, ATR, Oscillator, ROC and Bull/Bear Power. It supports all time frames, from the 1 minute up to the monthly charts. You can change all indicator inputs. Indicator provide total trend summary. We can easily analysis and study market movement .
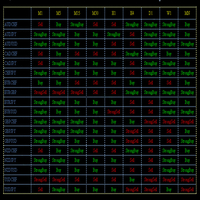
MACD MULTI TIME FRAME WITH MULTI SYMBOLS INDICATOR MACD MTF Indicator visualize all MT4 time frame and trend based on Moving Average Convergence Divergence (MACD) strategy . Indicator have settings for MACD customizing and variable "Symbols "EURUSD,USDCHG,...", which is used to define symbols. , Signals are displayed Buy , Strong buy , Sell, Strong Sell, ### - No Trend Strong Description The Moving Average Convergence/Divergence indicator is a momentum oscillator primarily used to tr
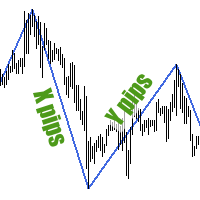
Зигзаг строится по ценовым волнам, размер которых не меньше заданного в настройках. Индикатор не способен нарисовать две вершины (максимум и минимум) на одной свече, поэтому для определения волн небольших размеров следует использовать меньшие таймфреймы графика. Зигзаг в виде гистограммы можете скачать здесь .
Для сбора статистики по размерам ценовых волн используйте идикатор Wave Size Stats .
ПАРАМЕТРЫ MinWaveSize: минимальный размер волны, на котором будет построено очередное плечо зигзаг
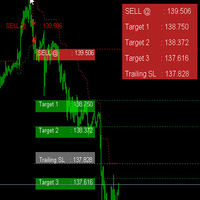
Super Trend Filter Indicator Super trend Arrow Consider as a Master Candle , If super trend in Buy signal , then signal candle calculate as master candle and master candle close above the open candle then calculate filter Buy Arrow. If super trend in Sell signal , then signal candle calculate master candle and master candle close below the open candle calculate filter Sell Arrow. 3 Target with Trailing Stop Loss

Cloud Stair is an Indicator has 2 Cloud (Up Trend and Down Trend). Cloud will turn Red when trend go down. Cloud will turn Blue when trend go up. You can use this indicator as a Support and Resistance level. Trend very strong when there are no opposite side. Open Buy position when the indicator show blue cloud and no red cloud. Open Sell position when the indicator show red cloud and no blue cloud.
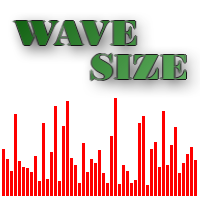
Гистограмма отображает длину ценовых волн, которые не меньше заданного размера. Индикатор наглядно показывает направление коротких/длинных ценовых движений и динамику волатильности. Также Wave Size Histogram подойдет для поиска закономерностей в ценовых движениях. Например, после крупной волны (большое значение гистограммы) зачастую идет слабое движение цены в противоположную сторону (небольшое значение гистограммы), которое идеально пододит для торговли по Мартингейлу.
Для сбора статистики по
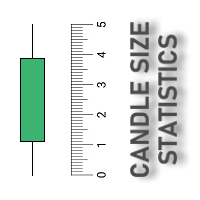
Скрипт собирает статистику по размерам свечей и сохраняет данные в файл CSV. Каждая строка таблицы - это отдельная свеча с ее характеристиками: время, направление (1 - бычья/доджи, -1 - медвежья), размер верхней и нижней тени, размер тела и полный размер свечи.
Индикатор, который отбражает размеры свечей, а также построенные по этим размерам скользящие средние, можно скачать здесь .
ПАРАМЕТРЫ FileName: имя файла, в который экспортируются данные. Если оставить поле пустым, то имя файла - "Cand
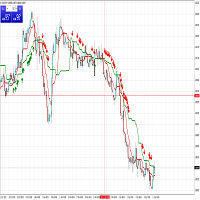
Two Advanced Moving Averages Are you looking for a indicator simple and effective? It will help you! Indicator use two MA to identify trends. User manual: If fast MA(red line) cross over slow MA (green line) and appear first signal buy arrow => you can long. If fast MA(red live) cross below slow MA (green line) and appear first signal sell arrow => you can short.
FREE
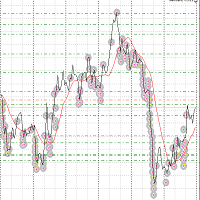
Добрый день. Рынок форекс он иррационален иначе бы на нем бы зарабатывали 95 % трейдеров. Но статистика говорит об обратном 95 % рейдеров сливают свои депозиты. Это факт. И нет ни одного индикатора, который бы предсказывал движение рынка немного заглядываю в будущее. Как только вам показалось, что вот он граальный индикатор или советник - ваш депозит начинает таять. Рынок обязательно накажет и вы потеряете если не весь свой депозит, но значительную его часть точно. Раз рынок форекс иррационал
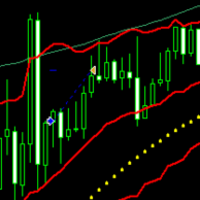
Аренда от 30$ в месяц. Сделка открывается на уровне, определяемом индикатором "полосы Болинджера", стоп лосс двигается по Параболику, т.е риск постоянно снижается. Тейк-профит - определенное количество пунктов. Рекомендую использовать советник на 15 минутном тайм-фрейме на паре EURUSD. В скрине приложен график доходности с января до декабря 2020 года с использованием Мартина. Мaртингейл рекомендую использовать только для разгона депозита. Так же возможно настраивать время начала и окончания то

FzOne EA
FzOne EA is a fully automated robot designed to trade with all pairs.The robot opens pending orders. If the price moves in the right direction and breaks through the placed pending order, the robot starts following it around the market. Thus, the robot forms a grid of open orders at a certain distance. Then the robot follows each open order separately. Upon receiving the desired profit, the robot closes open orders. FzOne EA can open up to 10 trades a day on each currency pairs, dependi

Indicador de tendência Um sistema único para determinar a tendência para cada período de tempo,
Permite que você tenha uma imagem real da tendência de qualquer par de moedas em todos os prazos padrão! Os quadrados verdes são tendência de COMPRA e os quadrados vermelhos são de VENDA.
Técnica de negociação: se os pequenos prazos são opostos à tendência dos mais antigos, então devido à inércia do movimento do mercado, entre nos tempos mais antigos como nas imagens.
FREE

Marginhedged Indicador de informação. Lote - defina o lote necessário para os cálculos, defina usando o campo de entrada MARGININIT - Requisitos de margem inicial para o lote especificado MARGINHEDGED - Margem cobrada de pedidos sobrepostos por lote definido PERCENT - Margem cobrada em pedidos sobrepostos expressa como uma porcentagem Descrição das configurações do indicador: _color - definir cor Um exemplo de uso do indicador:
Uma posição de compra com lote 1 está aberta no mercado, os requ
FREE
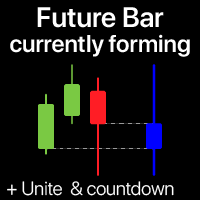
O indicador mostra o candle atualmente em formação no período de tempo selecionado Várias barras podem ser opcionalmente unidas em um único candle: ajuda a ver o panorama geral. Utilitário Multifuncional #1 : 65+ funções, incluindo este indicador | Contate-me para quaisquer dúvidas | Versão MT5 Nas configurações de entrada, selecione o período de tempo que será usado para a barra futura: À direita do preço atual, você verá uma barra se formando no intervalo especificado. Se ativ

Desvende o segredo para um crescimento consistente na sua conta de negociação com Constant Grow, o indicador de negociação definitivo. Alimentada por uma combinação de indicadores avançados, incluindo sinal RVI, média móvel, volumes, estocástico e jacaré, esta ferramenta revolucionária foi meticulosamente testada ao longo de um período de dois anos (2021-2023) para garantir sua eficácia.
Com o Constant Grow, agora você pode proteger e expandir o saldo da sua conta enquanto minimiza os riscos.
FREE

The indicator is a tough Moving Average, weighted by many parameters. Accordingly, you need to trade according to the volatility of the chart. For convenience, moving averages of High, Low, Median ((High-Low) / 2) periods have been added to the indicator.
Input parameters:
IndicatorPeriod (green line): several periods (general-general, calculation for all periods; small- small period; medium- medium period; long- long period)
MaLine- indicator smoothing (Moving Average) (blue line).
PeriodH

This expert Advisor is primarily intended for dispersing small deposits. For example, in testing since 2017, the EA increased its balance from 100 $ to 6 514 361 $
The "Pand0ra EA" expert Advisor is perfect for the "EUR/GBP M30" pair. It uses only two indicators "Previous High Low" and "Top Bottom Price". Each trade is protected by a Stop Loss and Take Profit. In the parameters of the expert Advisor, you can change the percentage of the lot from the Deposit(by default, it is 5%) also,

An indicator showing volumes with the addition of four moving averages of these volumes. What is this indicator for? When analyzing the Forex markets, metals, indices on the H1, H4 charts, at the beginning of the day and at the end of the trading day according to server time, the volumes are less than in the middle of the day. This indicator was created for this. It will help you compare trading volumes within the day. The indicator is distributed as is. Tags: Volume, Custom Volume, MA, Custom M
FREE

The indicator represents 4 moving averages, shifted back. Created, like any moving average indicators, in order to see the approximate balance of volatility and the number of bulls and bears. The difference from other Moving Averages is that an attempt is made here to bring the moving averages of different periods to a common denominator, respectively, to bring the number of traders trading on different timeframes to a common denominator. The indicator is distributed as is.
MnojitelMA1, Mnojit
FREE

The indicator shows the trend change and how the market is changing. When calculating, many parameters are weighed. Therefore, divergence between the chart and the indicator is possible.
Input parameters:
IndicatorPeriod: several calculation periods (small - small period, medium - medium period, long - long period).
You can trade by divergence, analyzed on the resistance and support lines (and other types of graphical analysis), as part of other indicators. Tags: Stochastic, Trend.

Indicator formula: High-Low + Volume; Open-Close + Volume That is, an attempt to bring price and volume to a common denominator.
Input parameters:
IndicatorPeriod: several periods of calculation (small-short-term; medium-medium; long-long-term).
MnojitelLine, MnpjitelLine2 - multiplication of lines for comparison.
AverageVolume - averaging volumes for calculation (needed to remove the dependence on volumes).
If both the indicator and the chart make a fast jump, then we are waiting for a ro

EA - Suporte e Resistência Aconselhamento especializado, compra / venda automática
Este profissional EA, identifica automaticamente apoios e resistências, no prazo definido no cenário. Além do período de tempo, é necessário inserir o número de barras, onde o EA fará a leitura dos dados para calcular os suportes e resistências.
Por exemplo, na configuração de arquivo padrão, o intervalo de tempo é definido como 15 minutos, ele lê as 2 últimas barras começando com a 1 que acabou de terminar (To
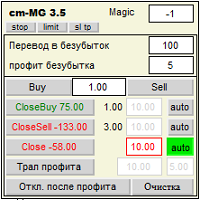
The expert Advisor helps you set a network of pending orders and collect profit from any price movement. You can use it to trade many grid strategies. You can also use it to track open positions.
"Buy Stop — - open a network of pending stop orders for sale "Sell Stop" - open a network of pending stop orders for purchase "Buy Limit" - open a network of pending limit orders for sale "Sell Limit" - open a network of pending limit orders for purchase "Close Buy" - button for closing the entire net

The world of fractals is an ea that uses the power of fractals to detect market turns in the system's recovery algorithm.
This system detects a point to operate if that point is not correct, it uses the fractals to close the cycle with profits.
For this algorithm to be effective, it has filters that improve the efficiency of the system. You can download the demo and test it yourself. Very stable growth curve as result of smart averaging techniques.
"Safety first" approach in development. Stre

G-Labs Market Maker Dashboard — Beat The Market Maker multi-pair scanner for MetaTrader 4. Peak Formation context (PFH/PFL), ADR cycle expansion, Asian session range, stop-hunt proximity, daily range versus ADR, and M15 RSI from one panel.
Monitor your full watchlist without opening a chart for every pair. The dashboard scans symbols in real time and shows where each one sits in a BTMM-style daily workflow: peak formation side, movement in average daily range multiples, Asian range behaviour, s
The EA trading Rsi Divergence strategy. EA uses Grid method. Minimum trading account for 1 pair : 100 $. Designated for trading all major forex pairs. Recommended timeframe : 4H / 1H / 30m / 15m
developed, tested and optimized on " VantageMarkets ", TGLColmex & IFCMarkets platforms. user can run this EA on multiple charts simultaneously. user can use this EA as indicator only.
notice: in the comment section there are settings sets for various charts and brokers. in any case, optimize
O LordTrendSignal é um indicador do mercado financeiro para Meta Trader que verifica os sinais através de tendências e candles, funciona em todos TimeFrames (M1,M5,M15,M30,H1,H4,D1). O LordTrendSignal verifica o sinal através de tendência e candles e informa a você via notificação, alertas via e-mail e push na tela automático. A flexibilidade de tendência do LordTrendSignal é alta, com tudo, junto com outros de nossos indicadores LordAutoFibonacci e LordAutoTrendLine você poderá trabalhar muito
This is MT4 version of StochScanner It scans Stochastic from Multi Symbols and Multi Timeframes and displayed on the dashboard on a single chart. . 4 scanning modes: 1. Mode OverBought/OverSold Indicator scans Overbought and OverSold . OverBought : current stochastic is above level 80 and OverSold : current stochastic is below level 20 2. Mode Signal It means if the previous stochastic is on OverBought or OverSold ( either Main Line and Signal Line ) and the current Main Line cross over the curr

This indicator will create bars in 4 deference colors. The Green Bar is Up Trend. The Red Bar is Down Trend. Lite Green Bar is No Trend (corrective or sideway) but still in Up Trend. Pink Bar is No Trend (corrective or sideway) but still in Down Trend. You can just looking at the Bar's Color and Trade in Green Bar for Long Position and Red Bar for Short Position. You can change all the colors in your way.
1. Alert function : Will popup Alert Windows and play sound when the Bar was changed. 2.
Double Breakout is an automatic expert advisor with two separate strateges that uses martingale. The MACD indicator with adjustable parameters is used as inputs for each flow of orders. The specified takeprofit and stoploss levels are used to exit the position. General recommendation
The minimum recommended deposit is 1000 cents. Spread is recommended not more than 3 points. It is better to use trend currency pairs. The martingale parameter can be set from 0.1 to any value. When martingale i
FREE
Chart Link MT4 allows you to control multiple charts from one chart or multiple charts from multiple charts. Features 1. Synchronised Scrolling : Scrolling the master chart also scrolls all linked sub charts to the same position. Sub charts inherit offset and auto-scroll settings from the master chart. 2. Synchronised Timeframe : Switching the master chart timeframe also switches all linked sub charts. 3. Synchronised Symbol : Switching the master chart symbo
FREE

This utility is designed to receive volumes from order books from larger crypto exchanges and transfer information to the indicator RealCryptoLevels . The RealCryptoLevels indicator by downloading the order book of crypt exchanges with maximum depth shows horizontal volumes of popular crypto currencies on the chart, so you can see not only the volumes, but also the levels and them strength (see screenshots), which is very important for successful trading in all strategies from scalping to m
FREE

Forex trend has always been a friend of traders, and trend indicators help determine the trend and make the right decisions. Most of the trading systems developed by trading gurus are based on the trend.
It is best used on timeframes above the M30, from the beginning of the London session to America.
It should be remembered that there are no indicators that are not wrong. Any strategy requires confirmation of its signals. When building your own system, it is recommended to use several indicat
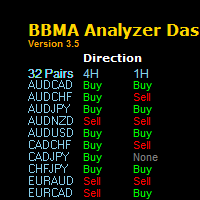
" The one of keys to trading success is a System Technique , MUST HAVE THIS SYSTEM!"
BBMA Analyzer Dashboard
BBMA is a popular technique that uses a combination of 2 indicators in MetaTrader 4 or MT4 which using Bollinger Band and Moving Average Indicator. Summary of BBMA Techniques has the basic elements:
RE-ENTRY
Formed after fall or price increase.
Price will form a Sideway to enable Re-Entry. CSAK (Strong Direction Candle)
The strong direction candle is a close candle direction above

Trend reversal indicator, no repainting. Clean and light rendering There is no alternative buy-sell signal without taking into account the trend. Noise filtering capability. Works with all pairs.
Ideal for beginners and experienced traders It is best used on timeframes above the M30, from the beginning of the London session to America.
It should be remembered that there are no indicators that are not wrong. Any strategy requires confirmation of its signals. When building your own system, it i

This indicator significantly expands the capabilities of the usual ZigZag due to the addition of parabolic channels at the earliest stage of their inception. Download the demo version and test it in the tester. All graphics in the tester are working. But the ZigZag algorithm is special here, because it is implemented on a unique author's ultrafast loop-less algorithm for calculating parabolic regression and calculating its standard deviation. The features of this ZigZag are: Fast calculation, r
O LordOscilatorSignal é um indicador do mercado financeiro para Meta Trader, que utiliza indicadores padrões do mercado; Stochastic, Moving Average, MACD, MA Xover, P.SAR. Exatamente! este único indicador conta com ajuda e auxiliares de (5) indicadores. O LordOscilatorSignal possui um painel gráfico de ótima visualização e entendimento, podendo observar os valores de cada indicador e timeframes. O LordOscilatorSignal identifica através das tendências dos indicadores compras e vendas, se todos in
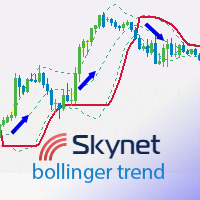
This indicator displays entry points to the market using Bollinger tapes and exit points, which are determined by the specified distance in points from the entry point. If indicator line is above the price - it is "sell" zone for traders, and if indicator line is lower than the price - it is bullish trend. The information panel shows the results of the indicator so that you can configure it more precisely and see how the parameters affect the result. Alert about the points of entry and exit come
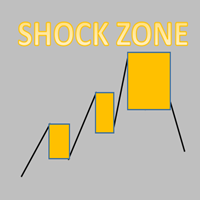
Every trading shock range is a point of gaining momentum!
The stop loss is generally the height of the shock zone.
Take profit depends on personal preference and market position. Generally at least double the height of the shock zone. Being in a good market position, it can have a profit-loss ratio of 5-10
Necessary for traders: tools and indicators Waves automatically calculate indicators, channel trend trading Perfect trend-wave automatic calculation channel calculation , MT4 Perfect tre

Provide ideas for trend trading.
Automatic calculation and generation of trend channels.
The channel line, also known as the pipeline line, is to draw a straight line parallel to the trend line in the opposite direction of the trend line, and the straight line crosses the highest or lowest price of the recent period. These two lines run the price in the middle and have obvious pipe or channel shapes. Necessary for traders: tools and indicators Waves automatically calculate indicators, channel

HAWA GOLD Advanced trading indicator with realistic pre-defined entry and exit levels with almost 80% win rate. The system focuses only Small and Steady Profits . It uses fixed stop loss for every signal to keep money management in place. As compare to other available indicators in market, HAWA gold has unique feature of displaying total profit and loss in terms of points where 1PIP=10points and Minimum profit is 10 pips. Its smart and advanced algorithm detects trend and trend strength usin

The RealCryptoLevels indicator by downloading the order book of crypt exchanges with maximum depth shows horizontal volumes of popular crypto currencies on the chart, so you can see not only the volumes, but also the levels and them strength (see screenshots), which is very important for successful trading in all strategies from scalping to medium-term trading, because you can see the preferences of buyers and sellers at the moment and their mood for the future. The indicator pulls volume dat

Hello everyone
Tasty Lemon is a very easy to use trading system. With the help of the MACD and the ADX indicator, the trading system searches for suitable entry points on the H1 and H4 charts. Since the expert advisor tries to achieve higher profits, it works with a trailing stop. The strategy does not include any Martingale or Grid components. To keep the risk as low as possible, we recommend 1000$ per 0.01 lot and a VPS or a 24/7 computer so that the EA can monitor the positions.
Traded curr
Trend PRO and Breakout EDGE Expert Advisor is developed using the PipFinite Trend PRO and Breakout EDGE Indicators, the best indicators on the market so far. PipFinite Trend Pro's smart algorithm detects the trend, filters out market noise and gives entry signals with exit levels. Whereas PipFinite Breakout EDGE follow a step-by-step system that detects the most powerful breakouts, discover market patterns that generate massive rewards based on a proven and tested strategy. This EA open order
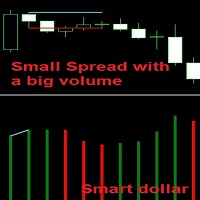
When the current candle is smaller than the previous candle but its volume is greater than the previous one, it means that the market maker is blocking the trend, means that it is in the process of (buying or selling). So when the price closes above that candle, we buy and if it closes below that candle we sell as well. Note that this candle becomes a strong zone as resistance or support. The indicator draws two lines on the divergence spread volume candle, you have to wait for the price to clo
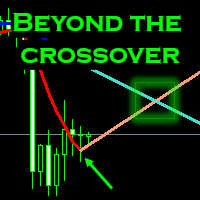
Do you want to anticipate to the crossover movements? Raise your change of success? With this program t he Crossovers can be anticipated before its appearance and thus get a better price. Developed a MA line that anticipated the crossovers and also it can be used for support and resistance level. Check in the backtesting and get the reversal at the beginning. Description MA beyond the crossover is an average price calculation over a certain time period causing a faster reaction be

Скользящее среднее с уровнями, построенными на основе индикатора ATR. В отличие от обычных уровней с постоянным отклонением, которые можно добавить к Moving Average, в уровнях MA with ATR bands учитывается волатильность рынка. Основной вариант использования индикатора: покупать при пробое верхнего уровня, продавать - при пробое нижнего.
ПАРАМЕТРЫ MA_Period : п ериод усреднения скользящей средней MA_Method : м етод усреднения скользящей средней MA_Price : и спользуемая цена для скользящей сред

Genetic Code, is an indicator that differentiates two types of market: the market in range and the market with volatility.
This indicator allows the trader to choose whether to use a range trade or a volatility trade. You can download the demo and test it yourself.
When observing the trace of the indicator it shows us narrow areas that correspond to market ranges.
These ranges always end with a volatility process, so you can work with two conditional pending orders.
When the two DNA strands
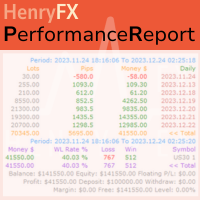
This Performance Report indicator is special design for some trader to analyst his/her performance.
FREE Version, included: - " Display Language "
- " Report Grouping "
- " Count Live Order "
- " Label Row Dis "
- " Label Font Size "
Performance Report Pro : : https://www.mql5.com/en/market/product/58287
Input Parameter: " Display Language "
:: [ English / Chinese ] Display language; " Report Title "
:: Show the report title as you want; " Report Grouping "
::
FREE
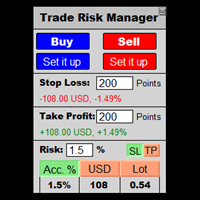
This is a calculator that allows you to manage your trade risk in every trade. Decide in advance the risk you want to assume using Stop Loss or Take Profit; account percentage or specific amount of your currency.
You can also use this tool to can test faster your manual strategies, because Trade Risk Management can be perfectly used on backtesting
For new traders, this may become your favorite tool; allowing you to easily control the risk of your trades, and train your skills trading on Bac

In Front of the Wall It is a trading system based on the detection of a resistance point (WALL).
Once detected, the pullback is operated with a virtual trailing.
If the price breaks the wall, a recovery algorithm is started.
In this algorithm you can select if it is produced with a constant lot or it is increased throughout the algorithm. You can download the demo and test it yourself. Very stable growth curve as result of smart averaging techniques.
"Safety first" approach in development.

In the battle of Kursk every time a Russian tank fell, another appeared to take its place. This system is replenishing the tickets one after another until the market battle is beaten. The system distributes its trade in the key points of the market, in those places where the market gets stuck and it is easier to start the counterattack. So the system first chooses the battle site. Once started, it places as many troops in the rear as necessary to beat the market. No matter how hard the battle is
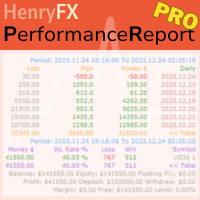
This Performance Report indicator is special design for some trader to analyst his/her performance.
Key Features of the "Performance Report" Indicator
Multi-language support: Choose between English and Chinese as the display language, catering to traders from different regions. Flexible report configuration: Customize the report title and group data based on trading symbols, time periods (daily , weekly , monthly ), meeting individual preferences. Date range selection: Specify the st

Bomber is a fully automated Algorithmic Expert Advisor with multi-Strategies based on our IA optimization on different traditional strategies such as moving average , Ichimoku ,ADX, ... ,You are able to choose any one of the strategies or using all of them same as default setting together. live signal: https://www.mql5.com/en/signals/940345 Telegram group: h ttps://t.me/BomberExpert :::::::::::::::Requirement & Recommendations::::::::::::::: Please send us private message for better support.

Galaxy Gadman X9 is a fully automated Expert Advisor designed for Traders. Galaxy Gadman X9 is a robot trader with multi-currency scalper Expert Advisor. Galaxy Gadman X9 uses a trading system buystop and sellstop orders This robot trades on any Time Frame, Can be use on all pairs. This not martingale, hedge, or averaging Expert Advisor. The system is ready-to-use with the setup is simple,with simple optimization on Stop Loss, and Trailing. Please use a good broker with low spread and low stop
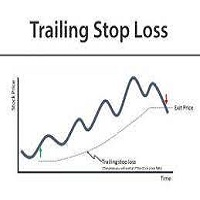
TrailingStopLoss
This tool applies trailingstoploss to orders opened manually or opened by an expert. * For testing on demo it will be open only one buy order so you can see how trailing stop works. It doesnt open orders itself in real or demo accounts but manage your opened orders .
It is simple to use.
Input Parameters
Stoploss calculation level : default is 5, stoploss will be calculation after 5 pips from opening price.
Stoploss movement step : default is 5, Once stop loss is activated,

Bombi is a fully automated Algorithmic Expert Advisor with multi-Strategies based on our IA optimization on different traditional strategies such as moving average , Ichimoku ,ADX, ... ,You are able to choose any one of the strategies or using all of them same as default setting together. Live signal: https://www.mql5.com/en/signals/940345 Telegram group: h ttps://t.me/BomberExpert This EA is optimised for EURUSD on M15 time frame based on default setting .
You can find the full Ver

This is a price action trading robot, the EA will stick to the medium term trend and price to deliver trades. Orders are always protected by the user set stop loss points. With the capital management system, it will help that EA operates in accordance with its purpose. Telegram : https://t.me/trungtqIT
Timeframe is M5,M15. Minimum account balance: $30. Attention is Important: EA only test live on demo or real accounts. Backtest results are just random and inaccurate.
Features: Every trade is p
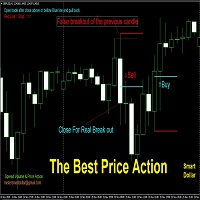
This price action is a very strong strategy, it is based on the fact that the price makes a false breakout of the previous candle and closes in the other side. which means that the area of the false breakout contains very powerful orders which push the price to turn in the other direction. the indicator helps you to choose the time frame for the price action and the minimum number of points for the area which is between the blue and red line. when the indicator gives an alert, it's time to wait
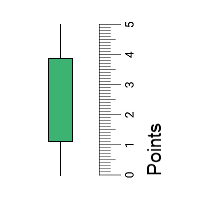
Индикатор отображает High-Low и Open-Close размеры свечей. Также по этим размерам можно построить простые скользящие средние. Линия скользящей средней строится по формуле: Линия MA = MA(Period) * Delta. Чтобы скрыть скользящую среднюю, достаточно установить ее период равным 0.
Чтобы собрать статистику по размерам свечей, используйте скрипт Candle Size Stats .
ПАРАМЕТРЫ Period_MA_HL: период усреднения скользящей средней, построенной по размерам High-Low свечей Delta_MA_HL: множитель для High-
O Mercado MetaTrader é a única loja onde você pode baixar um robô demonstração de negociação gratuitamente para testes e otimização usando dados históricos.
Leia a visão geral e opiniões de outros clientes sobre os aplicativos, faça o download para o seu terminal e teste um robô de negociação antes de comprá-lo. Apenas no Mercado MetaTrader você pode testar um aplicativo de forma absolutamente gratuita.

Você está perdendo oportunidades de negociação:
- Aplicativos de negociação gratuitos
- 8 000+ sinais para cópia
- Notícias econômicas para análise dos mercados financeiros
Registro
Login
Você concorda com a política do site e com os termos de uso
Se você não tem uma conta, por favor registre-se