Conheça o Mercado MQL5 no YouTube, assista aos vídeos tutoriais
Como comprar um robô de negociação ou indicador?
Execute seu EA na
hospedagem virtual
hospedagem virtual
Teste indicadores/robôs de negociação antes de comprá-los
Quer ganhar dinheiro no Mercado?
Como apresentar um produto para o consumidor final?
Novos Expert Advisors e Indicadores para MetaTrader 4 - 187

Moving Averages Of Cci This indicator shows you Average of Commodity Channel Index. You can use this indicator for your own experts with iCustom() CCI is in the buffer ( 0 ) and moving average is in the buffer ( 1 ) there are afew parameters for using this indicator on different currencies and different time frames. you can test it and optimize it . Input Parameters: CciPeriod: default is 14 SignalMaPeriod : default is 28 SignalMAMode : default is SSMA

MA Multi-Currencies Multi-Timeframes Histogram BUY/SELL Indicator up to 6 currencies on time calculations based on 6 time frames : M5, M15, M30, H1, H4, D1 Trading Strategies: **TREND shifts to UP trend when Green point appears after Red and Gray points -> Close SELL positions then add new BUY positions on new Green points **TREND shifts to DOWN trend when Red point appears after Green and Gray points -> Close BUY positions then add new SELL positions on new Red points ** Close BUY position

The PM Ichimoku Dashboard will show you 28 Currencies and 2 metals on a single chart all the timeframes (M1 to Month) with their own status for the indicator. How to understand the status: Zero: Tenkan equal Kijun Green/Red Circle: Price above/below Cloud (Kumo) Green Circle + Down arrow: Price above Cloud but Tenkan below Kijun Red Circle+ Up arrow: Price below Cloud but Tenkan above Kijun Grey Circle: Price inside Cloud Indicator Parameter: Tenkan-sen - Tenkan sen period Kijun-sen - Kijun sen

EURUSD H1 (not a "get rich tonight" scheme but a real tool that will help your account equity to grow up steadly) ----- NEW VERSION 2.0 OUT !!! -----
$ 200 Minimum Equity - Follow Trend Strategy - Non-Martingale Averaging with Stop Loss - Technical [MA] + [Candlestick Pattern] + Support / Resistance LOGIC:
1. A. SL_Percent_continue
if true then the stop loss function works, and it is possible to continue trades even if hit by stop loss
B. Risk_Percent_continue
the value

Modificação multimoeda e multitimeframe do indicador Bollinger Bands. No painel você pode ver os rompimentos e toques das Bandas de Bollinger. Nos parâmetros você pode especificar quaisquer moedas e prazos desejados. O indicador também pode enviar notificações quando o preço toca as Bandas de Bollinger, quando a volatilidade atual muda (expande ou cai) e quando o preço toca todas as bandas. Ao clicar em uma célula com ponto final, este símbolo e ponto final serão abertos. Este é o scanner MTF.

Expert Advisor gratuito baseado no indicador "oscilador de RSI". Adequado para pares de divisas como " EUR / USD "no prazo" M15 " (E M5, mas o resultado é pior). Cada transação é protegida por uma perda de parada (42 pontos) e um lucro Take (25 punts). O martingale está programado para 2.0.O expert Advisor também abre uma posição adicional se aparecer um novo sinal, mas na condição de que o primeiro comércio é em lucro. Por padrão, o lote está definido para 0.15. você pode alterá-lo nas configu

Lucky Traders Um Expert Advisor universal com configurações flexíveis, ele funciona com pedidos pendentes. O robô pode ser usado para acelerar pequenos depósitos a partir de 100 unidades de saldo usando as configurações da estratégia de negociação de escalpelamento. O usuário pode escolher o trabalho do consultor com base em sinais de 10 indicadores, dois dos quais são personalizados. O Expert Advisor também pode ser configurado para trabalho sem indicador. Apenas um indicador pode ser selecio
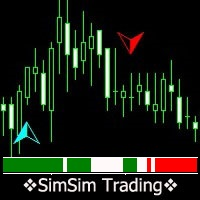
O indicador calcula e resume os dados de 25 indicadores padrão. Como resultado do cálculo, obtemos o nível atual do sinal. Nos parâmetros de entrada, indique o nível mínimo de sinal. Este nível é exibido como um histograma (indicador principal) e setas indicadoras (segundo indicador). Valores positivos do sinal indicam uma possível compra, valores negativos indicam uma venda.
O indicador implementa um sistema de teste que pode ser testado baixando a versão demo. E o usuário principal escolhe

Este Expert Advisor é o resultado de muitos anos de desenvolvimento. Eu me especializei principalmente em estratégias de grade e hedging, transferi toda a minha experiência e conhecimento para este Expert Advisor. Como resultado, temos um template de Expert Advisor altamente personalizável e várias boas estratégias para um trader escolher, estratégias de negociação serão constantemente adicionadas e o Expert Advisor permanecerá relevante e estará no topo mesmo em 10 anos. Em outras palavras, ao
Robô avançado de média móvel (Maab pro 2)
===============
Este Robô é totalmente automatizado e foi criado para todos. O Robô funciona também em contas de cêntimos.
O Ea é baseado em médias móveis
=========================================
Pode estabelecer quais as Médias Móveis que deseja atravessar.
Mas tenha em mente que se usar um quadro mais pequeno receberá mais sinais. E também considere o lucro quando houve um cruzamento, mas o mercado está a negociar de lado.
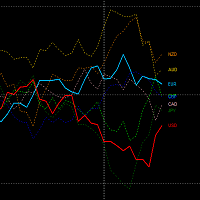
Este indicador permitirá monitorar a força relativa de moedas individuais em toda a cesta monetária.
Obter informações sobre a força das moedas será simples e imediato, assim como a identificação de quaisquer diferenças.
É possível ter três modos de exibição diferentes. De fato, é possível optar por exibir todas as moedas, as moedas do símbolo atual em evidência em comparação com o restante da cesta, ou isolar e exibir apenas as moedas do símbolo em que estamos.
Ele funciona em todos os p
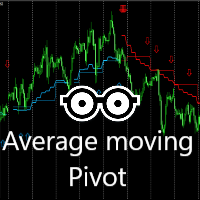
This indicator is very effective for trading everyday. A combination of moving averages and 2X Pivots calculation to produce a very convincing signal everyday. Blue colour signals a buy opportunity. Follow the arrows for possible buy points. The Blue pivots and average line, serves as possible support. Red colour signals a sell opportunity. Follow the arrows for possible sell points. The Red pivots and average line, serves as possible resistance. Best use on the 15 minutes, 30 minutes or 1 hour
FREE
The indicator shows the regression channel, in the calculation of which the gold Fibonacci section is used Levels are not built as graphical objects, but use indicator buffers - this allows using this indicator in Expert Advisors Near the channel borders price corrections and reversals are most probable Allows trend and counter trend trading within the channel The slope of the channel shows the direction of the market, and its width - the current volatility. Works on all timeframes, all currency

Description
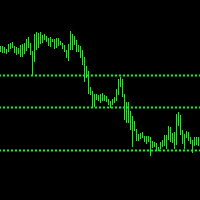
ABC Trend Levels is an indicator that identifies market trends and important trend support and resistance levels.
Recommendations
You can use this indicator to determine the trend and, accordingly, to determine the direction of opening a position or closing an opposite position.
Parameters
===== _INDICATOR_SETTINGS_ ===== - indicator settings Maximum History Bars - maximum number of history bars for calculating the indicator. Average True Range Period - ATR indicator perio
Description
ABC Trend Levels Pro is an indicator that identifies market trends and important trend support and resistance levels.
Recommendations
You can use this indicator to determine the trend and, accordingly, to determine the direction of opening a position or closing an opposite position.
Parameters
===== _INDICATOR_SETTINGS_ ===== - indicator settings Maximum History Bars - maximum number of history bars for calculating the indicator. Average True Range Period - ATR indicator

The principle of this indicator is very simple: detecting the trend with Moving Average, then monitoring the return point of graph by using the crossing of Stochastic Oscillator and finally predicting BUY and SELL signal with arrows, alerts and notifications. The parameters are fixed and automatically calculated on each time frame. Example: If you install indicator on EURUSD, timeframe M5: the indicator will detect the main trend with the Moving Average on this timeframe (for example the Moving

The Unexpected indicator is surprisingly easy to use. You will appreciate the simplicity of the indicator in the very first days of trading. If you correctly determine the beginning of the trend, the result of the transaction will be appropriate. Trading based on trend indicators is the simplest and often the most effective. If you use a live binary options chart as a base, the chances of success are even higher.
This indicator can track the steady price movement in a certain direction. In th
The expert GBP Matrix works on the basis of a set of indicators - CCI, RSI, Bollinger band, as well as a specially developed logical predictability. The dynamic grid method is also used in combination with the Stochastic indicator. It is optimized to work with GBPUSD - 15 minutes. If in your case it is 1:100 it will have to work with a higher initial capital, for example more than 5,000. Usually when the maximum lot size is 50, then when you reach a profit of about 500,000, it is good to start w

The principle of this indicator is very simple: detecting the trend with Moving Average, then monitoring the return point of graph by using the crossing of Stochastic Oscillator and finally predicting BUY and SELL signal with arrows, alerts and notifications. The parameters are fixed and automatically calculated on each time frame. Example: If you install indicator on EURUSD, timeframe M5: the indicator will detect the main trend with the Moving Average on this timeframe (for example the Moving

GALAXY it is a Secure Automated Software for trade Forex market and indices. Architecture is a Fully Automatic Autonomous Robot Expert capable
Independently analyzing the market and making trading decisions
GALAXY It is an advanced trading system. This is a fully automatic Expert Advisor.
NO INPUT TO SELECT FOR THE TRADER ALL AUTO MATED THIS SYSTEM IS ALWAIS IN THE MARKET IN THE TWO DIRECCTION MAKE WINING CYCLES
GALAXY . It is a 100% automatic system, the system contr

A new trend determination algorithm has been developed for this indicator. The algorithm with acceptable accuracy generates input signals and output levels. Strategy for trend trading, filtering and all the necessary functions built into one tool! The principle of the indicator’s operation is to automatically determine the current state of the market when placing it on a chart, analyze historical data based on historical data and display instructions for further actions on the screen to the trad

Seine pro allows you to conduct both automatic and manual trading. It does not place pending orders, but forms a virtual grid according to the settings. The EA showed maximum efficiency on the EURJPY pair. The work of the adviser can be seen on the information panel. For stable work on a cent account you need at least $ 600. With such a deposit, the EA withstands the recoilless price movement of 4000 pips and does not lose the starting deposit When starting, the adviser analyzes the settings and

Scalping Line is an advanced average that we created for use in our trading strategy. The essence of our trading strategy is to open a buy deal when the line is blue and the price drops below the line. Or open a sell deal when the price rises above the line, and the color of the line is red. Thus, we open deals when the price for a short distance goes in the opposite direction from the general trend. We close the deal when we get the minimum profit. We trade on the timeframe M30 or H1. Better to
Indicator for binary options and scalping in the forex markets recommended expiration time 1-2 candles time frames to M30 signals when a blue dot appears it is a buy signal when the red dot appears signals appear with a candle signals do not disappear the indicator is developed on an exclusive algorithm you will not find this anywhere It is recommended to avoid trading during strong news releases

The indicator is designed for binary options and short-term transactions on Forex To enter a trade when a signal appears blue up arrow buy red down arrow sell signal For Forex enter on a signal exit on the opposite signal or take profit For binary options Enter on 1 candle, if the deal goes negative, set a catch on the next candle Works on all timeframes If you apply a filter like Rsi, you will get a good reliable strategy.. The algorithm is at the stage of improvement and will be further develo
ADJUST AFTER PANDEMIC TIPS: This EA was developed during the COVID-19 Pandemic to boaster up buyers account to ease all financial challenges that came with the pandemic, so after the pandemic there is need to make changes and adjustments. PLEASE FOLLOW AND USE THIS NEW SETTINGS: SYMBOL: GBP/USD and GBP/JPY Signal gab: 100 trailing start: 40 trailing pips: 10 Time frame: M1 thanks.
please the below settings are for pandemic you are trading with XAUUSD and GBPUSD
This EA has been tested t
Mean Reversion Probability indicator is a tool based on a mathematical theory of mean reversion . As the markets very often shows the behavior of diverging from its mean, up to a certain distance, and then start to converge its mean again. This is a very well known phenomenon in stochastic processes and the price series is also a stochastic variable so we apply certain mathematical and statistical procedures to estimate the turning point .
Using Mean Reversion indicator, traders could potential

Heikin Ashi is Japanese for "average bar", and may make it easier for you to identify trends. Our version of this popular indicator adjusts the size of the candles based on the zoom level of your chart, making it appear more naturally just like the traditional candlesticks. The colors are selected based on the color scheme you use on your charts, but can be customized anyway you would like. You may also choose whether to display only the Heikin Ashi candles, or show the other selected chart as w
FREE

IntradayMagic прогнозирует характер ATR и тиковых объёмов на 1 сутки вперёд. Индикатор не перерисовывается и не отстаёт. Используя Intraday Magic вы можете значительно повысить качество торговли и избежать излишних рисков. По его показаниям можно детектировать кризисные состояния рынка и моменты разворота тренда, уточнять моменты и направления входов. Это бесплатная ознакомительная версия ограничена символами (парами) включающими GBP. Никаких иных ограничений нет. Для других пар вы можете исполь
FREE

This EA opens trades when a trend inversion occurs. Trades are normaly closed one by one. When an open trades must be recoverd, the EA opens reverse trades using the same criteria of standard orders. This is the free and limited version of the FRT PriceAction Pro. I suggest to use this EA, first with EURUSD at M1 or D1 , on an ECN account with a good leverage and low spread + commissions (not over 7 USD per lot). If you attach the robot to more than one parity on the same account, remember to
FREE

Signal Tester and Trader is an Expert Advisor that is capable to reading most indicators (except for indicator that has string as an input). Custom backtest the signal on a live chart and trade the signal on live account [Full Version Only] .
The expert has 2 modes: Backtest mode (custom backtest on current indicator and strategy settings) Trading mode (trade based on current indicator and strategy settings) [Full Version Only] Available Indicator types: Two cross indicator: indicator that ge
FREE

The indicator shows buy and sell signals. The " CounterTrend 4 " is designed to recognize profitable counter trend patterns from your chart. Features: The CounterTrend 4 is a Counter-Trend Trading with Simple Range Exhaustion System. Signals based on the daily trading range. The indicator calculates the trading range for the last few days and compare the price movements on short time intervals and generating short term reversal points. This is a leading indicator. It works on any instruments.
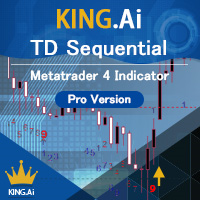
The brand new trading indicator using the TD Sequential strategy is presented by KING.Ai. This indicator were built base on the the theory of TD Sequential . TD Sequential difficult can by seen by human eye. Indicator can help to identical the pattern . KING.Ai Forex trader mainly use this strategy to "See Through" market . We do believe that it is a powerful method to predict reversal time of trend . Ross Hook were developed by Tom Demark, In the late 1970s he devised some indicators called

Pro Trade Signal Arrows is an indicator that generates trade arrows. It generates trade arrows with its own algorithm. Bu oklar alış ve satış sinyalleri verir. Gösterge kesinlikle yeniden boyanmıyor. Sinyalin verildiği nokta değişmez. Tüm grafiklerde kullanabilirsiniz. Tüm çiftlerde kullanabilirsiniz. Bu gösterge, giriş ve çıkış sinyallerini oklar ve uyarı olarak gösterir. When sl_tp is set to true, the indicator will send you the close long and close short warnings It tells you that you should

MRS V2 contrôle le niveau des indicateurs: (Croisement des moyennes mobiles, RSI, Stochastique) Il passe un ordre d'achat ou de vente, si ces indicateurs sont orientés dans le sens que vous avez même défini . Il augmente sans problème les probabilités de réussite! -> pas d'algorithmie secrets ou incompréhensibles ... des indicateurs simples, fiables, qui passent le temps et les aléas des marchés. Basé sur une stratégie simple mais efficace : Croisement des moyennes mobiles lente et rapide dét

Trade signals of advanced moving average, parabolic sar, and stochastic indicator Best used 1-2 hours after high impact news use timeframes 15 min, not suitable for timeframes 30 min and above after the robot makes an order and get a profit or loss, the robot will automatically stop , so your capital is maintained, you can set how many points you want, but you cannot change the loss you want , you can change the amount of loss you want if the order already occurred tips take profit 50 to 150 poi
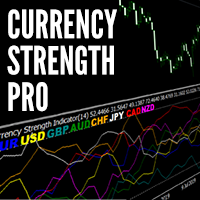
The Currency Strength Meter is the easiest way to identify the strongest and weakest currencies in the market. It works by applying clever calculations to 28 Forex pairs to establish which currencies are the driving force behind price action. By trading strength against weakness, we can greatly increase our chances of success and find some of the highest probability trends to trade. Technical Information
The strength meter uses the relative strength meter which is applied to all 8 major curren

Signal Tester and Trader is an Expert Advisor that is capable to reading most indicators (except for indicator that has string as an input). Custom backtest the signal on a live chart and trade the signal on live account.
The expert has 2 modes: Backtest mode (custom backtest on current indicator and strategy settings) Trading mode (trade based on current indicator and strategy settings) Available Indicator types: Two cross indicator: indicator that generates a signal when 2 lines crossed each
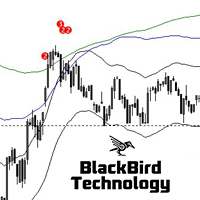
Multi MA Band Signal Indicator is a no-nonsense, no delay, no repaint indicator !
Moving Average bands together with a RSI filter is a 'simple', but very powerful and reliable signal.
Five "moving average bands" generate the signals. By default : MA25, 50, 100, 200 and 400. This can be changed in the parameters as well as the MA mode and the MA band deviation. The signal indicates the number of moving average bands that are crossed. The higher the value the stronger the signal. Two signal l
Trend Direction Estimation * Please use the free demo before renting or buying. This indicator works in all kinds of frames and presents you the trend in the time period you choose. This trial period (Rental for 1 month) offered for promotion is valid for a limited number of copies. At the end of the trial period, longer term rental and unlimited purchase options will also be opened in it's new prices. My expert advisor work is continuing for the strategies I have been developing for the Trend

Trend Direction Arrows * Please use the free demo before renting or buying. This indicator works in all kinds of frames and presents you the trend in the time period you choose. You can try to enter the bars in the bars where the arrows are formed or it helps you to understand the trend direction in the time period you look at. This trial period (Rental for 1 month) offered for promotion is valid for a limited number of copies. At the end of the trial period, longer term rental and unlimited pu
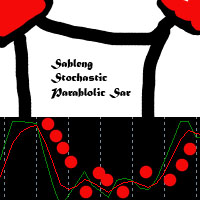
Trade signals of advanced parabolic sar, and stochastic indicator Best used 1-2 hours after high impact news after the robot makes an order and get a profit or loss, the robot will automatically stop , so your capital is maintained, you can set how many points you want, but you cannot change the loss you want , you can change the amount of loss you want if the order already occurred tips take profit 50 to 150 points You can set the robot active at a certain time if the robot has gain

Fourteen plus nine What is it for? Applying Tom DeMark’s TD Sequential serves the purpose of identifying a price point where an uptrend or a downtrend exhausts itself and reverses. . What are the main components of TD Sequential? TD Sequential has two parts – TD Setup and TD Countdown. The first phase of TD Sequential starts with a TD Setup and is completed with a 9 count. When the 9 count is completed, it is at that point, a price pause, price pullback, or reversal is likely. It is also at tha

An indicator that determines the point levels of price resistance. The arrows indicate price bounces in the indicated directions.
Arrows are not redrawn formed on the current candle, shown on the previous candle for convenience.
It has one setting - the formation intensity:
If the parameter is smaller, most of the signals are formed in a wide trend. If the parameter is larger, signals are formed in a narrower trend.
Input parameters
Formation Intensity - Arrow Formation Intensity Num

Forex Day Trader EA This Robot has passed a 20YEAR Backtest before releasing. ================================================
The Robot is based on 3 Indicators to catch profitable trades. ====================================================== As the name suggest it works best on Day Frames.over 90% success rate in the backtests.
This Robot is fully automated and has been created for everyone. The Robot works also on cent accounts. ============================================================
Forex Day Trader EA - reverse
This Robot has passed a 20YEAR Backtest before releasing. ================================================
The Robot is based on 3 Indicators to catch profitable trades. ====================================================== As the name suggest it works best on Day Frames.over 90% success rate in the backtests.
This Robot is fully automated and has been created for everyone. The Robot works also on cent accounts. ================================================

This indicator will draw monthly, weekly, and daily pivot. Pivot line will be calculated automatically again when the period ends. Auto Pivot Metatrader 4 Indicator The Auto Pivot indicator for Metatrader 4 automatically updates the pivot point (PP), support (S1,S2,S3) and resistance levels (r1,r2,r3) every day. Price above the pivot point means positive while price below the pivot point means negative. S3 indicates extremely oversold while price above resistance r3 means extremely overbought.
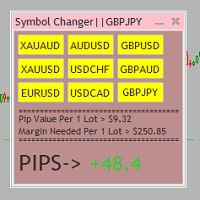
Tired of opening a new chart and applying a template for each Currency pair? So am I. That's why I created an indicator which gives you the option to switch between charts for the first 9 currencies in the Market Watch. In addition to changing between top 9 currencies, the value per 1 lot, the margin required and the amount of pips for any trade you have open for that currency pair are also displayed. Best of all, the colors can be changed!!!
FREE

Money Eruption
A real money maker! No hassle... Easy to configure... Based on your defined risk %... Designed and tested on 3 currency pairs EURCAD, CHFSGD, EURSGD
Some useful features: Easy configuration Just set your risk in percentage of your account balance (that's the all setting you need to go for) Short term results based on 5 minute chart Try your DEMO now. It is all FREE! Enjoy!

本EA采用两个MACD指标在两个时间周期里面同一时间达到开单条件来做多或者做空,EA不设置止损止盈参数没有过多的繁琐设置, 固定手数,对本金要求也不是很高,0.01手50USD-100USD都可以做!!! 由于本EA采用的是两个周期MACD符合条件才开单平仓,所以在自动交易前一定要进行交易品种的数据优化,从中找到最佳的数据设置, 由于优化这个过程很费时,所以现在只公布了一个参数设置,这个设置不是最好的设置但回测的数据看着还可以,如果你有时间可以自己优 化更好的设置参数!!! 希望大家在使用过程中有更好的建议,可以提出来大家共同讨论,让这款EA更好!最后,如果你有更好的设置参数可以的话记得 评论区留言!!!

Forex Trading Profit Panel allow you to place trades with easy peasy way with a maximum profit, it has many many features.
Advantages
You can choose any time period and it'll display all detail.
You can see your whole accounts details, the profit and loss with exact $figure and ratio as well.
Each pair shows the profit they've earned or lose,
The winning and losing trades
Winning VS losing %
and many more
Parameters
HTextColor- Heading Text color for the Account details
DTextColo

Работает на основе скользящей средней с подтверждением RSI. Уровни берет от 1 свечи старшего таймфрейма. Высчитывает зоны перекупленности и перепроданости с помощью скользящей средней и длины 1 свечи старшего таймфрейма и на минимуме покупает, на максимуме продает, закрытие происходит при противоположных сигналах. Настройки по умолчанию для EURUSD 5min. Входные параметры: Per- старший таймфрейм. mnoj-делитель старшего таймфрейма для более точной подгонки(не может быть 0). minlot-лот по которому

This is a small and simple indicator for MetaTrader 4. It displays necessary information for current symbol such as : Symbol name. Total of sell volumes (lots). Total of buy volumes (lots). Total profit or loss. Some properties of this indicator such as 'Font Size', 'Text Color', 'Position', etc are customizable for your best experience. Hope this indicator helps you succeed in your trade.
Buy and Sell stop-limit orders are available in MT5 but not on the Metatrader 4 platform. Now you can place a Buy/Sell limit order or both on your chart with multiple user defined parameters. Save your PIPS and get your orders placed where you want them. Once placed on chart it will place up to 1 order long and short depending upon the choice made by user. Once a Buy or Sell limit order is placed it will not repeat another unless reinstalled on chart. See screenshot below for possible settings.

EA finds the largest volume in the market and determines the level for entry. After crossing the level towards the breakdown, a market order is opened. The EA builds a two-sided grid of orders, adapting to the market. Each direction of orders works separately and has its own take-profit. Thus, the adviser covers the whole trend, starting from its start, while the adviser perfectly passes the flat market condition, trading both directions. Please see all my products: https://www.mql5.com/en/user
FREE
Um Expert Advisor de grade sem usar indicadores. Quando instalado em um gráfico, o EA imediatamente inicia seu trabalho, dependendo das configurações, ele só pode operar COMPRAR, VENDER ou COMPRAR e VENDER ao mesmo tempo. O consultor tem um novo parâmetro de ciclo, se você deseja concluir a negociação, defina o parâmetro NEW_CYCLE = false, e o consultor não abrirá uma nova série de pedidos. cada negociação pode ter um stop loss, take profit e trailing stop. Possui filtros para spread, lote máxi

This indicators automatically draws the Support and resistances levels for you once you've dropped it on a chart. It reduces the hustle of drawing and redrawing these levels every time you analysis prices on a chart. With it, all you have to do is dropped it on a chart, adjust the settings to your liking and let the indicator do the rest. But wait, it gets better; the indicator is absolutely free! Get the new and improved version here: https://youtu.be/rTxbPOBu3nY Parameters Time-frame -> T
FREE
Scalp SWING indicator.
It works on any time frame and Instruments
It works on trending and ranging markets.
The signals are robust and does not repaint.
The system is robust and requires no supporting indicator.
You don’t need any multiple indicators to trade the markets.
The alerts/ notifications can be enabled to gain prompt entries.
The entries are at Top and Bottom of Trend Cycles
It is Very accurate and robust system- yet extremely simplified tools for the pro traders.
Sc
The 'DartFX by WPR' is an easy-to-set Expert Advisor. Williams Percentage Range Williams %R, also known as the Williams Percent Range, is a type of momentum indicator that moves between 0 and -100 and measures overbought and oversold levels. The Williams %R may be used to find entry and exit points in the market. The indicator is very similar to the Stochastic oscillator and is used in the same way. It was developed by Larry Williams and it compares a stock’s closing price to the high-low r

The principle of this indicator is very simple: detecting the trend with Moving Average, then monitoring the return point of graph by using the crossing of Stochastic Oscillator and finally predicting BUY and SELL signal with arrows, alerts and notifications. The parameters are fixed and automatically calculated on each time frame. Example: If you install indicator on EURUSD, timeframe M5: the indicator will detect the main trend with the Moving Average on this timeframe (for example the Moving
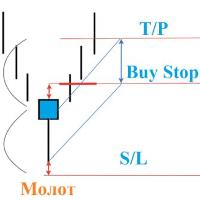
If a candle with a small body and a big shadow is formed, a reversal candle "hammer or shooting star"
The EA detects turning points and starts working!
S / L sets for the shadow + you can specify another number of points
T / P is equal to the size of a long shadow + you can increase it
Additionally set a trailing stop
delete order by time
Transfer to breakeven.
Also in the parameters you can set the settings yourself, such as the shadow, the body, so that the adviser can only cons
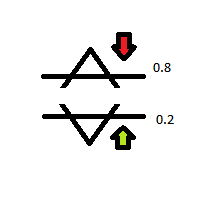
Curve is Basicly from DeMarker Condition Comparing Value of DeMarker Level Current and Before Default DeMarker Setting Periode : 14 Level Below or Equal 0.20 For Buy Area Level Above or Equal 0.80 For Sell Area This Version is using Daily Value of DeMarker, so this EA is recomended for Mid to Long Term, Swing Trader recomended ( Not For Scalp ), because the Signal is rarely. Recomended in MultiPair ( If user want to single Pair, can be attached to one Chart Only ) Stop Loss/Take Profit :Manually

With this indicator, you can easily make price regions in all time zones. In addition, with the automatic supply demand finder, you can ensure that the new regions are found automatically. You can increase your transaction quality by reaching more accurate operations with this auxiliary Tool and indicator.
I share your trial version of EURUSD for free with you. If you want to buy the working version in all parities, you can contact me. +New version Gap Bar Add ( Press G keyboard ) Default co
FREE

Индикатор MT4 для профессионалов. Задача индикатора - определить будущее поведение цены. Он определяет и рисует на графике: вершины и низинки волн в выбранном диапазоне цен линии прогнозируемых каналов на которых задерживается цена зоны вероятного горизонтального канала( флета) уровни Фибоначчи уровни на круглых значениях цены уникальные линии по вершинам волн. процент коррекции или импульса текущей и предыдущей волны время до окончания текущего бара. Принцип работы основан на разработанной но

IntradayMagic predicts the nature of ATR and tick volumes for 1 day ahead. The indicator does not redraw and does not lag behind. Using Intraday Magic, you can significantly improve the quality of trading and avoid unnecessary risks. According to its indications, you can detect the crisis state of the market and the moments of trend reversal, specify the moments and directions of entries. How the indicator works Periodic events, exchange schedules, Bank schedules, expirations, and other similar
Channel Master is unique indicator for automatic channel finding. This indicator is fully adjustable by user. User can also put more instances of Channel Master to one chart with different channel size for better trend filtering. To find more information visit the 747Developments website. Features
Easy to use (just drag & drop to the chart) Fully adjustable Accessible via iCustom function Possible to use with any trading instrument Possible to use on any time-frame
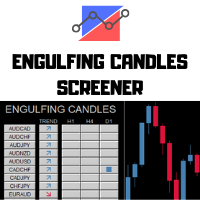
---> Check all the other products <---
The Engulfing Candles Screener is a deeply customizable dashboard.
You can chose a trend filter, using 2 EMAs, with custom periods applied on a custom TimeFrames Then you can choose 3 timeframes to search, any TimeFrame is suitable and the screener will find the engulfing candles in the selected timeframe. 3 Timeframes to scan All the major forex pairs and crosses - up to 28 symbols Deeply Customizable
How to setup the screener:
Let the crosses v

The indicator shows key volumes confirmed by the price movement.
The indicator allows you to analyze volumes in the direction, frequency of occurrence, and their value.
There are 2 modes of operation: taking into account the trend and not taking into account the trend (if the parameter Period_Trend = 0, then the trend is not taken into account; if the parameter Period_Trend is greater than zero, then the trend is taken into account in volumes).
The indicator does not redraw .
Settings Histo

With this indicator, you can easily make price regions in all time zones. In addition, with the automatic supply demand finder, you can ensure that the new regions are found automatically. You can increase your transaction quality by reaching more accurate operations with this auxiliary Tool and indicator.
I share your trial version of EURUSD for free with you. If you want to buy the working version in all parities, you can contact me. +New version Gap Bar Add ( Press G keyboard ) +Redsword
The indicator is designed for Forex Markets. The algorithm is based on Moving average and a few filters. When to enter into transactions The blue arrow is a buy signal. The red arrow is a sell signal Recommended options are set by default. -------------------------------------------------------- You can use Moving average to filter signals. Period 30 Method linear Weighted Apply high You can also use Alligator, Bollinger bands, RSI.
O Mercado MetaTrader contém robôs de negociação e indicadores técnicos para traders, disponíveis diretamente no terminal.
O sistema de pagamento MQL5.community está disponível para todos os usuários registrados do site do MQL5.com para transações em todos os Serviços MetaTrader. Você pode depositar e sacar dinheiro usando WebMoney, PayPal ou um cartão de banco.
Você está perdendo oportunidades de negociação:
- Aplicativos de negociação gratuitos
- 8 000+ sinais para cópia
- Notícias econômicas para análise dos mercados financeiros
Registro
Login
Se você não tem uma conta, por favor registre-se
Para login e uso do site MQL5.com, você deve ativar o uso de cookies.
Ative esta opção no seu navegador, caso contrário você não poderá fazer login.