Conheça o Mercado MQL5 no YouTube, assista aos vídeos tutoriais
Como comprar um robô de negociação ou indicador?
Execute seu EA na
hospedagem virtual
hospedagem virtual
Teste indicadores/robôs de negociação antes de comprá-los
Quer ganhar dinheiro no Mercado?
Como apresentar um produto para o consumidor final?
Pagamento de Indicadores Técnicos para MetaTrader 4 - 99

ATR Channels Indicator Introducing the ATR Channels Indicator, a powerful tool designed to enhance your trading experience and provide valuable insights into market volatility. ATR, short for Average True Range, is a technical indicator that helps traders understand the overall price volatility of an asset or market. The ATR Channels Indicator takes the ATR calculations to the next level by plotting them as dynamic channels on your price chart. These channels represent the range within which pri
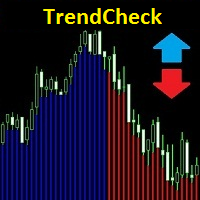
The indicator has a new logic, which significantly distinguishes it from many analogues. It gives early entry and exit signals, does not redraw its values - that is, if the indicator gave a signal to enter a trade, then this signal will not disappear and will not move - it will remain where it appeared, and it also gives signals to opening a candle, which gives the trader a significant advantage in trading.
The indicator is very easy to use. When a red line appears under the candles, you need
RSI Divegence Win Pro
The RSI Drivergent is the best indicator for looking for price reversals.
RSI Drivergent Win Pro has used the strengths and best points of RSI to create in a format for traders to understand more easily.
Suitable for beginners and professional traders.
Case Up Trend : Blue line is below Yellow line. Case Down Trend : Blue line is abve Yellow line.
Usage is very easy. 1. Import the indicator into the MT4 chart. 2. Defind Overbought positions and defind oversold

MT5 Version
Understanding market sentiment is a critical aspect of successful trading. Market sentiment refers to the overall feeling or attitude of traders and investors towards a particular financial instrument, such as a stock, currency pair, or cryptocurrency. It is a collective perception of market participants' emotions and beliefs about the asset's future price direction. Market sentiment can be bullish (positive), bearish (negative), or neutral (sideways). Knowing the market sentiment
O SWING X Black é um indicador MetaTrader 4 (MT4) revolucionário, meticulosamente criado para atender a ambos o comércio manual e automático nos reinos das Opções Binárias e Forex. Sua precisão inigualável, aliada à sua adaptabilidade a vários timeframes, o torna uma ferramenta poderosa para traders que buscam maximizar seus lucros. O SWING X Black é otimizado para o timeframe de 15 minutos, ideal para tomada de decisão rápida e garantia de execuções de trading rápidas. Além disso, ele capacita
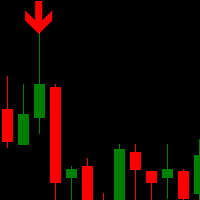
Trend Scalper Arrows is a unique trend reversal 100% non-repainting multi-algo indicator that can be used on all symbols/instruments: forex, commodities, cryptocurrencies, indices, stocks . Trend Scalper Arrows will determine the current trend at its early stages, gathering information and data from up to 10 standard algos When indicator give a valid buy or sell signal, a corresponding arrow will be printed on the chart, open trade at start of the next candle/bar indicating a
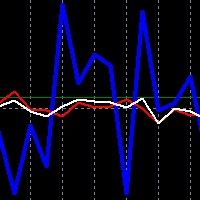
For the new traders of this strategy please remember the convention:
FORWARD trade = BUY AUDUSD and SELL NZDUSD at equal lot size
REVERSE trade = SELL AUDUSD and BUY NZDUSD at equal lot size
Risk is mittigated by the opposing nature of the trades, one tends to offset the other almost 70% of the time, and for when this is not the case we rely on the indicators accordingly - no stops are used in correlation hedge!
This is an enhanced oscillator like analysis of the relationship betw

KT DMA is a modified and advanced version of the classic Displaced Moving Averages with buy/sell crossover alerts and a Multi-Timeframe scanner that shows DMA's direction across each real-time time frame. A Displaced Moving Average is a simple moving average that moves ahead or backward in a time frame (either short-term or long-term). It also allows you to predict price movement more accurately.
Features Depicts the trend direction using the alignment of three moving averages. Buy/Sell signa
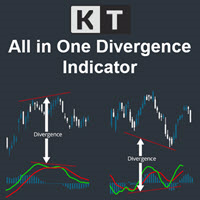
The KT All-In-One Divergence is designed to identify regular and hidden divergences between the price and 11 widely recognized oscillators. This powerful tool is indispensable for swiftly and accurately spotting market reversals. Its a must-have tool in any trader's arsenal, providing clear and accurate divergence patterns. Its accuracy and speed in identifying market reversals are remarkable, allowing traders to seize profitable opportunities confidently.
Features No Interference: You can a

indicator CE and RF Buy-Sell Chandelier Exit and Range Filter Buy Sell
It is the ultimate indicator for telling entry points or entering trades with high accuracy.
Trades must be short term trading only or Scalping only, not suitable for holding positions across several days.
Suitable for beginner traders and professional traders.
Easy Operation 1. Import Indicator, CE and RF into MT4 chart. 2. Waiting for the signal from the arrow pointing up means recommending a long position. and an
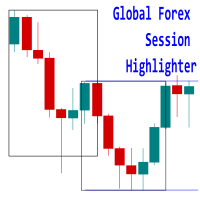
Introducing the 'Global Forex Session Highlighter' , a powerful tool designed to enhance your trading strategy by providing a visual representation of the Three major Forex trading sessions: Tokyo, London, and New York. This indicator is designed to help traders understand the dynamics of the global Forex market by highlighting the trading sessions directly on your MT4 chart. It provides a clear view of when each session starts and ends, allowing you to strategize your trades around the most
Doesn't redraw!
"Xhmaster formula forex indicator" - a new oscillator indicator with regression mathematical modeling of free numerical series. This indicator is 60% more accurate in identifying price reversal points compared to the standard "Xmaster formula" indicator, and it is less sensitive to small price fluctuations. "Xhmaster formula forex indicator" is a unique and advanced tool designed specifically for traders in the Forex market. It provides traders with excellent opportunities for s

here is a link to back test results
https://youtu.be/9BYDwS9aaqM
https://youtu.be/iLxh43HV91Y
However, the difficult task here for traders is to understand and select the indicator or tool that can help them with their trading plan and benefit their trading style. Traders want a tool that requires minimal effort and provides as much support as it can.
There are multiple reasons for which traders need an indicator. One such reason is to determine the buy-sell signals in the market. The
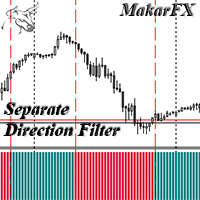
The indicator shows the Buy/Sell direction. The calculations use the opening prices and their rate of change for the billing period - "Calculation period" MTF indicator - "Calculation timeframe", no repaint - NRP. Two display types: "Simple histogram" or "Histogram level crossing" Alerts available: "Chart message", "Push message", "Email message" Two types of signals: "Change direction" or "Crossing level" Level settings: "Crossing UP level" and "Crossing DN level" Color settings. For EA: iCusto
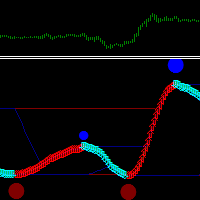
Cyclic Channel Stops - uma ferramenta analítica que permite realizar uma análise cíclica dos movimentos de preços.
O indicador é especializado em modelar o comportamento dos preços para tomar decisões de negociação.
Ajusta-se para funcionar em todos os prazos e instrumentos de negociação. Existem vários tipos de alertas.
Como funciona o indicador
O algoritmo de onda calcula o número especificado de velas e ajusta a linha do indicador ao movimento do preço, continuando-o ou revertendo-o.

TrendStoch Channel Pro
Introducing our revolutionary indicator - "TrendStoch Channel Pro"! This powerful tool empowers traders to gain a comprehensive view of the market by seamlessly combining two essential features - observing larger time trends and the stochastic channel - directly on your chart.
With "TrendStoch Channel Pro," you'll experience a new level of trading precision. The indicator's ability to display larger time trends allows you to identify long-term market directions, enabli

In Forex trading, understanding support and resistance is crucial. Virtually every trading strategy incorporates these levels.
MetaTrader lacks built-in support and resistance calculation features, but there's a solution— the Support and Resistance Lines indicator.
This powerful MetaTrader indicator automatically calculates and displays support and resistance levels for any chosen currency pair or trading instrument.
Benefits of the Support and Resistance Lines indicator:
1. Identify be
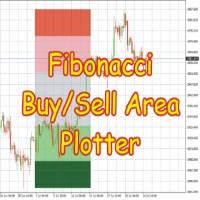
This Indicator is based on Fibonacci levels and draws Buy & Sell Areas. Buy areas are defined in green color (light green & dark green) while Sell areas are defined in red color (light red pink and darker color) Rectangles to easily know that whether price is in buy area or sell area. If price is in gray area, wait for price to come in to your desired area. You can use on any Forex Pairs.
This indicator calculates on the basis of h4 timeframe no matter what time frame you have selected, its cal

All Symbols AND All Time frames Scan
Document Introduction
The ABCD is a basic harmonic pattern. The ABCD pattern is a visual, geometric chart pattern comprised of three consecutive price swings. It looks like a diagonal lightning bolt and can indicate an upcoming trading opp
Analise rapidamente a estrutura do mercado com esta ferramenta e tire partido dos níveis de preços importantes.
Estrutura do mercado Este indicador personalizado traça os níveis de preços importantes, que podem ser utilizados como pontos de entrada ou objectivos de lucro.
Identificar o seu intervalo de negociação Faça scalping com este indicador respeitando os pontos de viragem do mercado.
Oportunidades de negociação de breakout Utilize este indicador para detetar oportunidades de b

Multicurrency indicator in table format. Signals appear with confirmation, do not redraw. The indicator works on the current (open) timeframe. Notifications come for an open instrument. The strategy includes: price touching the moving average in the direction of the trend, as well as an extraordinary recalculation of the classic ADX indicator to determine the trend as an additional filtering of entries. Entries are displayed on the chart as arrows and, as mentioned above, the arrows are not redr

The indicator shows the Buy/Sell direction. The calculations use the opening prices and their rate of change for the billing period - "Calculation period" MTF indicator - "Calculation timeframe", no repaint - NRP. Two display types: "Chart default" или "Chart color" For "Chart color" color customization available : "Bar color" Two types stop levels: "Simple stop level" or "Dynamic stop level " Color settings: "Stop level color" Alerts available: "Chart message", "Push message", "Email message" F
Candle Scanner Dashboard is an incredibly powerful tool in the financial markets. It excels at detecting market reversals, trend changes, and retracements. The dashboard displays patterns as they are identified, and with a simple click on each pattern, you can view them on their dedicated charts to precisely locate their occurrences. With its capability to detect 11 popular bullish and 11 bearish patterns, you can trust the dashboard to handle pattern identification effortlessly. It provides an

Indicador equipado com um sistema de cálculo de taxa de vitória [Recursos do Indicador] Este indicador permite a confirmação intuitiva e fácil da análise técnica regular através de sinais de sinais. Além disso, ele pode verificar a adequação dos parâmetros atuais verificando a taxa de vitória e inclui um sistema automático de determinação da taxa de vitória que se abstém de gerar sinais quando a taxa de vitória é baixa. Isso reduz entradas desnecessárias e permite a negociação apenas durante

Indicador equipado com um sistema de cálculo de taxa de vitória [Recursos do Indicador] Este indicador permite a confirmação intuitiva e fácil da análise técnica regular através de sinais de sinais. Além disso, ele pode verificar a adequação dos parâmetros atuais verificando a taxa de vitória e inclui um sistema automático de determinação da taxa de vitória que se abstém de gerar sinais quando a taxa de vitória é baixa. Isso reduz entradas desnecessárias e permite a negociação apenas durante

Indicador equipado com um sistema de cálculo de taxa de vitória [Recursos do Indicador] Este indicador permite a confirmação intuitiva e fácil da análise técnica regular através de sinais de sinais. Além disso, ele pode verificar a adequação dos parâmetros atuais verificando a taxa de vitória e inclui um sistema automático de determinação da taxa de vitória que se abstém de gerar sinais quando a taxa de vitória é baixa. Isso reduz entradas desnecessárias e permite a negociação apenas durante

Indicador equipado com um sistema de cálculo de taxa de vitória [Recursos do Indicador] Este indicador permite a confirmação intuitiva e fácil da análise técnica regular através de sinais de sinais. Além disso, ele pode verificar a adequação dos parâmetros atuais verificando a taxa de vitória e inclui um sistema automático de determinação da taxa de vitória que se abstém de gerar sinais quando a taxa de vitória é baixa. Isso reduz entradas desnecessárias e permite a negociação apenas durante

Indicador equipado com um sistema de cálculo de taxa de vitória [Recursos do Indicador] Este indicador permite a confirmação intuitiva e fácil da análise técnica regular através de sinais de sinais. Além disso, ele pode verificar a adequação dos parâmetros atuais verificando a taxa de vitória e inclui um sistema automático de determinação da taxa de vitória que se abstém de gerar sinais quando a taxa de vitória é baixa. Isso reduz entradas desnecessárias e permite a negociação apenas durante

Indicador equipado com um sistema de cálculo de taxa de vitória [Recursos do Indicador] Este indicador permite a confirmação intuitiva e fácil da análise técnica regular através de sinais de sinais. Além disso, ele pode verificar a adequação dos parâmetros atuais verificando a taxa de vitória e inclui um sistema automático de determinação da taxa de vitória que se abstém de gerar sinais quando a taxa de vitória é baixa. Isso reduz entradas desnecessárias e permite a negociação apenas durante

Indicador com sistema de cálculo de taxa de vitória [Recursos do Indicador] Este indicador permite a confirmação intuitiva e clara da análise técnica regular por meio de sinais de sinais. Além disso, ele pode verificar a adequação dos parâmetros atuais verificando a taxa de vitória e inclui um sistema automático de determinação da taxa de vitória que se abstém de gerar sinais quando a taxa de vitória é baixa. Isso reduz as entradas desnecessárias e permite a entrada apenas durante os períodos

Indicador com sistema de cálculo de taxa de vitória [Recursos do Indicador] Este indicador permite que os traders confirmem de forma intuitiva e clara a análise técnica regular por meio de sinais de sinal. Além disso, pode verificar se os parâmetros atuais são apropriados verificando a taxa de vitória e inclui um sistema automático de determinação da taxa de vitória que se abstém de gerar sinais quando a taxa de vitória é baixa. Isso reduz as entradas desnecessárias e permite a entrada apenas

Indicador com sistema de cálculo de taxa de vitória [Recursos do Indicador] Este indicador permite que os traders confirmem de forma intuitiva e clara a análise técnica regular por meio de sinais de sinal. Além disso, pode verificar se os parâmetros atuais são apropriados verificando a taxa de vitória e inclui um sistema automático de determinação da taxa de vitória que se abstém de gerar sinais quando a taxa de vitória é baixa. Isso reduz as entradas desnecessárias e permite a entrada apenas

Indicador com sistema de cálculo de taxa de vitória [Recursos do Indicador] Este indicador permite que os traders confirmem de forma intuitiva e clara a análise técnica regular por meio de sinais de sinal. Além disso, pode verificar se os parâmetros atuais são apropriados verificando a taxa de vitória e inclui um sistema automático de determinação da taxa de vitória que se abstém de gerar sinais quando a taxa de vitória é baixa. Isso reduz as entradas desnecessárias e permite a entrada apenas

Indicador equipado com sistema de cálculo de taxa de vitória 【Recursos do indicador】 Este indicador permite que você confirme de forma intuitiva e clara a análise técnica normal por meio de sinais de sinal. Além disso, possui um sistema automático de determinação da taxa de vitória que verifica se os parâmetros atuais são adequados e evita a emissão de sinais quando a taxa de vitória é baixa. Isso reduz entradas desnecessárias e permite que você entre em negociações somente quando a taxa de g

12 tipos de análise técnica incluídos! Indicador equipado com sistema de cálculo de taxa de vitória 【Recursos do indicador】 Este indicador permite que você confirme de forma intuitiva e clara 12 tipos de análises técnicas normais por meio de sinais de sinal. Além disso, possui um sistema automático de determinação da taxa de vitória que verifica se os parâmetros atuais são adequados e evita a emissão de sinais quando a taxa de vitória é baixa. Isso reduz entradas desnecessárias e permite que

VWAP Scanner is a multi-timeframe and multi-symbol dashboard and alert that checks all timeframes and symbols to find trading Opportunities based on Vwap Indicator
How to USE VWAP Scanner
First make a text file with name of Symbols Under Terminal\MQL4\Files
Write the name of symbols as its on mt4 with (,) to separate
Example :
EURUSD,USDJPY,USDCAD,GBPUSD,MCRO,MGLD,NIFTY Note- Its works in all Market And save this text file
Inputs of scanner
NameOfSymbolsTextFile = "Symbols

Indicator UU Bands สำหรับเทรดเดอร์ ที่ต้องการความแม่นยำ ในการเข้าเทรด หรือ หาจังหวะในการเข้าเทรด
ใช้ได้กับทุก ทามเฟรม
ข้อมูลของ อินดิเคเตอร์ 1. มี แบนด์ ด้วยกันทั้งหมด 7 เส้น 2. เส้น 3 เส้น ด้านบน เป็นแนวต้าน เคลื่อนที่ แนวต้านที่1 แนวต้านที่ 2 แนวต้านที่3 3. เส้น 3 เส้น ด้านล่าง เป็นแนวรับ เคลื่อนที่ แนวรับที่ 1 แนวรับที่ 2 แนวรับที่ 3 4. เส้นตรงกลาง เป็นเส้นแบ่ง เทรน สีเขียว หมายถึง แนวโน้มขึ้น สีแดง หมายถึง แนวโน้มลง 5. สัญลักษณ์ ลูกศร สามารถนำไปอ้างอิง เป็นจุดเข้าเทรดได้
คำแนะสำหรับกา
MT5 Version GaussChannelPro is a powerful and innovative trading indicator designed to enhance your trading strategy with the precision of Gaussian-based channels. Leveraging the principles of Gaussian (normal) distribution, this indicator creates a unique channel on your price chart, offering valuable insights into market trends and potential turning points. Utilizing advanced statistical analysis, GaussChannelPro calculates the optimal channel boundaries based on historical price data, present

Global Trend Lines
The Buy/Sell Zone Indicator possesses several features that can be used to improve your trading strategy. This indicator helps you identify buy zones and sell zones on the chart. The main features of this indicator are as follows: Identifying Trend Levels: The indicator has algorithms used to identify trend levels. This helps you determine the direction and strength of the trend. Marking Buy and Sell Zones: The indicator marks buy zones and sell zones on the chart. This ass

No mundo das negociações de opções binárias, onde a análise de mercado precisa e a tomada de decisões estratégicas são primordiais, a busca por um indicador excepcional de negociação que possa desbloquear oportunidades lucrativas é interminável. Apresentamos o Indicador Secreto - uma notável ferramenta de negociação de opções binárias para o MT4 que conquistou sua reputação como o melhor e mais forte de sua classe.
O Indicador Secreto é resultado de anos de pesquisa meticulosa, desenvolviment
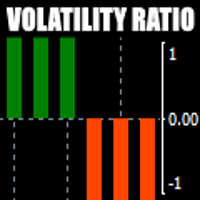
There is always a need to measure if the market is "quiet" or it is volatile. One of the possible way is to use standard deviations, but the issue is simple : We do not have some levels that could help us find out if the market is in a state of lower or higher volatility.
This indicator is attempting to do that : • values above level 0 are indicating state of higher volatility (=GREEN buffer) • values below level 0 are indicating state of lower volatility (=RED buffer)
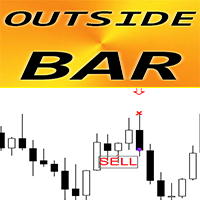
Indicador Forex Padrão de Barra EXTERIOR para MT4
O indicador "OUTSIDE Bar" é um indicador muito poderoso para negociação de Price Action: sem repintura, sem atrasos; O indicador detecta padrões de barras EXTERIORES no gráfico: Barra EXTERIOR de alta - Sinal de seta azul no gráfico (ver fotos) Barra OUTSIDE de baixa - Sinal de seta vermelha no gráfico (ver fotos) Alertas de PC, celular e e-mail estão incluídos Indicador "OUTSIDE Bar Pattern" é excelente para combinar com Níveis de Suporte/Res

Apresentando o PivotXpert , um indicador Multichart avançado projetado para aprimorar sua estratégia de ponto de pivô. Desbloqueie seu potencial sem esforço, com uma interface intuitiva que torna a negociação dinâmica muito fácil.
O modo Multichart do PivotXpert simplifica sua negociação desenhando linhas de pivô em todos os gráficos abertos. Calcule os pips restantes para cada nível sem esforço usando o recurso CalculatePips, ajustando sua estratégia com facilidade.
Personalize sua

Индикатор показывает точки входа. Индикатор не перерисовывает и не исчезает в истории. Индикатор может служить дополнением вашей торговой стратегии. При желание можно настроить индикатор как на агрессивную торговлю( но в этом случае будет много ложных сигналов) так же на пассивную торговлю. Хорошие показатели индикатор показывает сигналы на валютной паре GBPUSD на минутном таймфрейме.

Strength of 8 popular currencies (EUR, GBP, USD, CAD, AUD, NZD, CHF, JPY) is calculated from 28 pairs of Forex market following a Moving Average with custom period and method. You can use it by adding 2 indicators to the chart of Forex pair based on the pair currencies and use it as a confirmation on your strategies.
Currencies: EUR, GBP, USD, CAD, AUD, NZD, CHF, JPY
Inputs: Currency: 1 of the 8 currencies MA Period: Period of Moving Average MA Method: Method of Moving Average (SMA, EMA, S

Introducing the "Ultimate Non Repaint Smart" Indicator - An intelligent non-repaint trading system.
Product Overview:
The "Ultimate Non Repaint Smart" Indicator is a powerful tool designed for traders on the MT4 platform, assisting in optimizing market analysis and trade decision-making. With the combination of various indicators and smart systems, this indicator not only helps identify potential buy and sell points but also provides reliable trading signals.
Key Features:
Non-Repaint S

This is an advanced index algorithm, it provides a very accurate top-bottom signal, it will not frequently appear the wrong signal during the trend, this index does not have any redrawing, drift, or lag behavior. When this signal appears on the chart, it means that the market is about to reverse, or that a period of trend market is over, and then the market will be transformed into a consolidation market, and this indicator does not need to adjust the parameters. It applies to any currency pai

This indicator is very advanced. I dare say that there is no second indicator in the world that describes false breakthroughs so accurately. When the market hits a certain level three times in a row, the market will first break through this level and then return to the inside of the horizontal line. At this time, our indicator will send a signal to alarm that this is a standard fake breakthrough, the index has not been redrawn, the signal has not been delayed, and everything is true and reliable
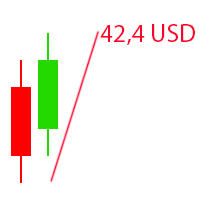
The Visual Result Calculator Indicator is a powerful tool designed to enhance your trading experience on the MetaTrader platform. This intuitive and user-friendly indicator allows you to visualize potential profits or losses on a trading chart, helping you make better-informed decisions and manage your trades with precision. The Indicator displays a dynamic line on the trading chart, representing the potential profit or loss of a trade based on the start and end of the line. Simply click and d

PowerXXX measures the power of the current candlestick and displays it in numerical format and colors. The indicator can cover multiple timeframes and can be placed on the main chart or on the charts of the underlying indicators. The number of timeframes is selectable, as well as the color levels according to the power expressed. In the latest version, the power can be expressed as a function of the opening of the candle itself or as a function of the opening of the total candles before. There

**Apresentando o Binary Smart System: Seu Companheiro Definitivo de Negociação**
O Binary Smart System não é apenas um indicador; é uma ferramenta de negociação sofisticada projetada meticulosamente para capacitar os traders com precisão pontual e sinais oportunos em diversos mercados. Construído com base em algoritmos de última geração e uma coleção abrangente de indicadores técnicos, este sistema é a chave para desbloquear o sucesso na negociação.
**Componentes do Indicador:**
1. **Médi
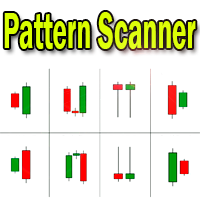
Candlestick pattern indicator - display found candlestick patterns on the chart. MT5-version: https://www.mql5.com/en/market/product/103134 Bearish patterns: Bearish Pattern Designations Pattern name SS
Shooting Star STR(S) Evening Star DJ(E) Evening Doji Star DC Dark Cloud Veil BEP Bearish Engulfing Bullish patterns: Designation of bullish patterns Pattern name HMR
Hammer pattern
STR(M) Morning Star DJ(M) Morning Doji Star PRL Piercing Line BEP Bulli
Using Standard Deviation but not sure if the Standard Deviation is high or low?
eRSD or Easy Relative Standard Deviation comes to your help. Using this you can get a ratio of Standard Deviation to Moving Average and make a good judgement about whether the Standard Deviation is useful or not.
Just add it to the chart and use it away - it supports all periods and moving average calculation methods through the input parameters.

O indicador "Sem repintura" foi projetado para analisar a dinâmica do mercado e determinar momentos potenciais de sinal de negociação. A principal característica deste indicador é a ausência de repintura de sinais, o que contribui para uma previsão mais precisa e confiável dos movimentos de preços no mercado.
Mecanismo de Operação: O indicador "Sem repintura" utiliza vários tipos de elementos gráficos para indicar sinais de negociação: Setas para cima e para baixo: O indicador marca possíveis

Hello Dear Trader, Today Im Telling You About The "Golden Scalp System V1 " Metatrader4 Golden Scalp System
Scalper with EMA This is a Scalper strategy based on ( Exponential moving average) EMA . Time frame: H1 Pair: EUR/USD, GBP/USD,AUD/USD XAU/USD
Platform Mt4 Indicators for Scalper with Ema: 300 EMA (Exponential Moving Average) ; 500 EMA (Expontial Moving Average); Stochastic (5,3,3) Long Entry
1) 300 EMA > 500 EMA .
2) Find significant levels of support.
3) Wait for
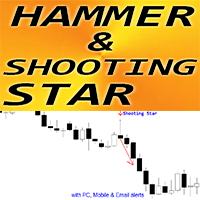
Indicador Forex "Padrão Martelo e Estrela Cadente" para MT4
O indicador "Padrão Hammer and Shooting Star" é um indicador muito poderoso para negociação de Price Action: Sem repintura, sem atrasos; O indicador detecta padrões de alta do Hammer e de baixa da Shooting Star no gráfico: Martelo de alta - sinal de seta azul no gráfico (ver fotos) Bearish Shooting Star - Sinal de seta vermelha no gráfico (ver fotos) Alertas de PC, celular e e-mail estão incluídos Indicador "Padrão Martelo e Estrela

**"Support and Resistance Breakout" Indicator for MetaTrader 4 (MT4)**
Hello traders and investors on the MetaTrader 4 (MT4) platform,
We are excited to introduce to you the "Support and Resistance Breakout" indicator - a powerful tool designed for MT4 that helps you capitalize on trading opportunities involving support and resistance breakouts effectively and confidently.
**Overview:**
The "Support and Resistance Breakout" indicator is a custom tool built on the MetaTrader 4 platform,

Welcome to the "Keltner Amplified Breakout" Indicator Are you searching for a powerful and effective trading tool on the MT4 platform? Let us introduce you to the "Keltner Amplified Breakout" Indicator. Designed to help you capture potential trading opportunities, this indicator offers the perfect blend of high performance and user-friendliness. Key Advantages: Identify Strong Trends: This indicator utilizes Keltner channels and fractal signals to identify robust upward or downward trends in
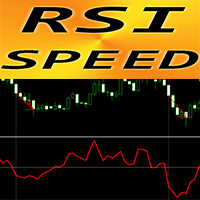
Indicador Forex "RSI SPEED" para MT4 - ótima ferramenta preditiva!
O cálculo deste indicador é baseado em equações da física. RSI SPEED é a primeira derivada do próprio RSI RSI SPEED é bom para escalar entradas na direção da tendência principal Use-o em combinação com um indicador de tendência adequado, por exemplo HTF MA (como nas fotos) O indicador RSI SPEED mostra a rapidez com que o próprio RSI muda de direção - é muito sensível Recomenda-se usar o indicador RSI SPEED para estratégias de

This is a combination of multiple oscillators into a single divergence system that creates the impression of a more reliable divergence indicator. It is multi-currency based and works best on 15 minutes timeframe and above. Every time a signal is generated, it shows an alert to the user. It is more ideal if combined with other price action indicators or trading systems.

Hidden Gap by MMD Hidden Gap by MMD is a unique indicator that detects hidden gaps between three consecutive candles. This observation isn't my own, but in the MMD methodology, it has its application alongside other original indicators. You can apply this indicator to the chart multiple times and set the interval from which you want to see the hidden gaps. You can show or hide these gaps as needed. For example, you can view the chart at an M5 interval and see hidden gaps from an M15 chart, etc.

Olá,
Está à procura de uma solução ideal para gerar lucros no mercado financeiro na plataforma MetaTrader 4 (MT4)? Apresentamos o "Sonic R Non Repaint Smart": um sistema de negociação inteligente que traz precisão e eficiência para os traders.
Introdução ao "Sonic R Non Repaint Smart":
O "Sonic R Non Repaint Smart" é um sólido indicador de negociação baseado na estratégia de negociação altamente valorizada Sonic R. Oferecemos com orgulho uma solução que não apenas ajuda a identificar com

O indicador MOST é um indicador muito popular usado em outras plataformas, especialmente para ações e índices. A base são médias móveis e níveis altos e baixos. Pode ser apropriado usar a entrada percentual como 2 para ações e índices e 1 - 1,5 para instrumentos cambiais. Você pode fazer seu próprio ajuste para cada instrumento. É um indicador fácil de usar, simples e claro. É mais comum em gráficos diários e de 1 hora. Por enquanto editei apenas para plataforma MT4, caso haja solicitação para M
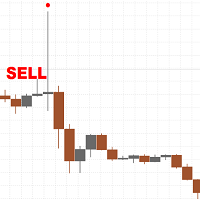
There are only a limited number of copies left, priced at 390 USD . After that, the price will be raised to 450 USD. I develop honest Indicators and know what can work in the market in the long term and what cannot. The classic and most powerful price action pattern is called the pin bar. This pattern works well after the release of fundamental news on M15, M30 and H1 timeframes, but can also be used on other timeframes such as M5 or D1. By default, the settings are set for the H1 timeframe,

Hey traders, it's easy for you to find when to buy or sell signals. Can be used for all forex pairs including gold. How to use this indicator on the M30 or H1 timeframe, for a buy signal, wait until an up arrow appears and for a sell signal, wait for a down arrow, place a stop loss 5-10 points below the arrow. Better trading time on the London and New York sessions and avoid trading when there is news. Happy Trading

25% off. Original price: $40 (Ends in May 15th) Stochastic Scanner is a multi symbol multi timeframe Stochastic dashboard that monitors the indicator for price entering and exiting overbought and oversold in up to 28 symbols and 9 timeframes.
Download Demo here (Scans only M1 and M5) Settings description here MT5 version here
Stochastic Scanner features: Signals price entering and exiting the overbought and oversold zones. Monitors up to 28 customizable instruments and 9 timeframes at
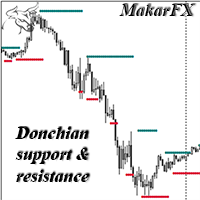
Support and resistance level indicator based on the Donchian channel. The most famous example of trading through the Donchian channel is an experiment with a group of turtles, who earned one hundred and twenty-five million dollars in five years. This indicator can be used as a standalone tool, as well as an additional confirmation. There is MTF, NRP. There are color and thickness settings.

This is a dashboard indicator that displays the auto-calculated risk lot, with the given risk percentage & risk points (Stop Loss) and others. The main function of this indicator is to help you calculate your exact scalping risk lots and swing risk lots. Also it displays the active trades of each pair you've executed with the following: type of trade, lot size, symbol, & equity(+/-). Also displays the bar counter set in every 5-minute bar timer. (whichever time frame you're active, the bar time

Простой и удобный индикатор, указывающий зоны стандартных индикаторов в различных таймфреймах, при необходимости можете в настройках изменить параметры RSI- Relative strength index. Стрелка вверх- если сигнальная линия ниже уровня 300, стрелка вниз- если сигнальная линия выше уровня 70 STOCH- Stochastic. Стрелка вверх- если сигнальная линия ниже уровня 20, стрелка вниз- если сигнальная линия выше уровня 80 ENVELOPE - Envelopes. Стрелка вверх- если свеча открылась ниже красной линии индика

This indicator shows when user set sessions are active and returns various tools + metrics using the closing price within active sessions as an input. Users have the option to change up to 4 session times.
The indicator will increasingly lack accuracy when the chart timeframe is higher than 1 hour.
Settings
Sessions
Enable Session: Allows to enable or disable all associated elements with a specific user set session.
Session Time: Opening and closing times of the user set session
O Mercado MetaTrader contém robôs de negociação e indicadores técnicos para traders, disponíveis diretamente no terminal.
O sistema de pagamento MQL5.community está disponível para todos os usuários registrados do site do MQL5.com para transações em todos os Serviços MetaTrader. Você pode depositar e sacar dinheiro usando WebMoney, PayPal ou um cartão de banco.
Você está perdendo oportunidades de negociação:
- Aplicativos de negociação gratuitos
- 8 000+ sinais para cópia
- Notícias econômicas para análise dos mercados financeiros
Registro
Login
Se você não tem uma conta, por favor registre-se
Para login e uso do site MQL5.com, você deve ativar o uso de cookies.
Ative esta opção no seu navegador, caso contrário você não poderá fazer login.