 MetaTrader 5
 Experts
 Indicadores
 Bibliotecas
 Utilitários
 Widgets
 Regras
Conheça o Mercado MQL5 no YouTube, assista aos vídeos tutoriais
Como comprar um robô de negociação ou indicador?
Execute seu EA na
hospedagem virtual
hospedagem virtual
Teste indicadores/robôs de negociação antes de comprá-los
Quer ganhar dinheiro no Mercado?
Como apresentar um produto para o consumidor final?
Expert Advisors Grátis e Indicadores para MetaTrader 4 - 31
 Os robôs de negociação irão ajudá-lo a fazer transações nos mercados automaticamente, por outro lado, graças aos indicadores você poderá analisar melhor as cotações e prever seu comportamento.
Com ajuda desses aplicativos, você poderá realizar transações no MetaTrader 4 de forma mais informada e melhorar seu potencial.

Change All Timeframe – Instantly Sync Timeframes Across All MT4 Charts Effortlessly change the timeframe of all open charts in MT4 with a single action! The Change All Timeframes script saves time by ensuring all charts update simultaneously, streamlining multi-timeframe analysis. One-Click Timeframe Sync – Instantly change the timeframe on all open charts at once.
Save Time & Effort – No need to adjust each chart manually—boost your trading efficiency.
Seamless Multi-Timeframe Analysis –
FREE

Индикатор сглаженного DeMarker Oscillator (xDeM)
Входные параметры: Period - период усреднения Принцип работы
Индикатор перерассчитывает стандартный технический индикатор DeMarker Oscillato r (дважды усредняет получаемые значения). Период усреднения индикатора соответствует двойному периоду стандартного DeMarker Oscillato r . Например : xDeM с периодом усреднения 7 соответствует DeM c периодом 14. Индикаторный буфер не перерисовывается.
FREE
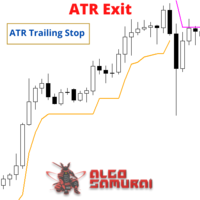
The ATR Exit indicator uses the candle close + ATR value to draw trailing stop lines (orange under buys, magenta over sells) that advance with the trend until the trend changes direction. It uses a multiple of the Average True Range (ATR), subtracting it’s value from the close on buy, adding its value to the close on sell. Moreover, the trailing stop lines are generated to support the order’s trend direction (long or short): In an upward trend, the long trailing stop line (orange line under bu
FREE
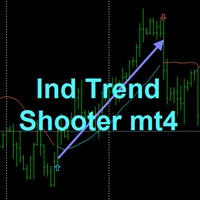
TREND SHOOTER Without alerts
It is a trend indicator based on moving averages that very efficiently calculates changes in market direction.
This has the ability to anticipate changes of direction very early.
FEATURES
This indicator particularly draws two moving averages that are used only to show color changes. they can wear these moving stockings as they wish as they do not affect the color change behavior bullish blue color
bearish red color where the line is interrupted it is not reco
FREE

Advanced Moving Average Example of how the EA works: When the fast moving average line crosses over the slow moving average line, from below it to above it, this implies that the instrument is in an uptrend, hence a potential buy trade might be opened This EA allows you to set up to 21 separate moving average cross over criteria: There are 3 Moving Average Crossover input parameter sets Each set allows you to set the bars used for the Fast and Slow moving average line And it also allows you to
FREE

Descrição do Expert Advisor: Candle Cross DCR Candle Cross DCR é um Expert Advisor totalmente automatizado para MetaTrader 5 que gera sinais de negociação precisos quando uma vela cruza uma média móvel exponencial (EMA) — um sinal clássico e poderoso de reversão ou continuação de tendência. Opcionalmente, o sinal pode ser confirmado com o uso do filtro DCR, composto por três indicadores técnicos: DeMarker, CCI e RSI. Este EA é altamente configurável e adequado tanto para estratégias de scalping
FREE

This forex robot was specially designed for XAUUSD Gold.
The best time frame is H1 and the logid is base on Moving average.
If the price touch the range of 2 moving average, the EA will make an entry.
Stoploss is made based on the outer band of the moving average. The trade time is already ptmized and you can use the time filter to make a good profit. You can change these parameters. tp and stoploss and time trade time and lot size.
FREE

EA SCALPER GHOST PRO
This is single Entry type EA. It use smart alghoritme to detect market movement. It also use Stop loss and take profit . EA will not use any dangerous system like martingale, grid, averaging etc which can cause account blown in a second Tis EA use More than one pair to reduce risk. Right now im using 13 pair at the same time PROMO SALE PRICE Only $99 For first 10 copies!! 4 copies left Next Price will be ====>> $xxxx UP
RAMADHAN KAREEM PROMO ONLY $55 FOR LIFE TIME.. GRAB
FREE

Investment Castle Indicator — Conheça a tendência num relance
Um indicador de tendência limpo e sem repintura que lhe diz instantaneamente para que lado o mercado se inclina em qualquer período. É o mesmo motor de tendência integrado no Investment Castle EA, criado para manter as suas decisões do lado certo do movimento.
O que ele faz por si Direção clara da tendência: veja a direção predominante em cada período num relance. Desempenho no gráfico: a taxa de acerto e a percentagem de operações
FREE
This EA trades using the Bollinger Bands indicator. It offers many trading behaviors and flexible position management settings, plus many useful features like customizable trading sessions and a martingale mode. [ Installation Guide | Update Guide | Troubleshooting | FAQ | All Products | Get Help ] Easy to use and supervise Fully customizable indicator settings Customizable break-even, SL, TP and trailing-stop Works for ECN/Non-ECN brokers Works for 2-3-4-5 digit symbols Trading can be NFA/
FREE
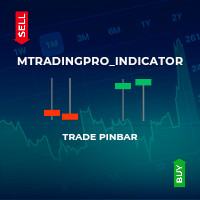
This indicator identifies pinbar candlesticks on the chart and displays an arrow as a trade signal based on the candlestick pattern. It offers user-friendly features, including push notifications and other types of alerts. It is most effective for identifying entry points or potential reversals at premium or discount prices. Additionally, it works on any time frame.
FREE
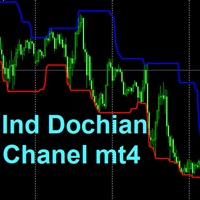
The Donchian channel is an indicator that takes a series of user-defined periods and calculates the upper and lower bands. Draw two lines on the graph according to the Donchian channel formula. This straightforward formula is based on:
The top line is the highest price for the last periods n The bottom line is the lowest price for the last periods n
Trend systems follow periods when support and resistance levels are broken. in this case when the price breaks the upper line or the lower line o
FREE
This is yet another non-parametric ZigZag. Its every upward edge continues until next bar's high is formed below highest low of its bars, and every downward edge continues until next bar's low is formed above lowest high of its bars. In addition to zigzag itself (shown in orange color), the indicator shows signal marks on those bars where zigzag direction changes. The blue arrow up denotes that new bullish edge is started (but not yet completed), whereas the red arrow down denotes that new beari
FREE
FastTMALine_mth_PRT is non-redrawn channel indicator and can be used to identify trend and support and resistance levels.
Indicator settings allow you to assign a specific coefficient to each price channel, which makes it possible to narrow or expand each channel separately. The FastTMALine_mth_PRT indicator is a multicurrency instrument, so the choice of a timeframe depends solely on the trader’s preference. FastTMALine_mth_PRT indicator can be used on any time frame, so you can eas
FREE
The Supply and Demand with Swap zones MTF indicator is a powerful tool for technical analysis that has been modified and enhanced to provide traders with even more valuable information. This tool is based on the rule of supply and demand and allows traders to analyze a chart on three different timeframes at once, providing a more comprehensive view of the market. One of the key features of this indicator is the so-called swap zones, which are areas that have been broken through by the price but
FREE
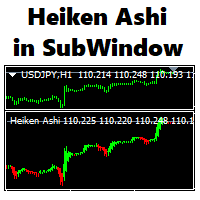
This indicator plots Heiken Ashi candles in a subwindow instead of the main chart, making it possible to analyse HA candles whilst keeping the main chart clean.
- optional bid/close line is provided, stylable, updates on tick - HA candles are stylable via the inputs tab - optional price smoothing to the HA candles, with moving average period and method options - auto-scaling when scrolling back and forth
FREE
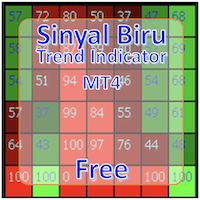
Indicator ini berdasarkan Gain ADX - Follow Trend - Disertai Pivot, Support & Resistant Daily
Dengan indicator ini semoga menjadikan indicator yang porofit able, selama mengikuti signal yang tampil, apabila berwarna Hijau siap2 untuk Buy, dan berwarna Merah siap2 untuk Sell.
Akan tampil signal Sell/Buy di saat gain mencukupi, baik TF Kecil maupun TF Besar TF Besar / High TF adalah Trend Kuat TF Kecil / Low TF adalah Trend Lemah
Open Posisi pada High TF, signal akan menunjukkan Sell/Buy.
FREE
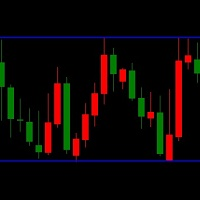
LT Triple Support Resistance Screen Method is a kind of levels indicator that consist of three SR lines. It is built by MQL4 programming language and can be used to MT4 platform. A free version indicator to determine the support and resistance levels easily This indicator works based on the screen method to calculate the most appropriate value for each buffer. A complex algorithm based on long research is applied to this free custom indicator. But this indicator has limited features and simpler
FREE
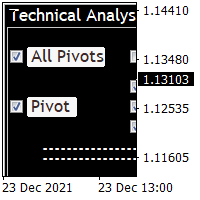
Technical Analysis 4 in 1 give you Pivot points, Resistances, Supports, Fibo, OHCL all together with any timeframe and you can back as you want in candles Pivot points have been a trading strategy for a long time. Using this method, you can understand where the market is going in a day through a few simple calculations. you can switch on/off any line you want. please check the pictures to understand more about this indicator.
FREE

The Trend Finding Channels indicator was developed to help you determine the trend direction by drawing channels on the graphical screen. It draws all channels that can be trending autonomously. It helps you determine the direction of your trend. This indicator makes it easy for you to implement your strategies. The indicator has Down trend lines and Up trend lines. You can determine the price direction according to the multiplicity of the trend lines. For example , if the Down trend lines s
FREE

The Profitunity version of Bill Williams in my vision The EA works according to standard indicators: Aligator + AO + Fractals To move into a deal, a pin bar is also used at a distance of N points from the Aligator (Distance Pin from Alig). To exit positions, there is TP, SL, several Trailling options, closing all orders by the total profit. NOT GRAIL but it works! The Profitunity version of Bill Williams in my vision.
What about the settings of the advisor and how it works. Fix Lot - fixed lot
FREE
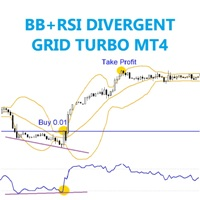
The EA trades on price break out upper or lower BB and were checked trade position by RSI divergent . Any pair, time frame any broker no limited, recommend minimum deposit 500$
SETTING BB_period - Set BB period. RSI_period - Set RSI period Bar_history - Set candle history passed. Lots - start lot. Multiple_lots - Multiply lot for next order. Max_lots - maximum lot. Grid_boost - Frequency of opening position (Less more order). Grid_minimum_pips - Check distance grid from last order. TP_pips
FREE

About:
The Nadaraya-Watson Envelope is a sophisticated yet practical technical indicator that helps traders identify overbought and oversold conditions using advanced kernel regression methods. This is the MT4 only Version.
For MT5 Version go here: https://www.mql5.com/en/market/product/158641/
Key Features ATR-Based Bands: Three upper and three lower bands provide graduated overbought/oversold zones Logarithmic Scale Calculation Center Line - bullish (teal) or bearish (red)
What is the Nad
FREE

The trend is your friend. A simple truth known to every trader. The presented indicator allows you to visualize the current trend. The indicator identifies the trend using the following definition as an algorithm: A trend is a situation when each subsequent maximum price rise is higher/lower than the previous one, and similarly each subsequent maximum price fall is higher/lower than the previous one; The beginning of a new trend is considered to be when the current maximum/minimum overcomes all
FREE
Rectangle Control простой индикатор который отображает на графике панель для рисования прямоугольников с различными настройками, будет удобен тем кто рисует на графике зоны поддержки, сопротивления. Прямоугольник можно нарисовать с заливкой или без, различной толщины и цвета. А также выбрать таймфрейм на котором нарисованный прямоугольник будет отображаться. При нажатой кнопке алерт будет срабатывать оповещение (если прямоугольник находиться ниже цены на верхнем его краю, если прямоугольник нах
FREE

This EA gives traders a clean, full-window view of how large a position each Market Watch symbol can support at different percentages of account balance used as margin. It helps you quickly compare sizing options across symbols and risk levels without ever placing or modifying orders. The goal is simple position-size awareness so you can decide exposure before you trade.
Benefits Shows lot size potential across Market Watch symbols at up to three different % of balance margin levels side-by-sid
FREE
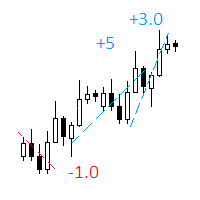
The indicator displays on a chart trading results. You can configure the color and font of displayed results, as well as filter trades based on the magic number. If multiple trades were closed within one bar of the current timeframe, the result is summed and output in one value.
Utility parameters Plot profit in - the format of output results: wither in deposit currency taking onto account commission and swap, or in points. Start from - start processing data at the specified time. Plot last dea
FREE
Trend directional oscillator with additional flat filtering It helps to quickly navigate when changing the direction of price movement and is painted in the appropriate color You can conduct trend and counter trend trade It works on all timeframes, on any currency pairs, metals and cryptocurrency Can be used when working with binary options Distinctive features Not redrawn; Flat filtering - when the histogram is in the yellow zone; Simple and clear settings; It works on all timeframes and on all
FREE

Pronto para turbinar seu jogo de negociação? Bullish Wave é o software de negociação totalmente automatizado que lhe dá a vantagem que você precisa para se tornar um comerciante lucrativo. Com análises poderosas, dados de mercado em tempo real e ferramentas intuitivas.
Com o Bullish Wave, você poderá negociar sem esforço no mercado forex como um profissional. Nosso EA totalmente automatizado funciona com dois indicadores líderes do setor: o indicador Bears Power e o indicador ADX. Abra posiçõe
FREE

Stop Loss and Take Profit Manager The EA allows you to set a Stop Loss (SL) for your orders or positions within milliseconds, regardless of the number of orders. How to Use: Attach the EA to the chart where you want to modify the SL for your orders. Configure the following input settings : Order_Type: Select the order or position types. SetStopLoss: Enable this if you want to set a Stop Loss. StopLoss: Enter the SL price. SetTakeProfit: Enable this if you want to set a Take Profit. TakeProfit:
FREE

Pattern Explorer is a reliable tool for applying all the power of the most popular Japanese Candlestick Patterns . It uses Machine Learning algorithms to confirm all the patterns. What is the most impressive thing about it? Select Take Profit and Stop Loss and click on “Backtest your strategy” button to backtest your strategy in real time and to see according to your selection: Total signals Testable signals (signals that are reliable to be tested) Profitable signals (%) Loss signals (%) Total p
FREE
Discover our sophisticated Expert Advisor (EA) designed for the MetaTrader 4 (MT4) market: IT Bollinger Bands. This free EA exploits a trading strategy based on Bollinger Bands, offering a powerful approach to optimizing your operations in the financial market. Key Features : Bollinger Bands Strategy: Our EA uses Bollinger Bands, a popular approach in technical analysis. Based on the period (20), the standard deviation (2), and the shift of the bands, our EA identifies trading opport
FREE

The NQ_H4_820422556_S_BB_CF_SQX is an algorithmic trading strategy for MetaTrader, tested on NQ using the H4 timeframe from December 7, 2017, to June 2, 2023. There is no need to set up parameters, all settings are already optimized and fine-tuned.
Recommended broker RoboForex because of EET timezone.
You can find the strategy source code for StrategyQuant at the link: https://quantmonitor.net/nasdaq-trend-catcher/
Key details are:
MagicNumber: 820422556 Main Chart: Current symbol and
FREE

Após 7 anos, decidi liberar alguns dos meus próprios indicadores e EAs gratuitamente.
Se você os achar úteis, por favor Mostre seu apoio com uma avaliação de 5 estrelas! Seu feedback mantém as ferramentas gratuitas chegando! Veja também as minhas outras ferramentas gratuitas aqui
_________________________________ Indicador de Largura das Bandas de Bollinger para Análise Avançada da Volatilidade do Mercado O Indicador de Largura das Bandas de Bollinger, desenvolvido cuidadosamente
FREE

Unlock the power of Renewed Hope EA , a fully loaded, ultra-versatile Expert Advisor tailored for traders seeking high-performance automation without complexity. Whether you're a scalper, day trader, or swing trader, this EA gives you full control with OneShot precision , advanced filtering systems, and bulletproof money management. ️ Note: This is the FREE version
Some features are limited in this version. You may not fully experience the EA’s power and flexibility compared to the Premium ver
FREE

Um EA simples, mas muito poderoso. Ele usa como base para abertura de ordens duas media móveis que ao se cruzarem, ordens serão abertas. A ordem aberta será fechada em duas situações: Quando houver um novo cruzamento oposto ao anterior, neste caso o preço tocar a média móvel mais lenta, ou quando atingir a margem automática do Take Profit. Caso o preço siga na direção contrária, ele abrirá novas ordens nos novos cruzamentos das médias móveis para o cálculo do preço médio e fechar todas as ordens
FREE
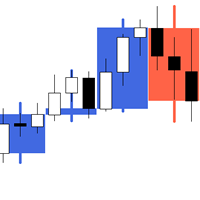
The indicator My Big Bars can show bars (candles) of a higher timeframe. If you open an H1 (1 hour) chart, the indicator puts underneath a chart of H4, D1 and so on. The following higher timeframes can be applied: M3, M5, M10, M15, M30, H1, H3, H4, H6, H8, H12, D1, W1 and MN. The indicator chooses only those higher timeframes which are higher than the current timeframe and are multiple of it. If you open an M30 chart (30 minutes), the higher timeframes exclude M5, M15 and M30. There are 2 handy
FREE

Currency Momentum Pulse 28
Currency Momentum Pulse 28 is a multi-currency momentum indicator for MetaTrader 4 designed to visualize changes in the relative momentum of the eight major currencies: USD, EUR, GBP, CHF, AUD, CAD, JPY and NZD.
Instead of analyzing only the current Forex pair, the indicator processes the 28 combinations of the eight major currencies and displays their relative momentum behavior in a single indicator window.
Normal market fluctuations remain concentrated around the
FREE

Indicator for manual trading. How to use: Open positions on STDV 1 or 2. Take Profit is the centerline. How it works: The trading strategy is based on the statistic, which shows that almost 70% of the price movement is within the STDV 1 and 95% between STDV 2 and 99% between STDV 3.
The price swings around the midline, and when it reaches STDV 1, it has a 70% chance of going back to the midline.
FREE

This indicator helps you to scan symbols which are in the Market Watch window and filter out a trend according to RSI.
The relative strength index (RSI) is a technical indicator used in the analysis of financial markets. It is intended to chart the current and historical strength or weakness of a stock or market based on the closing prices of a recent trading period. The indicator should not be confused with relative strength. The RSI is classified as a momentum oscillator, measuring the veloci
FREE

The utility places a grid of pending orders. You can select the number of orders in the grid, the step between orders, multiplier for the order size, SL and TP levels and the magic number. If you use a profit bucket , please note that it applies to all orders on the current currency pair with the current magic. If you want to use several grids with independent profit buckets at the same time, run several copies of the utility and specify different magics in the settings.
MT5 version of the ut
FREE

Key Features: Automatic swing detection on any timeframe (M1 to MN1) Visual arrow indicators (red for swing highs, blue for swing lows) Adjustable sensitivity with customizable swing strength parameter Dynamic arrow positioning that never overlaps with candles Instant display when changing timeframes - no delays Compatible with MT4 and MT5 platforms Clean, professional interface with minimal screen clutter Lightweight code for fast performance Customizable colors and arrow sizes
Customizable S
FREE

AutoSTPending - Expert Advisor for Automatic Stop Loss and Take Profit
The AutoSTPending expert advisor automatically creates or modifies the Stop Loss and Take Profit levels configured in the properties. It is a user-friendly and easy-to-understand tool. With AutoSTPending, you can simplify and streamline your trading operations by allowing the expert advisor to automatically set and adjust your Stop Loss and Take Profit levels. This allows you to focus on other activities while maintaining ef
FREE
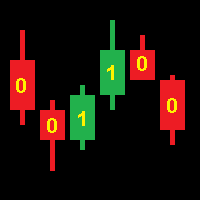
Operation of the CodEx 4 Expert Advisor is based on patterns composed of consecutive candles. Positions are closed when opposite signals appear. Sequences of candles are encoded into an integer according to the following rule. The code number must be converted to binary form and the highest bit must be discarded. The resulting sequence of bits encodes a continuous sequence of candles, where 1 is a bullish candle, 0 is a bearish candle. The higher bits encode the earlier candles. For example: 19[
FREE
The Keltner Channel is a volatility-based technical indicator composed of three separate lines. The middle line is an exponential moving average (EMA) of the price. Additional lines are placed above and below the EMA. The upper band is typically set two times the Average True Range (ATR) above the EMA, and the lower band is typically set two times the ATR below the EMA. The bands expand and contract as volatility (measured by ATR) expands and contracts. Since most price action will be encompasse
FREE
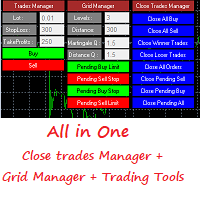
This is a demo version . Download the full version from this link https://www.mql5.com/fr/market/product/84850
Full version Allows you to : Set the number of levels (trades). Lot size and you can do Martingale to raise the lot size for each level. Set distance between levels, and you can manage the distance for each level using Distance Q. Static TP and SL for each level. You can open : BUY STOP / BUY LIMIT / SELL STOP / SELL LIMIT (levels in one click). Close all buy orders. Close all s
FREE
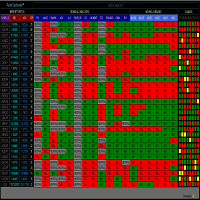
RADAR DASHBOARD
The Radar Dashboard shows the current "Trend Feeling" of each symbol based on the key indicators from the Classic Technical Analysis. As more indicators shift from Sell to Buy, it is suggested that the Trend is now Up (buy). As more indicators change from Buy to Sell, it is suggested that the Trend is now Bearish (sell). The interpretation by the columns of "CANDLES" can also show us possible reversals or pullbacks. For example: A large amount of red squares in H4 (bear candle)
FREE
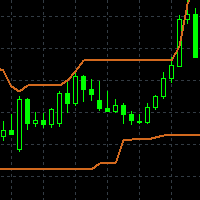
APriceChannel is a modification of the standard Price_Channel indicator. The EA draws 2 levels - the upper level shows the price High for the specified period of time, the lower level shows the price Low for the same period. In addition to the period, you can set vertical offset in points to widen the channel up and down. This prevents false breakouts of current support/resistance levels.
Inputs Period - time period in bars - the number of bars to calculate the price High/Low. Offset up and dow
FREE

O Painel de Gestão de Riscos do TPSpro é uma ferramenta prática para quem deseja manter-se informado sobre o status atual da sua conta. Este painel faz parte do nosso sistema de Gestão de Riscos e está integrado ao nosso produto mais robusto , o TPSpro Risk Manager .
O painel possui três colunas, cada uma contendo informações úteis. A primeira coluna exibe as informações da conta no início do mês atual, mostrando o resultado geral em porcentagem e a moeda do depósito. A segunda coluna e
FREE

RSI based trend strategy for EURUSD. EA use both 5 minutes and 15 minutes time frames to find trends. Please use 15m timeframe for best optimization in EURUSD pair. Inside EA, we have 10 another variables and all of them are optimized for EURUSD even starting StopLoss, Take Profit and Trailing Stop Loss values. StopLoss = 57 Take Profit = 0 TrailingStop = 0 are best optimized values. You can edit these values if they're not suitable. Invisible variables will be updated every month to
FREE

This indicator helps you to Scan symbols which are in the Market Watch Window and filter out trends with alerts. It works based on the effective indicator "SUPERTREND" which is used by many traders for trading: When box color changes to " Green " or " Red " color, it indicates you for trend change for long and short entry. And also you will get alerted on screen. When it changes to " Green ", it indicates you that trend is going upwards, and you can take the long entry. If the color changes to
FREE
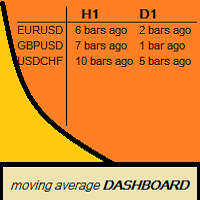
Moving Average Dashboard Bars ago is a unique multi currency, multi time frame dashboard. The dashboard is very simple. You select two moving averages, the instruments and timeframes The Moving Average Dashboard Bars ago then shows how how many bars ago the moving averages made a bullish or bearish crossover. It also shows you in real time when there is a bullish or a bearish crossover. The indicator plots in a subwindow. The Moving Average Dashboard Bars ago can be beneficial if you are trading
FREE

This indicator calculates gann support and resistance prices with use gann pyramid formulation and draw them on the chart. And If you want, Indicator can alert you when the current price arrive these pivot levels. Alert Options: Send Mobil Message, Send E-mail, Show Message and Sound Alert Levels: S1, S2, S3, S4, S5, R1, R2, R3, R4, R5 Inputs: GannInputPrice: Input price for gann pyramid formulation. GannInputDigit: How many digit do you want to use for calculation formula. (The number and the
FREE

What is G Force Trend? G Force Trend is a technical analysis indicator developed for the MetaTrader 4 platform. It analyzes price movements to identify trend direction and generates buy/sell signals. The indicator creates a dynamic channel to track price behavior within the channel and visualizes trend changes. What Does It Do? Trend Detection : Determines whether the price is in a bullish or bearish trend. Buy/Sell Signals : Generates clear buy and sell signals when the price crosses the channe
FREE

This expert advisor trades using the famous Parabolic Sar indicator and implements many other useful features for the exigent trader, like customizable indicator and trading settings, trading sessions and a martingale feature. [ Installation Guide | Update Guide | Troubleshooting | FAQ | All Products | Get Help ] Easy to use and supervise Fully customizable parabolic sar settings Customizable break-even, SL, TP and trailing-stop Works for ECN/Non-ECN brokers Works for 2-3-4-5 digit symbols
FREE
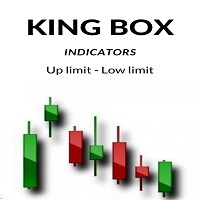
The product helps to find the highest peak and the lowest low. Help investors optimize profits. With a win rate of up to 80%. You do not need to adjust any parameters. We have optimized the best product. Your job just need to see and trade. Products with technological breakthroughs.
............................................................................
FREE

This indicator displays the current SWAP values (for both buy and sell positions) of individual trading instruments directly in the chart.
It allows traders to quickly identify which symbols have positive or negative swaps, helping them make better decisions when choosing positions that may be more advantageous for long-term holding. ️ Indicator Settings Selection of Displayed Symbols The user can choose which instruments are displayed in the table:
• only currency pairs,
• all symbols from the
FREE
MACD Dashboard Panel This indicator helps you to scan symbols which are in the Market Watch window and filter out a trend according to MACD.
Moving Average Convergence Divergence (MACD) is a trend-following momentum indicator that shows the relationship between two moving averages of a security’s price. The MACD is calculated by subtracting the 26-period Exponential Moving Average (EMA) from the 12-period EMA.
The result of that calculation is the MACD line. A nine-day EMA of the MACD called
FREE
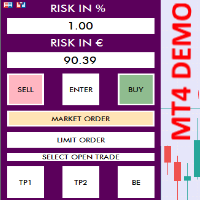
TRADING PANEL - CHART OVERLAY with: PARTIAL TAKE PROFIT ("virtual TP") % RISK LOT SIZE TRAILING STOP LOSS Fast and simple control of your trades this is DEM0 VERISON (for DEM0 acc.) of TRADING OVERLAY with PARTIAL take profit ("virtual TP") and % risk lot size
--- full version available on my 'seller page' as well as version for MT5
Easy lot size calculation with easy SL/TP setting. Your trading will be much more comfortable with this tool !
Works like any EA, add it
FREE
Como Criar um Robô Automatizado de Negociação com Rule Plotter Você já se perguntou como seria poderoso se pudesse automatizar suas estratégias de negociação com apenas alguns clicks do mouse, Imagine ter a liberdade de criar e testar diferentes estratégias de negociação sem a necessidade de mergulhar em códigos complicados. Com o Rule Plotter, essa visão se torna realidade. Aqui vamos explorar como você pode criar seu próprio robô de negociação personalizado usando o Rule Plotter, uma ferrament
FREE

The Night Scalper EA Lite is a fully automated Expert Advisor that trades at night and relies on price reversion. The EA trades using market orders and has the option to use time averaging to improve performance. This EA works best on EURUSD using the M5 timeframe, but will also work on AUDUSD, GBPUSD, NZDUSD, USDCAD, USDCHF and likely many more. A VPS is advisable when trading this system and a low spread and commission based broker is best. Check the comments for back test results and optimiz
FREE

The Magic EMA indicator is of great help in determining trend direction. It can be an excellent addition to your existing strategy or the basis of a new one. We humans can make better decisions when we see better visually. So we designed it to show a different color for rising and falling trends. Everyone can customize this in the way that suits them best. By setting the Trend Period, we can optimize it for longer or shorter trends for our strategy. It is great for all time frames.
IF YOU NEED
FREE

Precision Trading with Advanced Market Analysis! Gain an edge in forex trading with a comprehensive analysis suite that helps you categorize volatility, estimate swing lengths, and make data-driven decisions based on historical market behavior. Key Features: Advanced Swing Detection
Customize sensitivity to price movements by defining minimum bars and price shifts required for a new swing.
Tailor it to your trading style for precise trend identification. Volatility Analysis
FREE

Master Trading Matrix (Free Advanced Multi-Indicator Dashboard)
The Master Trading Matrix is an institutional-grade technical convergence scanner designed to combine 10 foundational momentum, trend, and exhaustion engines into a single, unified execution display. By integrating RSI, Stochastic, CCI, Williams %R, DeMarker, Momentum, RVI, Chande Momentum, Rate of Change, and Ultimate Oscillator into an executive matrix, this utility eliminates multi-window clutter and provides a complete, real-ti
FREE
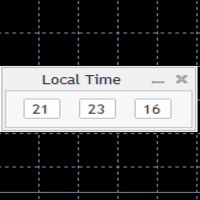
Simply clock. Local time as default. There are possible to Select: Local Time /Server Time /GMT Time as input. Please take into account that the local time is the most accurate. However ,this clock always uses local time seconds, even If GMT / Server Time Is selected. I solved it this way to get more accuracy. Delays can occur when changing minutes or hours, if local time is not selected.
FREE
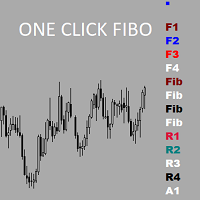
Утилита предназначена для упрощения графического анализа.Настроив один раз , можно сохранить в шаблон,все настройки сохранятся.В настройках меняются уровни фибоначчи , цвета,стили и толщина линий также текстовые метки на кнопках.Есть возможность расширить функционал , добавить временные зоны Фибоначчи ,Фибо арки ,линии по углу ,продление прямоугольных зон до текущей цены.Присылайте рекомендации,все можно осуществить в рамках бесплатной утилиты.
FREE
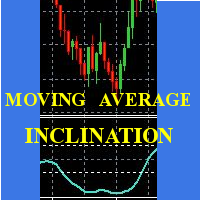
Scalp using the behavior of a short moving average, the indicator gives the slope and identifies the "hyper" moments.
Operational advice:
Use M1 chart. Period 20 : open buy after two rising lows; sell after two max downhill; avoid countertrend openings; when the line goes flat put a stop at the opening price. Avoid actions in low volatility timeslots. When the curve that draws the min / max is very flat, it is better to postpone at least 15'.
Period 50 : matches the trend, when it is at the
FREE

Expert advisor based on your own personal moving average strategy. Whatever your strategy is, it's him. You can use it on all parities. No restrictions. Settings : Buy Settings 1.Moving Average Period 1.Moving Average Method 2.Moving Average Period 2.Moving Average Period Buy Lot Size Buy Stop Loss Level Buy Take Profit Level
Sell Settings 3.Moving Average Period 3.Moving Average Method 4.Moving Average Period 4.Moving Average Period Sell Lot Size Sell Stop Loss Level Sell Take Profit Level
Ve
FREE

Get This: The Ultimate Power Tool for Traders—Draw My Levels! Believe me, folks, this is BIG. This isn’t just some regular, everyday tool—this is *the* essential tool for your trading arsenal. “Draw My Levels” is a simple, elegant, and powerful script that’ll take your trading game to a whole new level. You want precision? You want control? You want to see where the real action is happening on the chart? Then this script is for you. Why Do You Need This Script? Let me tell you, if you’re a trade
FREE

Diversify the risk in your trading account by combining our Expert Advisors. Build your own custom trading system here: Simple Forex Trading Strategies
The expert advisor opens trades when the SMA and RSI are aligned in the same direction and when the Stochastic has left overbought/oversold areas. The 5 and 10 SMA are also programmed to close the trades if the trend changes. The Stop Loss, Take Profit, and Trailing Stop are calculated based on the ATR indicator. The recommended currency pair
FREE
O Mercado MetaTrader contém robôs de negociação e indicadores técnicos para traders, disponíveis diretamente no terminal.
O sistema de pagamento MQL5.community está disponível para todos os usuários registrados do site do MQL5.com para transações em todos os Serviços MetaTrader. Você pode depositar e sacar dinheiro usando WebMoney, PayPal ou um cartão de banco.

Você está perdendo oportunidades de negociação:
- Aplicativos de negociação gratuitos
- 8 000+ sinais para cópia
- Notícias econômicas para análise dos mercados financeiros
Registro
Login
Você concorda com a política do site e com os termos de uso
Se você não tem uma conta, por favor registre-se