Price Reversal Candle Indicator:
When a first buy price action candle formed after Sell price action candle then buy price action candle is called BUY Price reversal Candle.
When a first Sell Price action candle is formed after buy price action candle then sell price action candle is called SELL price reversal Candle.
Take this from previous Job:
Buy Price action Candle : Candle which is closed above previous candle high
Sell Price Action candle : Candle which is closed below previous candle low
Parameter :
Number of candle to draw: Default 500
Time Frame: Drop down of all time frame
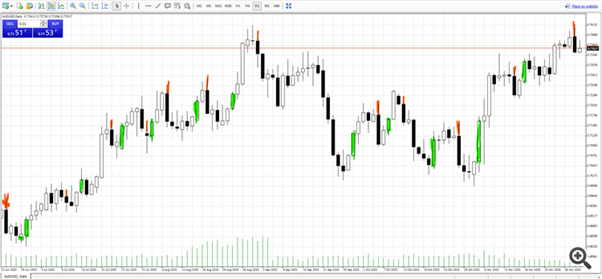
BUY Price reversal Candle-->candle is marked with green arrow below low of candle
SELL price reversal Candle--> candle is marked with Red arrow above high of candle
All Green color are BUY price reversal candle ,All RED color are SELL reversal Candle.
Price Reversal Zig Zag:
Following condition has to check when only a new Price Reversal Candle is formed. NOT FOR ALL CANDLES.
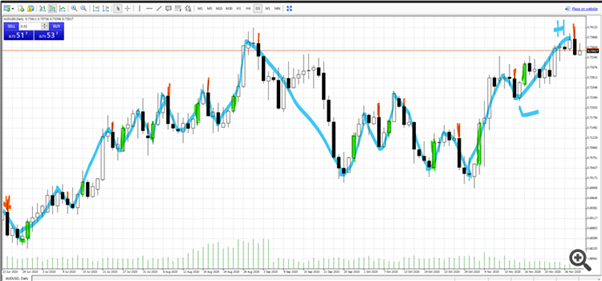
When a Buy Price Reversal Candle is formed ,prior four candle (four is default) close is considered and lowest price point is marked as ZigZag low
When a Sell Price Reversal Candle is formed ,prior four candle (four is default) close is considered and highest price point is marked as ZigZag high
Parameter:
Number of prior candle to mark high /Low : 4 (default)
Time Frame: Drop down of all time frame
Trend Analyzer : (use Price Reversal Zig Zag as baseline code)
Parameter:
Price marking-->Close or low/high (give me in Drop down option)
Number of prior candle to mark high /Low: 4 (default)
Time Frame: Drop down of all-time frame
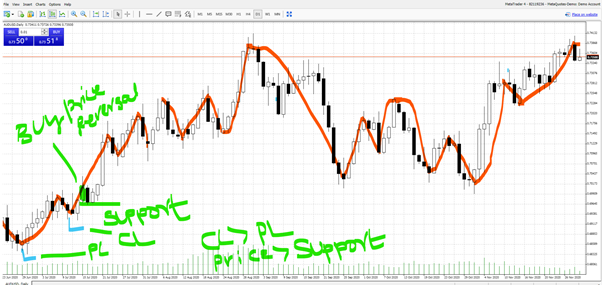
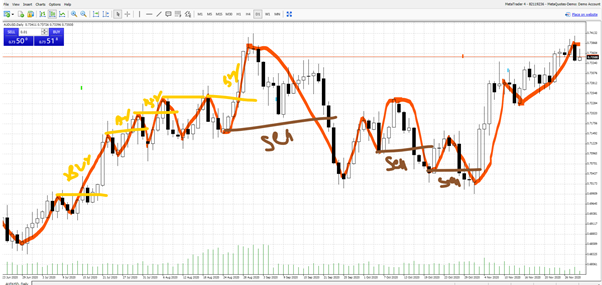
When a buy price action candle is formed, Low of buy price action candle is marked as Support Line.
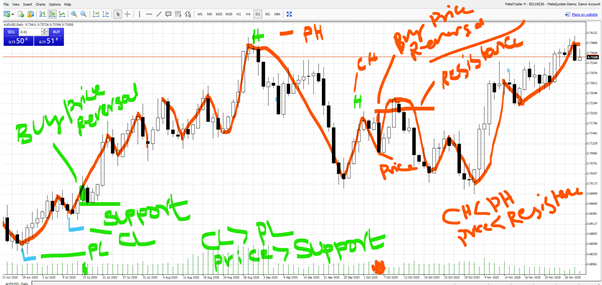
When a Sell price action candle is formed, high of sell price action candle is marked as Resistance Line.
Support and Resistance line need to be drawn on chart and will get redrawn whenever price action candles are formed as per above rules
Rule:
Buy Trend:
When Current Low is greater than previous low
AND
Current Price is higher than support line
Sell Trend:
When Current high is lesser than previous high
AND
Current Price is lower than resistance line
Simple Trend analyses (use base Price Reversal Zig Zag)
Parameter:
Time frame:
Price type: Last candle close /Current price.
and all parameter from Price Reversal Zig Zag
When a buy price action candle is formed, Low of buy price action candle is marked as Support Line.
When a Sell price action candle is formed, high of sell price action candle is marked as Resistance Line.
Support and Resistance line need to be drawn on chart and will get redrawn whenever price action candles are formed as per above rules
When (current price/Last closed candle price) is above current high and Price is above support line , then it buy trend
When (current price/Last closed candle price) is below current low and Price is below resistance line , then it Sell trend
Draw line for high /low as in chart
Trade Volume:
When a buy price action candle is formed then Buy volume should be given.
When a Sell price action candle is formed then Sell volume should be given.
Sell Risk : High of Sell Price action candle+ (N*ATR)
Buy Risk : Low of Sell Price action candle- (N*ATR)
N can be less than one.
Current account available balance *risk percentage = $ to be trade in each trade
$ derived above step should be maximum loss. Volume need to be derived based on that ..
based on Risk above ,Volume should calculated to have maximum loss of $.
It is not that I am trading fixed dollar.. volume is chosen as such my maximum loss is $ calculated ( Current account available balance *risk percentage)
How much volume to have my maximum loss as Current account available balance *risk_percentage ?
Pedidos semelhantes
Hi Team i am looking for the copier, to copy trades to and mt5 broker where the EA Trading is Disabled. when we setup a market trade copiers, it alerts EA Trading is Disabled by the broker. can we develop the copy trading EA which and operate in this environment
""" Market entry on EUR/USD with 0.01 lot, using the account that is ALREADY logged in inside the running MetaTrader 5 terminal. """ import MetaTrader5 as mt5 # ---------------- Config ---------------- SYMBOL = "EURUSD" LOT = 0.01 SIDE = "BUY" # "BUY" or "SELL" DEVIATION = 20 # max slippage in points MAGIC = 234000 SL_POINTS = 0 # 0 = no stop loss, 200 = 20 pips on a 5-digit feed TP_POINTS = 0 # 0 =
Hello, I’d like to develop an AI-powered analysis dashboard for , with a clear, easy-to-use design that works on mobile and web, or on the platform we agree on. I’d like it to include: Main dashboard: Show the market status, the latest data update, and the current signal, if available, including direction, entry price, stop loss, targets, and risk-to-reward ratio. AI signal explanations: Explain in clear language why
GOLD SCALPING BOT STRATEGY Symbol: XAUUSD (Gold vs USD) Broker: Exness Account: Standard Starting Balance: $20 1. TIMEFRAME - Trend analysis: M15. - Entry timeframe: M5. - Trade only when the market has a clear direction. 2. INDICATORS - EMA 50 - EMA 200 - RSI 14 - Support and Resistance 3. BUY RULES The bot must open a BUY trade only when all these conditions are met: 1. EMA 50 is above EMA 200 on M15. 2. Price is
I am looking for an experienced MT5 Expert Advisor developer to build an automated Gold (XAUUSD) trading bot. My requirements are: Automatically identify and draw supply and demand zones on the chart. Identify Order Blocks, Fair Value Gaps (FVG), liquidity sweeps and Market Structure Shifts (MSS/CHoCH). Analyse multiple timeframes and use a higher-timeframe directional bias without unnecessarily blocking valid trades
I’m looking for a **ready-made MT5 scalping EA specifically for Gold (XAUUSD)**. My main requirement is an **HTF scalping strategy**, so I’m looking for an existing robot that is already developed and can be tested before I make the purchase. I would like to test on demo account first, Any available backtest or trading results * Whether I can test it on a demo account * Your price and licensing details I’m
Hello, I am looking for an experienced MQL5 developer to create a professional, reliable, fully customizable Expert Advisor (EA) and trading signal system for MetaTrader 5. 1. Supported Markets The EA must support: Gold (XAUUSD) Silver (XAGUSD) Nasdaq 100 (NAS100/US100) Forex currency pairs Bitcoin (BTCUSD) It must work with MT5 brokers, including Tickmill, where these instruments are available. 2. Two Trading Modes
Hi all I'm looking for a good coder Existing Automated Trading System (Expert Advisor) This EA’s building block is the Bheurekso Pattern (which uses price action) indicators. 1. **Indicator Integration**: The EA should be developed utilizing the Bheurekso pattern indicator. 2. **Sell Signals**: The EA must execute a sell order upon the appearance of any of the following bearish signals or a down arrow that appears
Entry Strategy: Explain exact conditions for opening a trade specific indicators like Moving Averages or RSI, time of day, or price action rules. Exit Strategy: Define when a trade should closeTake Profit, Stop Loss, Trailing Stop, or indicator signals. Daily Trading Rules: Specify daily limits if applicable maximum trades per day, specific trading hours, or maximum daily loss limit. Risk & Position Sizing: Indicate
I want to create my own trading robot that will automatically open and close trades,it's must be operating 24/7 on both the brokers app and the mt5 as well.it must be able to grow small accounts from 10 usd with proper risk management and smart executions.it must operates on the following brokers EXNESS, XM GLOBAL,WELTRADE and DERIV
 Todas as encomendas
 Regras
