New indicator and rule modification

MQL4 Indicateurs Experts

Tâche terminée

Temps d'exécution 32 jours
Commentaires de l'employé
Great customer. Happy to work with him again.
Commentaires du client
Best developer. Understand logic , provides deliverable in time. very Competitive price.Can code complicated EA and provides support post closing job.. Best of Best Very highly recommended

Spécifications

Price Reversal Candle Indicator: 


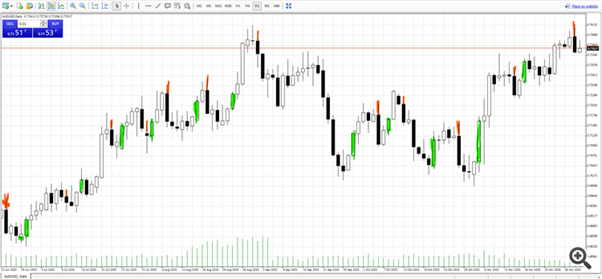
When a first buy price action candle formed after Sell price action candle then buy price action candle is called BUY Price reversal Candle. 

When a first Sell Price action candle is formed after buy price action candle then sell price action candle is called SELL price reversal Candle. 


Take this from previous Job: 

Buy Price action Candle : Candle which is closed above previous candle high 

Sell Price Action candle :  Candle which is closed below previous candle low


Parameter : 

Number of candle to draw: Default 500

Time Frame: Drop down of all time frame 


BUY Price reversal Candle-->candle is marked with green arrow below low of candle

SELL price reversal Candle--> candle is marked with Red arrow above high of candle


All Green color are BUY price reversal candle  ,All RED color are SELL reversal Candle. 


Price Reversal Zig Zag:


Following condition has to check when only a new  Price Reversal Candle is formed. NOT FOR ALL CANDLES.


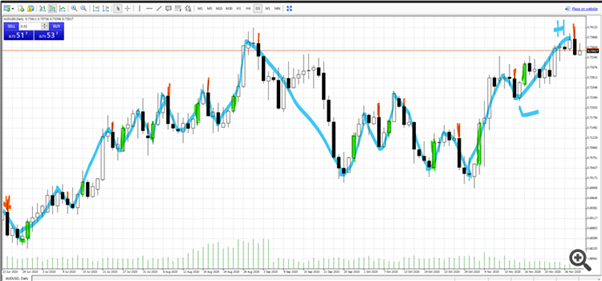
When a Buy Price Reversal Candle is formed ,prior four candle (four is default) close  is considered and lowest price point is marked as ZigZag low 

When a Sell Price Reversal Candle is formed ,prior four candle (four is default) close  is considered and highest price point is marked as ZigZag high


Parameter:


Number of prior candle to mark high /Low : 4 (default)

Time Frame: Drop down of all time frame 


Trend Analyzer : (use Price Reversal Zig Zag as baseline code)


Parameter:

Price marking-->Close or low/high (give me in Drop down option)

Number of prior candle to mark high /Low: 4 (default)

Time Frame: Drop down of all-time frame 


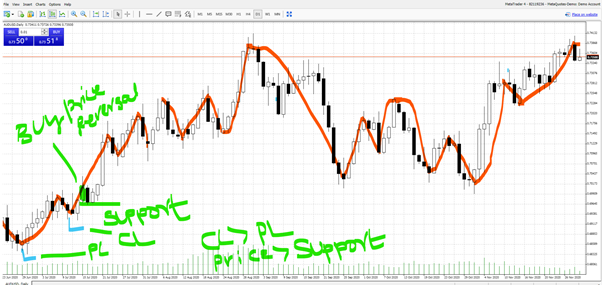
When a buy price action candle is formed, Low of buy price action candle is marked as Support Line.

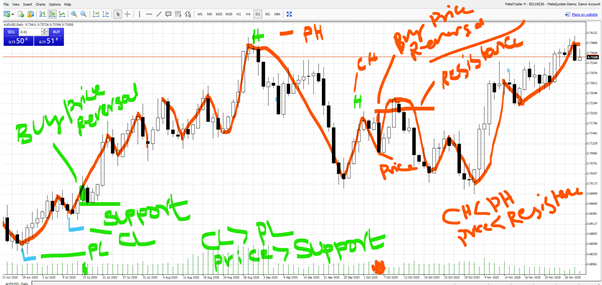
When a Sell price action candle is formed, high of sell price action candle is marked as Resistance Line.

Support and Resistance line need to be drawn on chart and will get redrawn whenever price action candles are formed as per above rules 

Rule: 

Buy Trend:


When Current Low is greater than previous low 

AND

Current Price is higher than support line


Sell Trend: 

When Current high is lesser  than previous high 

AND

Current Price is lower than resistance line


Simple Trend analyses (use base Price Reversal Zig Zag)


Parameter:

Time frame:

Price type: Last candle close /Current price.

and all parameter from Price Reversal Zig Zag


When a buy price action candle is formed, Low of buy price action candle is marked as Support Line.

When a Sell price action candle is formed, high of sell price action candle is marked as Resistance Line.

Support and Resistance line need to be drawn on chart and will get redrawn whenever price action candles are formed as per above rules 


When (current price/Last closed candle price) is above current high and Price is above support line , then it  buy trend

When (current price/Last closed candle price) is below current low and Price is below resistance line , then it  Sell trend

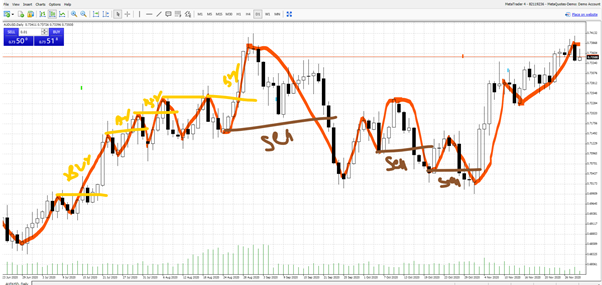
Draw line for high /low as in chart


Trade Volume: 


When a buy price action  candle is formed then Buy volume should be given. 

When a Sell price action candle  is formed then Sell volume should be given. 


Sell Risk : High of Sell Price action candle+ (N*ATR)

Buy Risk : Low of Sell Price action candle- (N*ATR)

N can be less than one. 


Current account available balance *risk percentage = $ to be trade in each trade


$ derived above step should be maximum loss. Volume need to be derived based on that .. 


based on Risk above ,Volume should calculated to have maximum loss of $. 

It is not that I am trading fixed dollar.. volume is chosen as such my maximum loss is $ calculated ( Current account available balance *risk percentage)


How much volume to have my maximum loss as Current account available balance *risk_percentage ?


Répondu

1
Développeur 1
Évaluation
(23)
Projets
45
20%
Arbitrage
25
28% / 48%
En retard
12
27%
Gratuit
2
Développeur 2
Évaluation
(50)
Projets
54
43%
Arbitrage
3
0% / 100%
En retard
3
6%
Gratuit
3
Développeur 3
Évaluation
(26)
Projets
34
26%
Arbitrage
7
14% / 43%
En retard
7
21%
Gratuit
4
Développeur 4
Évaluation
(182)
Projets
290
64%
Arbitrage
4
75% / 0%
En retard
65
22%
Travail
Commandes similaires
I need a trading system similar to the attached files. Check attachment for details on the indicator. i guess the indicator contains some of (Rainbow MA , MTF Dashboard , Symbol Switcher , and Trend Histogram), though may not be exactly as listed
I have a EA/Bot I’ve designed and want it to be put onto me MetaTrader5 this month. I’m new here and also need to figure out how to get a live account and add a UK broker
Hi. I am looking for an experienced MQL5 developer for an advanced XAUUSD MT5 indicator. Before choosing a developer, I would like to see a small proof-of-concept or an example of a similar indicator you have already developed. My final indicator must be written from scratch in MQL5 and I must receive the complete .mq5 source code + compiled .ex5 . Main requirements: XAUUSD MT5 / MQL5 Indicator only — NO AutoTrading
Title: Advanced XAUUSD MT5 Indicator – MQL5 Source Code Required I need a professional MT5 indicator written from scratch in MQL5 (.mq5) for XAUUSD. The indicator must be signals/analysis only — AutoTrading must remain OFF . I need the complete editable .mq5 source code, not only an .ex5 file. The system should analyze multiple timeframes: H4 → H1 → M30 → M15 → M5 → M1 . Required logic: Higher-timeframe
i have indicator for Trading View, also copy for NT, i need someone to improve and check the NT version (indicator is simple is volume density koncept)…. when i put same settings on TV version and NT version i have diffrerent results, but this can be because diffrent market data or fact that TV sending tick info in blocks , not tick by tick like NT8 on both. I(ndicator base on counting volume) so besied that is it
Please may someone assist me with the indicator attached, it has a SERIOUS BUG issue in the sense that when I load it, and activate the template (attached as well) MT4 ALWAYS freezes and then eventually disconnects automatically, ALL THE TIME. It even gets worse to an extent that after disconnecting a number of times mt4 ends up not loading anymore, UNTIL I remove the indicator. Please I WILL NEED A DEMO (FOR A DAY)
‎A trending candle followed by a smaller trending candle which is the second candle with no 5EMA ‎ ‎The 3rd candle is a reversal candle in which it and it's immidiate previous candle must be at least 70% of each other's body or equal body, with no 5EMA touch ‎ ‎the 3rd candle candle is followed immediately by the 4th candle which is the signal candle in which it and the 1st cabdle must be also at least 70% of
LynxMT5algo 30 - 100 USD
An mt5 add on indicator like gainalgo style to show entrance and exit areas for gold silver and Btc scalping. It will be used to make trading more easy for beginners
I have the Fisher Indicator shown below the chart. I need an alert added for when the Fisher Indicator hits the 50 point at the end of each period. GBPUSD and EURUSD 4H charts are provided and I can provide additional
Hello here, I need someone who can work on pinescript and also with Renko charts. My entries for my strategy would be based on stop orders Kindly let me know if you can work on this for me and i will send necessary file and quote in the chat

Informations sur le projet

Budget
30 - 40 USD