New indicator and rule modification

MQL4 지표 EA

작업 종료됨

실행 시간 32 일
피고용인의 피드백
Great customer. Happy to work with him again.
고객의 피드백
Best developer. Understand logic , provides deliverable in time. very Competitive price.Can code complicated EA and provides support post closing job.. Best of Best Very highly recommended

명시

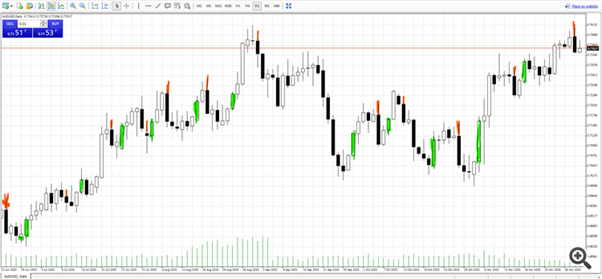
Price Reversal Candle Indicator: 


When a first buy price action candle formed after Sell price action candle then buy price action candle is called BUY Price reversal Candle. 

When a first Sell Price action candle is formed after buy price action candle then sell price action candle is called SELL price reversal Candle. 


Take this from previous Job: 

Buy Price action Candle : Candle which is closed above previous candle high 

Sell Price Action candle :  Candle which is closed below previous candle low


Parameter : 

Number of candle to draw: Default 500

Time Frame: Drop down of all time frame 


BUY Price reversal Candle-->candle is marked with green arrow below low of candle

SELL price reversal Candle--> candle is marked with Red arrow above high of candle


All Green color are BUY price reversal candle  ,All RED color are SELL reversal Candle. 


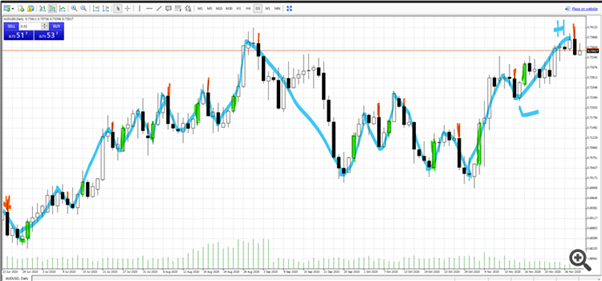
Price Reversal Zig Zag:


Following condition has to check when only a new  Price Reversal Candle is formed. NOT FOR ALL CANDLES.


When a Buy Price Reversal Candle is formed ,prior four candle (four is default) close  is considered and lowest price point is marked as ZigZag low 

When a Sell Price Reversal Candle is formed ,prior four candle (four is default) close  is considered and highest price point is marked as ZigZag high


Parameter:


Number of prior candle to mark high /Low : 4 (default)

Time Frame: Drop down of all time frame 


Trend Analyzer : (use Price Reversal Zig Zag as baseline code)


Parameter:

Price marking-->Close or low/high (give me in Drop down option)

Number of prior candle to mark high /Low: 4 (default)

Time Frame: Drop down of all-time frame 


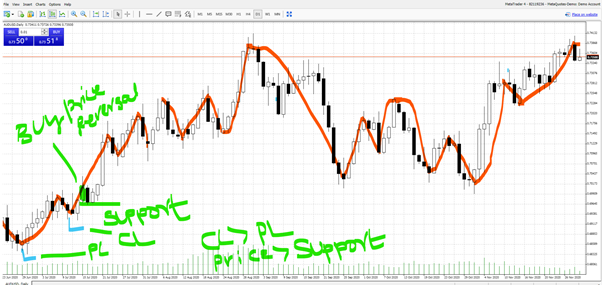
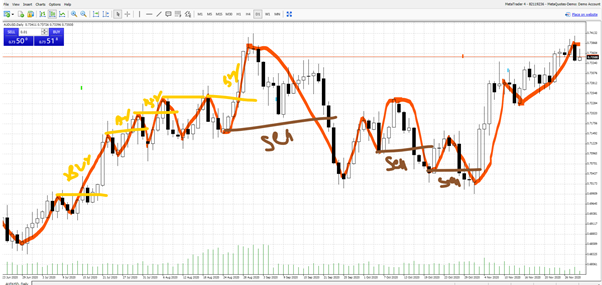
When a buy price action candle is formed, Low of buy price action candle is marked as Support Line.

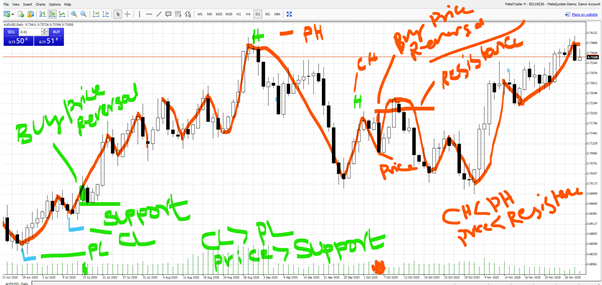
When a Sell price action candle is formed, high of sell price action candle is marked as Resistance Line.

Support and Resistance line need to be drawn on chart and will get redrawn whenever price action candles are formed as per above rules 

Rule: 

Buy Trend:


When Current Low is greater than previous low 

AND

Current Price is higher than support line


Sell Trend: 

When Current high is lesser  than previous high 

AND

Current Price is lower than resistance line


Simple Trend analyses (use base Price Reversal Zig Zag)


Parameter:

Time frame:

Price type: Last candle close /Current price.

and all parameter from Price Reversal Zig Zag


When a buy price action candle is formed, Low of buy price action candle is marked as Support Line.

When a Sell price action candle is formed, high of sell price action candle is marked as Resistance Line.

Support and Resistance line need to be drawn on chart and will get redrawn whenever price action candles are formed as per above rules 


When (current price/Last closed candle price) is above current high and Price is above support line , then it  buy trend

When (current price/Last closed candle price) is below current low and Price is below resistance line , then it  Sell trend

Draw line for high /low as in chart


Trade Volume: 


When a buy price action  candle is formed then Buy volume should be given. 

When a Sell price action candle  is formed then Sell volume should be given. 


Sell Risk : High of Sell Price action candle+ (N*ATR)

Buy Risk : Low of Sell Price action candle- (N*ATR)

N can be less than one. 


Current account available balance *risk percentage = $ to be trade in each trade


$ derived above step should be maximum loss. Volume need to be derived based on that .. 


based on Risk above ,Volume should calculated to have maximum loss of $. 

It is not that I am trading fixed dollar.. volume is chosen as such my maximum loss is $ calculated ( Current account available balance *risk percentage)


How much volume to have my maximum loss as Current account available balance *risk_percentage ?


응답함

1
개발자 1
등급
(23)
프로젝트
45
20%
중재
25
28% / 48%
기한 초과
12
27%
무료
2
개발자 2
등급
(50)
프로젝트
54
43%
중재
3
0% / 100%
기한 초과
3
6%
무료
3
개발자 3
등급
(26)
프로젝트
34
26%
중재
7
14% / 43%
기한 초과
7
21%
무료
4
개발자 4
등급
(182)
프로젝트
289
64%
중재
3
100% / 0%
기한 초과
65
22%
작업중
비슷한 주문
Code An Loss Rate 90-100% MT5 EA , that can blow a 100 USD account a day ,with fixed TP of 3000 points and SL of 3000 For better Rate Calculations get an strategy that can lead to so
Shooter razor 30+ USD
Makes it takes trades by it self buy and sell, it must use the higher signals, also when I press stop it must not pick any trades I want it to take trades automatically when I press start also close by it self
Hello looking for someone to convert an indicator from tradingview to Thinkorswim I have attached the codes from trading view Also, I like make it trigger (alert) a one-time alert when the trend changes, and can also create a custom watchlist column that flags symbols currently in a new trend so you can scan multiple stocks easily. And like the watchlist to show only fresh trend changes or the current trend direction
Version document : 1.0 Plateforme : TradingView Langage : Pine Script v6 Type : Indicateur d'analyse et d'aide à la décision (non-exécutant) 1. Présentation du projet Nom du produit ONYX SR V2 — Intelligent Support & Resistance Scalping System Objectif Créer un indicateur TradingView capable d'identifier automatiquement des opportunités de scalping basées sur : supports et résistances dynamiques ; action du prix ;
I have a EA/indicator that I want built. I should say 1st off dont know how to code myself so I will be using AI to verify that the source code is complete and matches the documents spec or if better so if you can not truly do the job do not waste either of out time. This is a idea I came.up wit and used AI to produce a framework for it.... and of course AI isn't 100% accurate so I need a knowledgeable quantitative
TumiiFX 30 - 20000 USD
1. Use two EMAs: 20 and 50. If EMA 20 is above EMA 50 → uptrend (look for buys) If EMA 20 is below EMA 50 → downtrend (look for sells) 2. Wait for a pullback into the area between the two EMAs. - For buys: price must touch or move between EMA 20 and EMA 50 during the last few candles. - For stils: same idea, but in a downtrend. 3. Entry signal: Buy: a bullish engulfing candle in an uptrend after the pullback
I am looking for an experienced MQL4 developer to build a professional High-Frequency Trading (HFT) / Low-Latency Expert Advisor for MetaTrader 4 (MT4) . The EA will be deployed on an IC Markets Live account and should be optimized for the fastest possible execution using a low-latency VPS located in LD4 or NY4 . The primary instruments will be US30 and XAUUSD (Gold) . The goal is to create an EA capable of
A robot 50+ USD
HIGH-FREQUENCY M5/M15 CONCURRENT ENTRY SNIPER import time class HighFrequencySniper: def __init__(self): self.target_profit = 25.00 # Targeted Delta Move self.max_execution_time = 3600 # 1 Hour Sandbox (Seconds) self.lot_allocation = "CALIBRATED_TO_RISK" def execute_hft_scan(self, current_price, m5_rsi, m15_order_block): print(f"[SCANNING] Current Kernel Metric: ${current_price:.2f
I need a trading bot, please i need this project urgently and when messaing me kindly send me samples of past works and dont forget i need the project to be done as soon as possible
A lightweight MT5 chart overlay displaying total floating P&L, average entry price, combined lot size, and current symbol exposure as a percentage of account balance, all updating in real time with color-coded profit/loss indicators, delivered with clean object-oriented source code and no DLL dependencies

프로젝트 정보

예산
30 - 40 USD