|
9+ 년도
경험
|
128
제품
|
55
데모 버전
|
|
0
작업
|
0
거래 신호
|
0
구독자
|
안녕하세요!
저는 오랜 개발 경력을 가진 소프트웨어 엔지니어로서, 자신만의 고유한 트레이딩 시스템과 풍부한 EA 거래 경험을 가지고 있습니다. 주요 거래 통화쌍은 EUR/USD, GBP/USD, USD/JPY, AUD/USD, USD/CAD, 골드 및 EUR/NZD 크로스 통화입니다.
저희의 목표는 접근 가능하고 양질의 서비스를 제공하여, 시장 참여자, 트레이더, 분석가 모두가 정보에 입각한 시기적절한 거래 결정을 내릴 수 있도록 꼭 필요한 도구를 지원하는 것입니다.
우리는 이제 과거의 가격 차트 대신 각 통화의 미래에 게임 이론 전략을 적용합니다. 이것은 한 차원 더 높은 수준입니다. 동적 시장 게임 이론은 다른 어떤 통화 미터에서도 찾아볼 수 없는 Advanced Currency Health Bars 지표의 특별한 기능입니다! 이것은 매우 독창적인 기능입니다. 동적 시장 게임 이론 전략 헬스 바는 전체 시장 활동(35개 통화쌍 전체)을 기반으로 합니다.
이 EA는 저의 수학적 알고리즘을 통해 미래의 손실률을 교정할 수 있습니다.
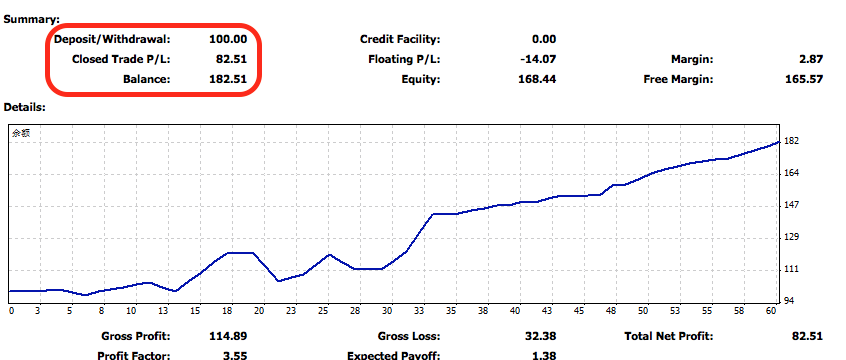
EA는 트렌드를 식별하기 위해 실행되며, 스트레이트 또는 크로스 통화로 구성된 상위 8개 통화를 주요 거래 대상으로 삼고, 하루에 10회 이상 거래하며, 최대 낙폭(드로다운)은 20%, 마틴게일 알고리즘을 사용하여 월 10%~20%의 수익을 올립니다. 어떤 브로커를 통해서도 팔로우할 수 있으며, 슬리피지를 줄이기 위해 ECN 계좌를 사용하는 것을 권장합니다. 거래를 거듭할수록 이 트레이딩 시스템과 사랑에 빠지게 될 것이라고 믿습니다. 감사합니다!
DYJ 트레이딩 제품은 자체 요구 사항은 물론 기업 고객의 목표 달성을 위해 트레이딩 분야의 혁신적인 멀티 통화 소프트웨어 개발을 전문으로 합니다. DYJ 타이틀의 트레이딩 제품은 멀티 통화 기반의 모든 타임프레임 거래를 설계하도록 만들어졌으며, M1부터 MN까지 모든 구간을 모니터링하여 어떤 진입 기회도 놓치지 않습니다. 트레이더가 돈을 벌 수 있는 기회를 놓치지 않도록 전략이 이러한 포지션 청산 신호의 등장을 자동으로 감지하며, 매 순간 여러분의 수익을 보호하고 손실을 최소화합니다.
더 많은 정보는 다음 링크에서 확인하실 수 있습니다: https://www.mql5.com/en/users/cdymql4/seller
사용자 여러분, 당사의 모든 유료 제품은 구매 및 대여가 가능합니다.
DYJ Hedging ODE Beta EA: https://www.mql5.com/zh/market/product/192446?source=Site+Market+My+Products+Page
DYJ Ode Spectra EA: https://www.mql5.com/zh/market/product/185841?source=Site+Market+My+Products+Page
DYJ BetaLogicDynamicsEA: https://www.mql5.com/zh/market/product/184829?source=Site+Market+My+Products+Page
StrongCurrency MT4: https://www.mql5.com/en/market/product/23311 또는 https://www.mql5.com/zh/market/product/23311
StrongCurrency MT5: https://www.mql5.com/en/market/product/24025 또는 https://www.mql5.com/zh/market/product/24025
PowerSignal MT4: https://www.mql5.com/en/market/product/24448#description 또는 https://www.mql5.com/en/market/product/24448#description
PowerSignal MT5: https://www.mql5.com/en/market/product/24915 또는 https://www.mql5.com/zh/market/product/24915
SoarSignal MT4: https://www.mql5.com/en/market/product/22459#description 또는 https://www.mql5.com/en/market/product/22459#description
SoarSignal MT5: https://www.mql5.com/en/market/product/24638 또는 https://www.mql5.com/zh/market/product/24638
DYJ TwoMACrossAlarm MT4: https://www.mql5.com/en/market/product/25213 또는 DYJ TwoMACrossAlarm
QuickClose MT4: https://www.mql5.com/en/market/product/22425#description 또는 https://www.mql5.com/zh/market/product/22425#description
DYJ RiseTrading MT4: https://www.mql5.com/en/market/product/25237
저는 오랜 개발 경력을 가진 소프트웨어 엔지니어로서, 자신만의 고유한 트레이딩 시스템과 풍부한 EA 거래 경험을 가지고 있습니다. 주요 거래 통화쌍은 EUR/USD, GBP/USD, USD/JPY, AUD/USD, USD/CAD, 골드 및 EUR/NZD 크로스 통화입니다.
저희의 목표는 접근 가능하고 양질의 서비스를 제공하여, 시장 참여자, 트레이더, 분석가 모두가 정보에 입각한 시기적절한 거래 결정을 내릴 수 있도록 꼭 필요한 도구를 지원하는 것입니다.
우리는 이제 과거의 가격 차트 대신 각 통화의 미래에 게임 이론 전략을 적용합니다. 이것은 한 차원 더 높은 수준입니다. 동적 시장 게임 이론은 다른 어떤 통화 미터에서도 찾아볼 수 없는 Advanced Currency Health Bars 지표의 특별한 기능입니다! 이것은 매우 독창적인 기능입니다. 동적 시장 게임 이론 전략 헬스 바는 전체 시장 활동(35개 통화쌍 전체)을 기반으로 합니다.
이 EA는 저의 수학적 알고리즘을 통해 미래의 손실률을 교정할 수 있습니다.
EA는 트렌드를 식별하기 위해 실행되며, 스트레이트 또는 크로스 통화로 구성된 상위 8개 통화를 주요 거래 대상으로 삼고, 하루에 10회 이상 거래하며, 최대 낙폭(드로다운)은 20%, 마틴게일 알고리즘을 사용하여 월 10%~20%의 수익을 올립니다. 어떤 브로커를 통해서도 팔로우할 수 있으며, 슬리피지를 줄이기 위해 ECN 계좌를 사용하는 것을 권장합니다. 거래를 거듭할수록 이 트레이딩 시스템과 사랑에 빠지게 될 것이라고 믿습니다. 감사합니다!
DYJ 트레이딩 제품은 자체 요구 사항은 물론 기업 고객의 목표 달성을 위해 트레이딩 분야의 혁신적인 멀티 통화 소프트웨어 개발을 전문으로 합니다. DYJ 타이틀의 트레이딩 제품은 멀티 통화 기반의 모든 타임프레임 거래를 설계하도록 만들어졌으며, M1부터 MN까지 모든 구간을 모니터링하여 어떤 진입 기회도 놓치지 않습니다. 트레이더가 돈을 벌 수 있는 기회를 놓치지 않도록 전략이 이러한 포지션 청산 신호의 등장을 자동으로 감지하며, 매 순간 여러분의 수익을 보호하고 손실을 최소화합니다.
더 많은 정보는 다음 링크에서 확인하실 수 있습니다: https://www.mql5.com/en/users/cdymql4/seller
사용자 여러분, 당사의 모든 유료 제품은 구매 및 대여가 가능합니다.
DYJ Hedging ODE Beta EA: https://www.mql5.com/zh/market/product/192446?source=Site+Market+My+Products+Page
DYJ Ode Spectra EA: https://www.mql5.com/zh/market/product/185841?source=Site+Market+My+Products+Page
DYJ BetaLogicDynamicsEA: https://www.mql5.com/zh/market/product/184829?source=Site+Market+My+Products+Page
StrongCurrency MT4: https://www.mql5.com/en/market/product/23311 또는 https://www.mql5.com/zh/market/product/23311
StrongCurrency MT5: https://www.mql5.com/en/market/product/24025 또는 https://www.mql5.com/zh/market/product/24025
PowerSignal MT4: https://www.mql5.com/en/market/product/24448#description 또는 https://www.mql5.com/en/market/product/24448#description
PowerSignal MT5: https://www.mql5.com/en/market/product/24915 또는 https://www.mql5.com/zh/market/product/24915
SoarSignal MT4: https://www.mql5.com/en/market/product/22459#description 또는 https://www.mql5.com/en/market/product/22459#description
SoarSignal MT5: https://www.mql5.com/en/market/product/24638 또는 https://www.mql5.com/zh/market/product/24638
DYJ TwoMACrossAlarm MT4: https://www.mql5.com/en/market/product/25213 또는 DYJ TwoMACrossAlarm
QuickClose MT4: https://www.mql5.com/en/market/product/22425#description 또는 https://www.mql5.com/zh/market/product/22425#description
DYJ RiseTrading MT4: https://www.mql5.com/en/market/product/25237