Wave impulse omega scalper
- 지표
- 버전: 1.20
- 업데이트됨: 22 9월 2022
- 활성화: 5

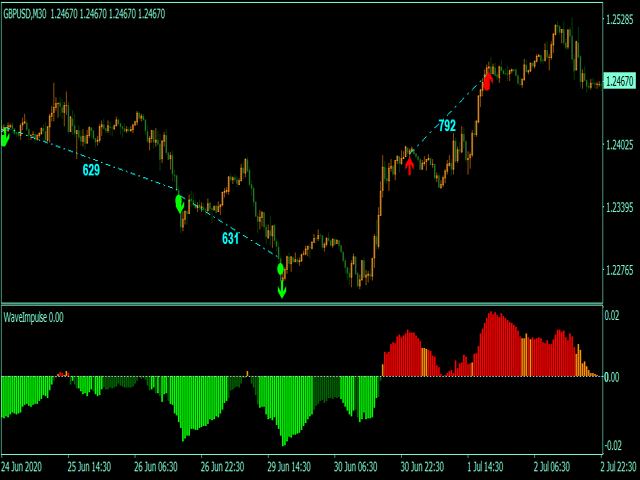
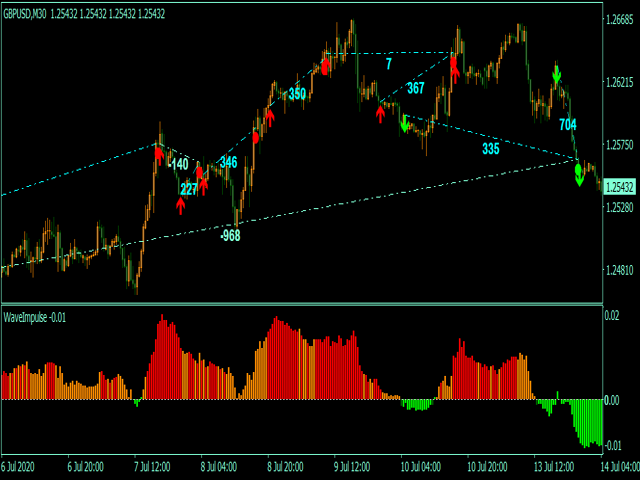
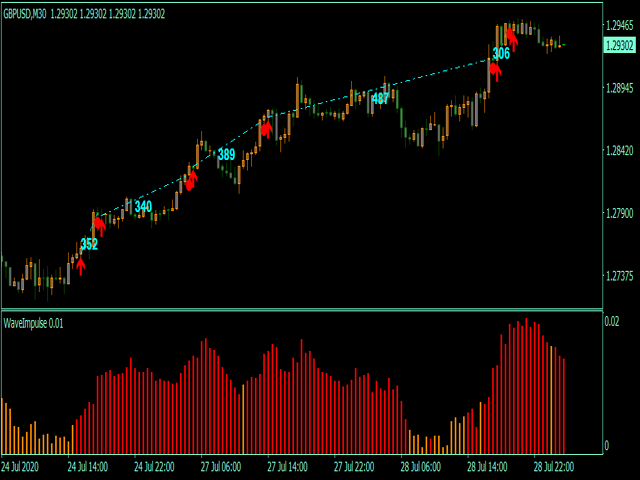
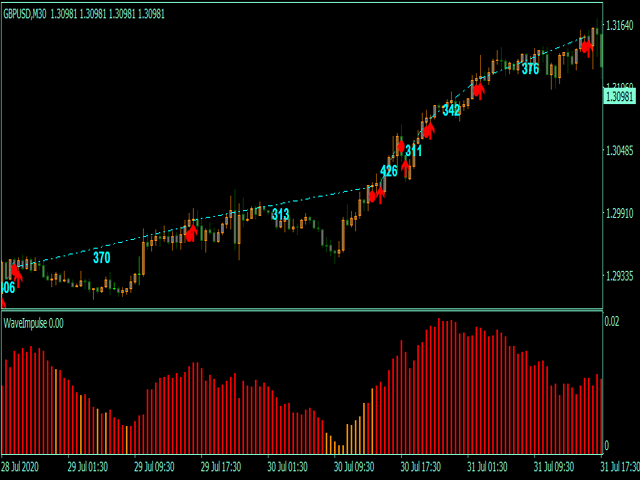
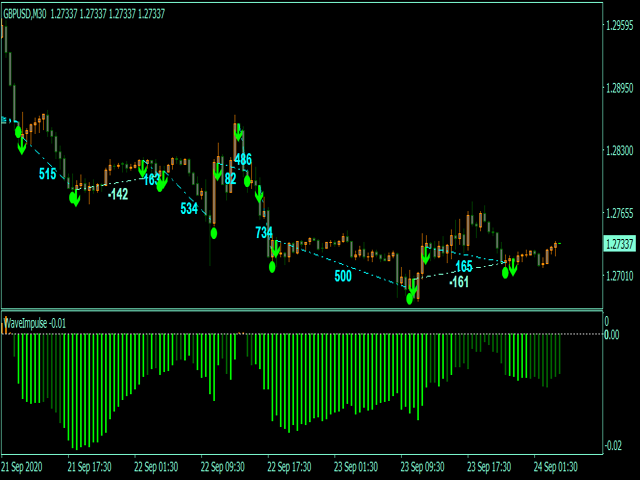
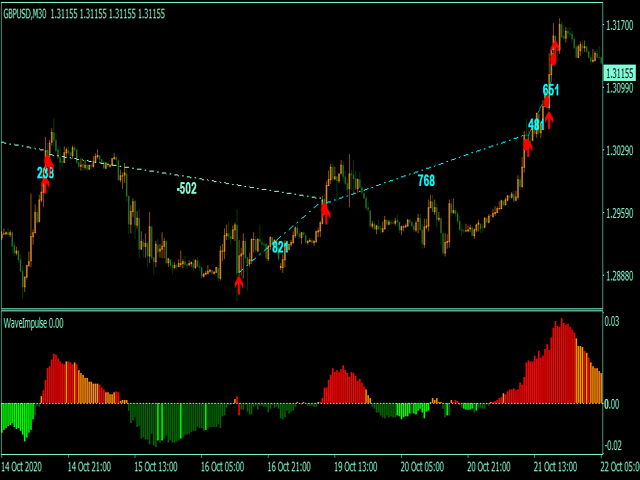
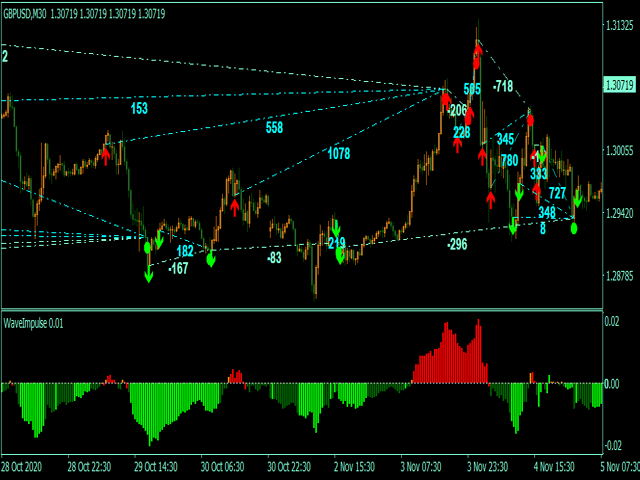
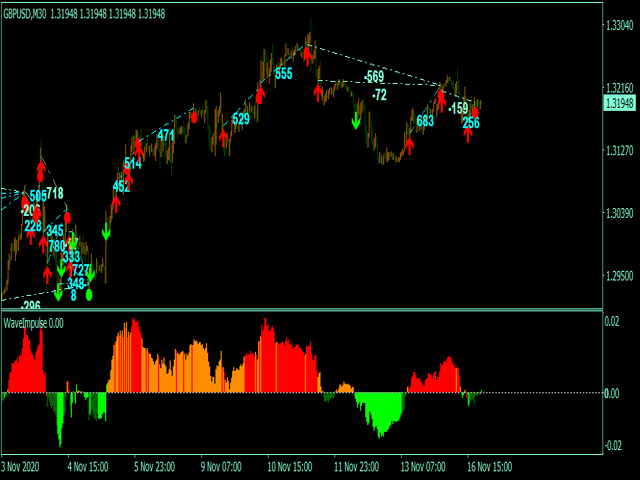
Wave Impulse OmegaScalper - is the manual system for scalping. In many cases Indicator "eats" almost all possible trend wave. System defines up price wave and down price wave. Inside the exact wave - system defines true trend movement and choppy market. Indicator plots signals while market is trending, powerfull and has quiet good volatility. This is complete system with enter and exit points.
Main Indicator's Features
- Signals are not repaint,non-late or disappear(exept cases when system recalculates all history datas,refreshing main settings or Metatrader refreshes new incomming datas);
- Every signal comes at the open of new bar(system uses only confirmed signals);
- Indicator has Alerts, Mail and Push notifications(allow to trade out of PC, from smartphone/mobile app);
- System is 100% autoadaptive no need manual adjusting. Just set up and start trading.
- Possible to disable arrow strategy and use only histogram.
Recommendations for trading
- Timeframes in range 5MIN-H4 ;
- First of all recommend Gold and Crypto Market, EURUSD,GBPUSD,AUDUSD,USDJPY,EURJPY,NZDUSD;