Trend Driver Bars Indicator
- 지표
- 버전: 1.30
- 업데이트됨: 22 9월 2022
- 활성화: 5

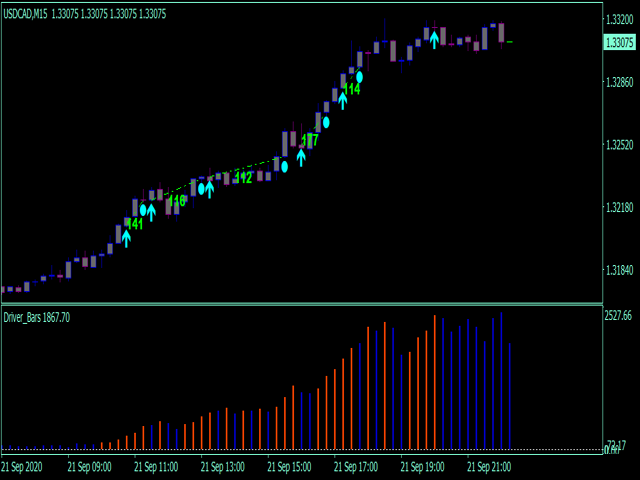
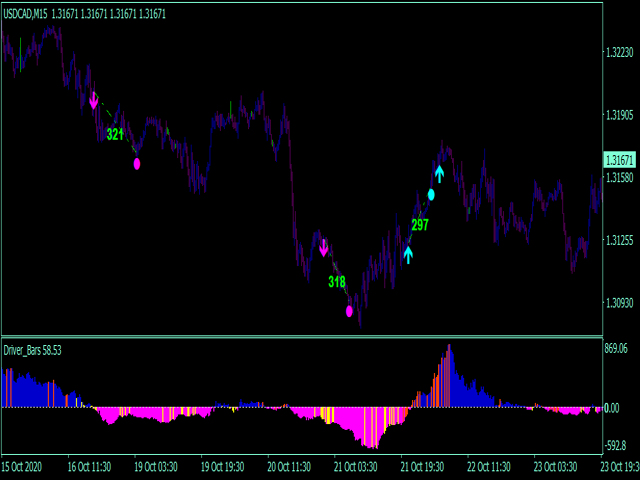
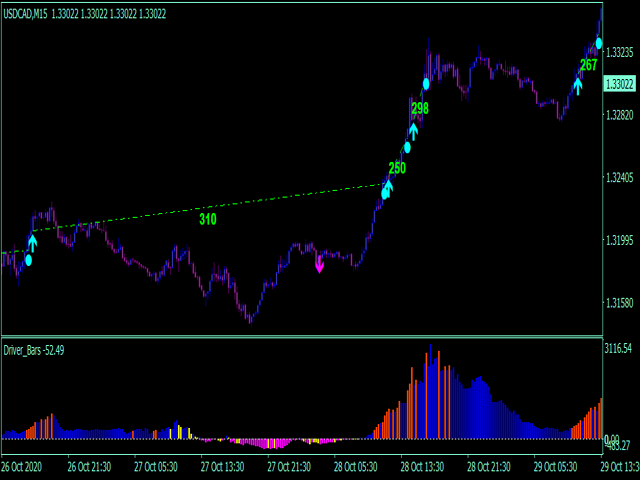
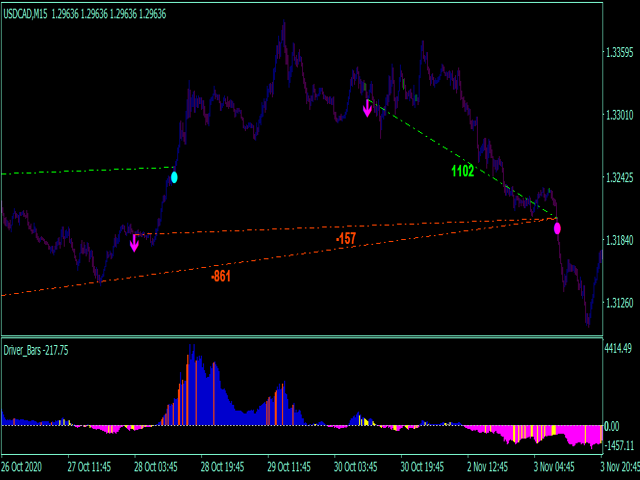
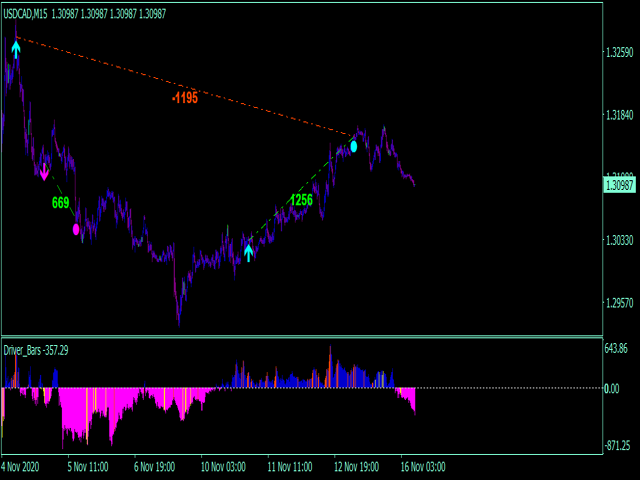
Trend driver bars is the manual trading system, which defines current trend continue or it's pull-back/reverse. "Driver" bars - are price action patterns that has powerfull affect on market, defining it's near future direction. Generally, driver bars represents trend "skeleton" and often anticipates new market impulse. System plots arrows when market shows 3 pattenrs in a row(most powerfull combo-pattern), and makes fast scalping of incomming movement. Loss positions closes by common profit. Lot increase never uses. System hedges positions to minimize risks.
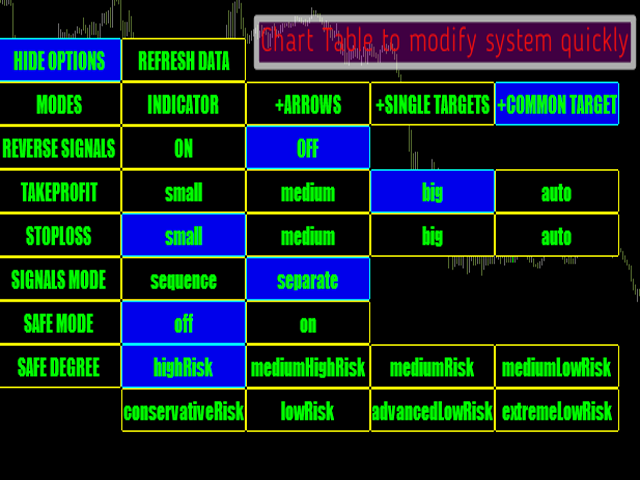
Main Indicator's Features
- Signals are not repaint,non-late or disappear(exept cases when system recalculates all history datas,refreshing main settings or Metatrader refreshes new incomming datas);
- Every signal comes at the open of new bar(system uses only confirmed signals);
- Indicator has Alerts, Mail and Push notifications(allow to trade out of PC, from smartphone/mobile app);
- System is 100% autoadaptive no need manual adjusting. Just set up and start trading.
- Possible to disable arrow strategy and use only histogram.
Recommendations for trading
- Scalping timefrsmes: M5-H1 range;
- Volatility pairs like EURGBP, GBPJPY, USDJPY, GOLD, Crypto;