Candle Good Setup MT4
- 지표
- 버전: 1.0
- 활성화: 5

You ask yourself the question every time you open your charts: how to win in trading? Will using a lot of indicators work? well know that I also asked myself the same questions when I first started trading. After testing many indicators, I realized that winning trading is simple and accurate trading. after several months of thinking and optimizing I was able to find my solution: Candle Good Setup
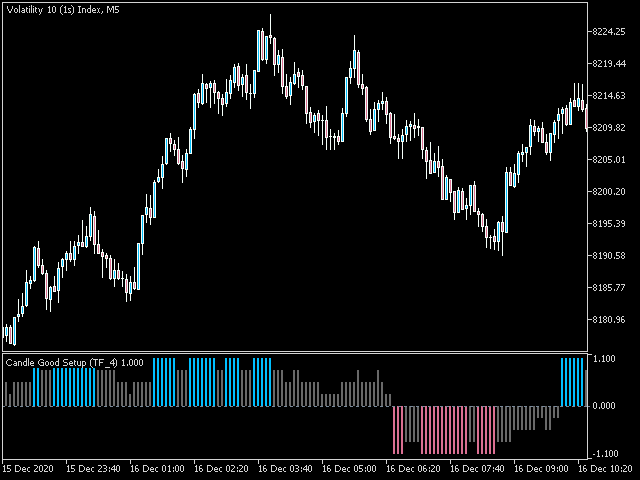
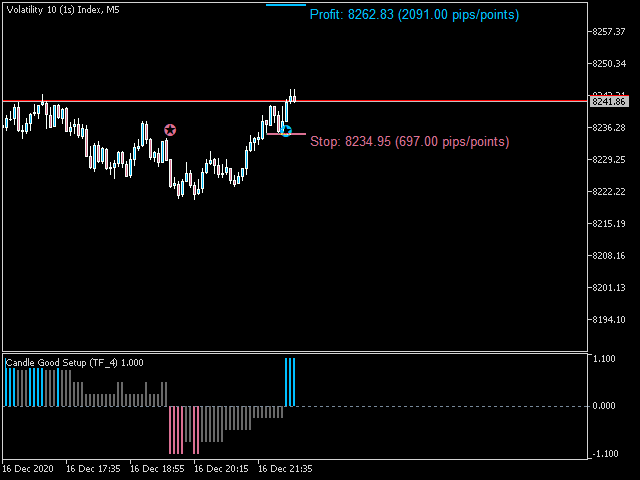
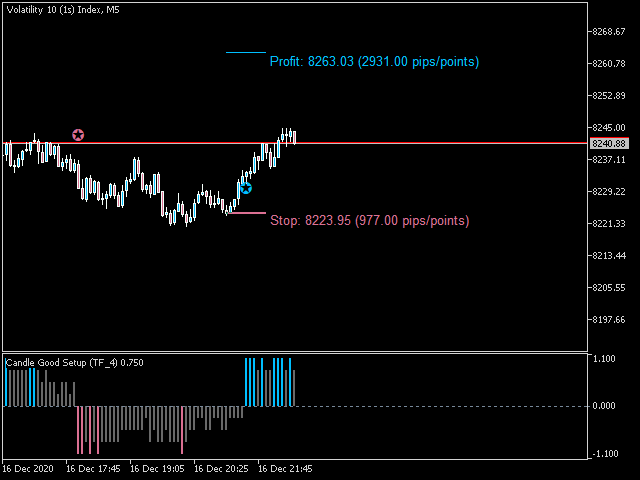
Candle Good setup is a trend and entry timing indicator analyzing the market in multi-frame to give the right timing to enter and exit the market.
Advantages You Get
-
Easy, visual and effective trend detection.
-
Gives you the ability to filter and further improve your trading strategies.
-
shows your stop loss and take profit according to your settings
-
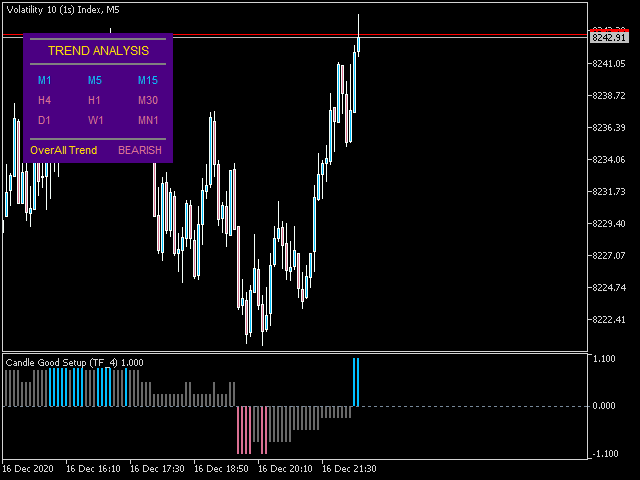
Dashboard for Check trend in keys timeframes ( M1-M5-M15-M30-H1-H4-D1-W1-MN )
-
Never repaints, never back paints, never recalculates.
-
Signals strictly on the "Close of the bar".
-
Works in all symbols and all timeframes.
-
Integrated pop-up, email, push notification and sound alerts.
-
Fully compatible with Expert Advisor (EA) development.
How To Trade
We can imagine several trading strategies with this wonderful indicator. I will introduce you in the following lines how I use it personally
No complicated rules, Just follow 4 simple steps!
Step 1: Trade Setup
-
Note the trend indicated by the indicator
Step 2: Enter Setup
-
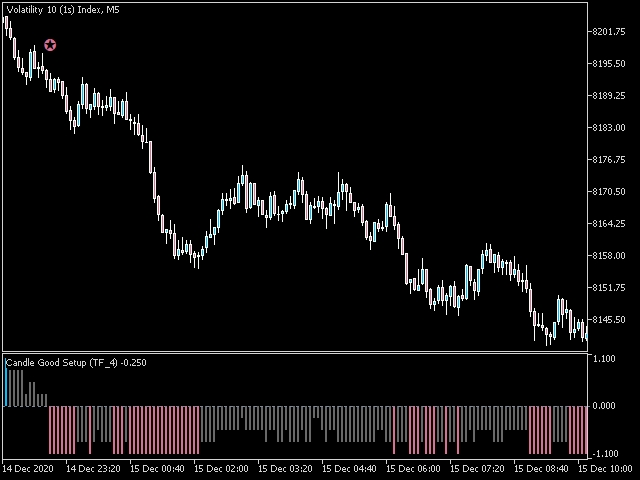
Enter sell if in a downtrend and the indicator turns from neutral to the sell signal
-
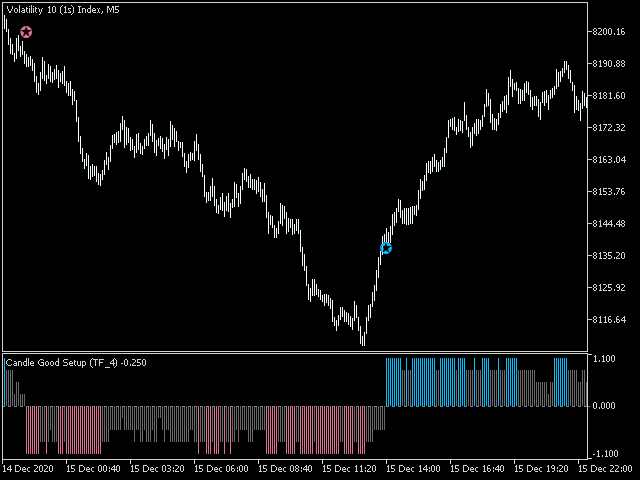
Enter Buy if in an uptrend and the indicator changes from neutral to the buy signal
Step 3: Set Stop Loss and take profit
-
set the stop loss and take profit at the level indicated according to your parameters
-
you can define partial take profit to properly manage your position
Step 4: Early exit
-
Immediately exit the trade if the trend changes
Candle Good setup options and settings
Main settings
-
Candle Mode : choose the type of candlestick use analysis (Japanese candlestick or Heiken Ashi candlestick).
-
Time Frame Analysis : choose the number of timeframes for the analysis (2 - 3 or 4 timeframes).
Display settings
-
Show Arrow -> Set "true" to materialize the trend with a drawing in the main window.
-
Show Dashboard -> Set "true" to display the dashboard (trend scanner) in the main window.
-
Show SL and TP-> Set "true" to display the stop loss and take profit level in the main window.
-
Candle period for SL -> number of bars to position the stop loss
-
RiskReward -> Risk Reward ratio for take profit
Colors settings
-
Down color -> Color of drops
-
Up color -> Color of the supers
-
SL line color -> Stop loss line color
-
TP line color -> Take profit line color
Alert and notification settings
-
Popup Alerts -> Set "true" to receive pop-up alerts
-
Email Alerts -> Set "true" to receive a notification e-mail
-
Push Notification Alerts -> Set "true" to receive mobile notifications
-
Sound Alerts -> Set "true" to receive an audible notification
-
SoundFileName -> Choose your favorite alert sound
Graphs limit settings
-
Limit Bars -> maximum of bars for the first calculation