MACD Double
- 지표
-
Dorian Baranes
 I am an analyst and developer specializing in the FX market. I can help you to save your valuable time by creating an automated system out of your trading strategy.
I believe that using a quantitative approach to forecast market is more efficient than using a traditional approach. - 버전: 1.0
- 활성화: 5
This indicator calculates buy and sell signals by using MACD indicator on two timeframes.
MACD is a trend-following showing the relationship between two moving averages of the closing price. The MACD is calculated by subtracting the 26-period Exponential Moving Average (EMA) from the 12-period EMA.The result of that calculation is the MACD line. A nine-day EMA of the MACD called the "signal line".
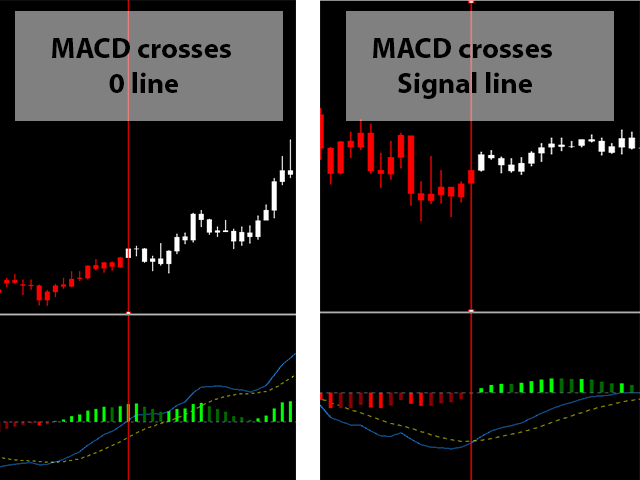
This indicator has 2 modes to calculate the buy/sell signals:
- MACD crosses 0 line
- MACD crosses Signal line
Screenshot shows an example for each mode


사용자가 평가에 대한 코멘트를 남기지 않았습니다