Strongest Level

Description

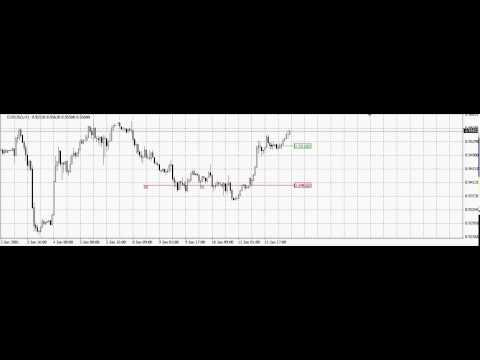
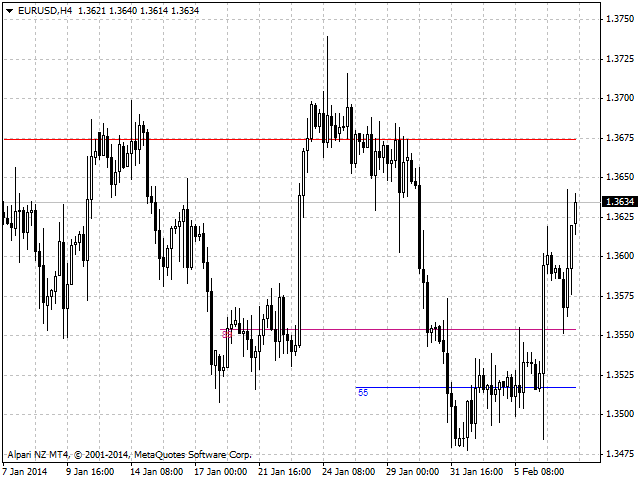
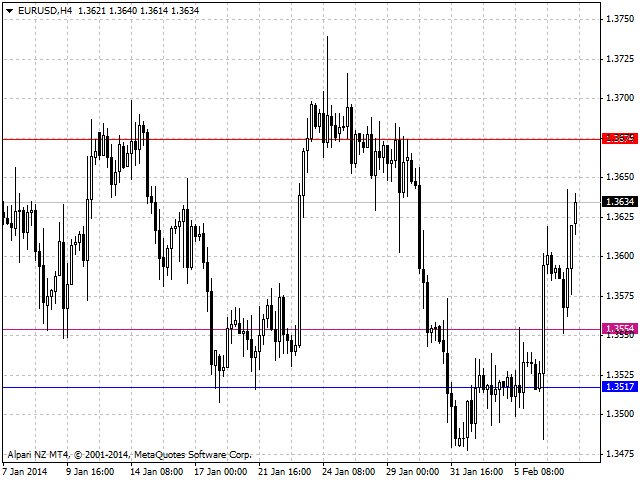
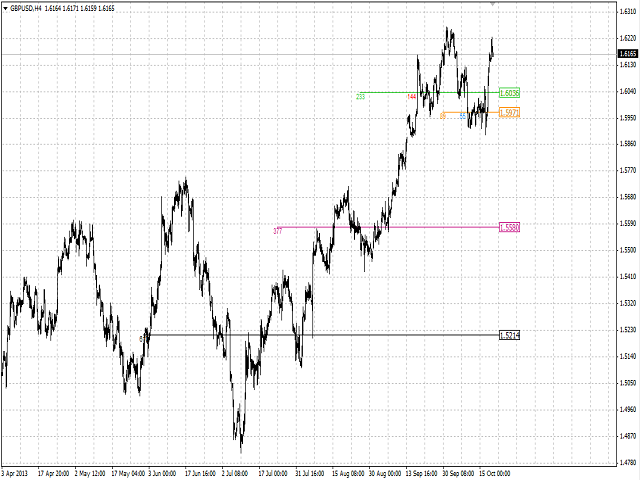
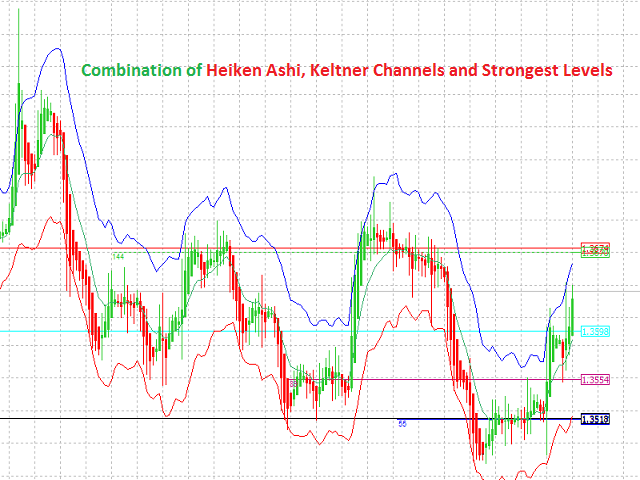
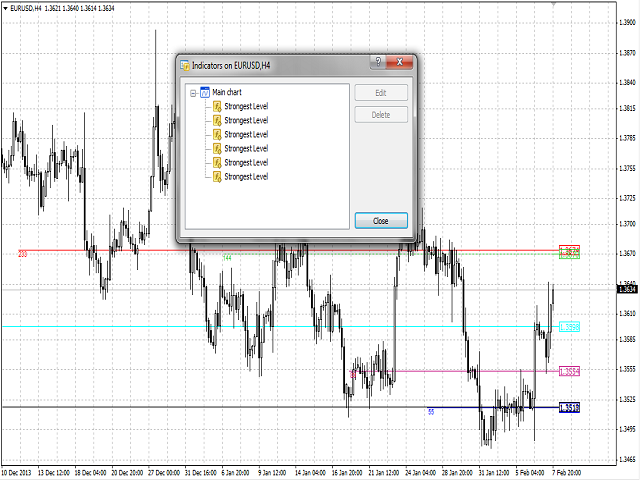
Strongest Level is an indicator that automatically plots the nearest levels of strongest resistance and support in the main chart based on prices of the current timeframe.

Repeated usage of the indicator with various number of bars creates a system of support and resistance!

The indicator calculates and plots levels based on number of bars set by the user. It is recommended to set numbers from a golden ratio according to Fibonacci (13, 21, 34, 55, 89, 144, 233, 377, 610 etc.).

Users can define the colors of the levels.

At the request of the user, the indicator can show the levels with different ways of display and info (see Input Parameters).

Enclosed video demonstrates operation of the indicator based on the example of levels by number of settlement bars 13, 55 and 89.

Purpose

The indicator can be used for manual or automated trading as part of an Expert Advisor. For automated trading, use the indicator buffer of double type:

  1. Level value - buffer 0, must not be equal to zero.

Input Parameters

  1. Bars_Number - number of bars.
  2. Line_Type - type of the line:
    • horizontal line (unlimited).
    • line long by number of bars (limited).
  3. Style - style of the line:
    • solid line (by default).
    • dashed line.
    • dotted line.
    • dashed and dotted line.
    • dashed and double dotted line.
  4. Width - width of the line.
  5. Line_Color - color of the line.
  6. Symbol_Right_Price - flag for setting Symbol_Right_Price.
  7. Screen_Info - flag for information about number of bars.

Recommendations

The product can be successfully used with other indicators, such as Keltner Channel + Heiken Ashi, Price Channel, Impulse Systems, etc.


추천 제품
Auto Fibo Pro m
DMITRII GRIDASOV
"Auto FIBO Pro" Crypto_Forex 지표 - 거래에 유용한 보조 도구입니다! - 지표는 자동으로 Fibo 수준과 로컬 추세선(빨간색)을 계산하여 차트에 배치합니다. - Fibonacci 수준은 가격이 반전될 수 있는 주요 영역을 나타냅니다. - 가장 중요한 수준은 23.6%, 38.2%, 50%, 61.8%입니다. - 역전 스캘핑이나 존 그리드 거래에 사용할 수 있습니다. - Auto FIBO Pro 지표를 사용하여 현재 시스템을 개선할 수 있는 기회도 많습니다. - Info Spread Swap Display가 있습니다. 현재 Spread와 Swap이 부착된 외환 쌍을 표시합니다. - 디스플레이에는 계정 잔액, 자본 및 마진도 표시됩니다. - 차트의 어느 모서리에서나 Info Spread Swap Display를 찾을 수 있습니다. 0 - 왼쪽 상단 모서리, 1 - 오른쪽 상단, 2 - 왼쪽 하단, 3 - 오른쪽 하단. 여기를 클릭하여 고품질 트레이딩 로봇과
VR Cub
Vladimir Pastushak
VR Cub 은 고품질 진입점을 얻는 지표입니다. 이 지표는 수학적 계산을 용이하게 하고 포지션 진입점 검색을 단순화하기 위해 개발되었습니다. 지표가 작성된 거래 전략은 수년 동안 그 효율성을 입증해 왔습니다. 거래 전략의 단순성은 초보 거래자라도 성공적으로 거래할 수 있다는 큰 장점입니다. VR Cub은 포지션 개시 지점과 이익 실현 및 손절매 목표 수준을 계산하여 효율성과 사용 편의성을 크게 높입니다. 간단한 거래 규칙을 이해하려면 아래 전략을 사용한 거래 스크린샷을 살펴보세요. 설정, 세트 파일, 데모 버전, 지침, 문제 해결 등은 다음에서 얻을 수 있습니다. [블로그] 다음에서 리뷰를 읽거나 작성할 수 있습니다. [링크] 버전 [MetaTrader 5] 진입점 계산 규칙 포지션 개설 진입점을 계산하려면 VR Cub 도구를 마지막 최고점에서 마지막 최저점까지 늘려야 합니다. 첫 번째 지점이 두 번째 지점보다 빠른 경우, 거래자는 막대가 중간선 위에서 마감될 때까지 기다립니다
Rainbow Price Visualizer
Vincent Jose Proenca
Rainbow Price Visualizer v1.21 See where the market really breathes. Turns your MT4 chart into an ultra-precise heatmap that highlights price zones favored by big players. Why it matters 300 price levels at 0.2‑pip resolution — microscopic detail. 8 visual themes (Rainbow, Fire, Ocean…) for instant readibility. Smart opacity: low noise fades, real zones pop. Lightweight rendering with automatic cleanup. Fully customizable: saturation, opacity, resolution, history depth. Bands project into the f
Trend Ray
Andriy Sydoruk
The indicator shows the potential trend direction by cyclical-wave dependence. Thus, all the rays of the intersection will be optimal rays, in the direction of which the price is expected to move, taking into account the indicator period. Rays can be used as a direction for potential market movement. But we must not forget that the approach must be comprehensive, the indicator signals require additional information to enter the market.
Candlestick Pattern Scanner is a multi-timeframe and multi-symbol dashboard and alert system that checks all timeframes and currency pairs for different candlestick patterns that are formed in them. Scanner is integrated with support and resistance zones so you can check the candlestick patterns in the most important areas of the chart to find breakout and reversal patterns in the price chart. Download demo version   (works on M30,D1,W1 timeframes and 20 symbols of Market Watch window) Read the
FreqoMaster
Stanislav Korotky
The main idea of this indicator is rates analysis and prediction by Fourier transform. The indicator decomposes exchange rates into main harmonics and calculates their product in future. The indicator shows 2 price marks in history, depicting price range in the past, and 2 price marks in future with price movement forecast. Buy or sell decision and take profit size are displayed in a text label in the indicator window. The indicator uses another indicator as an engine for calculations - FreqoMet
Trendiness Index
Libertas LLC
5 (3)
"The trend is your friend" is one of the best known sayings in investing, because capturing large trendy price movements can be extremely profitable. However, trading with the trend is often easier said than done, because many indicators are based on price reversals not trends. These aren't very effective at identifying trendy periods, or predicting whether trends will continue. We developed the Trendiness Index to help address this problem by indicating the strength and direction of price trend
If you found this EA, it's probably because you want to get a funded account with a prop firm, but you see a rule that most of traders fear :   Maximum Daily Drawdown.  I've been through this problem myself as   I'm a prop firm trader   and I've made a bot to solve this rule, and you can get it to solve this problem too. How does it work ? When you first setup this EA, you need to input the   initial deposit   which corresponds to the size of your funded account. For exemple if you get a 10k$ f
Trade with Gann on your side!! MASTER CIRCLE 360 CIRCLE CHART, originally created by Gann admitted that this is “The Mother of all charts”. It is one of the last studies that this great trader left for us. The numeric tab le is apparently quite simple like all the tables and is based on square numbers, the SQUARE OF 12 and is by evolution, one of the most important square numbers. Here we can find CYCLE, PRICE AND TIME thanks to angles and grades, to show past and future support and resistance.
Wave Wolf MT4
Andrei Salanevich
거래 단말기의 현재 창에 늑대 파도를 검색하여 표시하도록 설계되었습니다. 거래에 늑대 파도를 사용하는 상인을위한 훌륭한 지표. 거래 전략에서의 적용은 효율성과 수익성을 크게 증가시킬 것입니다. 표시기에 대한 정보 다른 늑대 웨이브 지표와는 달리,웨이브 고원지 외환 지표는 크게 그 효과를 증가 기능을 가지고 있습니다: 첫 번째는 열린 창 5 점 매개 변수(진정한 값)정보 지원을 제공합니다,즉 늑대 파도가 나타난 차트의 창을 확장합니다. 예를 들어,유로화 차트가 열려 있고 각각에 웨이브 월드 표시기가 설치되어있는 경우 유로화 모델이 감지되면 해당 차트가 자동으로 다른 차트의 맨 위에 포 그라운드로 가져 오므로 많은 상품을 거래 할 때 매우 편리합니다.  두 번째 기능은 맥 디에 내장 된 발산 분석,사용자가 자신을 선택할 수있는 매개 변수(기본 설정(12,26,9))입니다. 그런데 일반적인 오실레이터의 값은 작업 창에 표시되지 않으며 점을 형성 할 때 가격 라벨의 색상에만 반영됩니다
The indicator detects and displays 3 Drives harmonic pattern (see the screenshot). The pattern is plotted by the extreme values of the ZigZag indicator (included in the resources, no need to install). After detecting the pattern, the indicator notifies of that by a pop-up window, a mobile notification and an email. The indicator highlights the process of the pattern formation and not just the complete pattern. In the former case, it is displayed in the contour triangles. After the pattern is com
Super Reversal Pattern
Parfait Mujinga Ndalika
Super Reversal Pattern Indicator Unlock the power of advanced pattern recognition with our Super Reversal Pattern Indicator. Designed for traders seeking precision and reliability, this indicator identifies one of the most effective reversal patterns in technical analysis, offering a significant edge in your trading strategy. Key Features: Non-Repainting Accuracy: Enjoy the confidence of non-repainting technology. Once a Super Reversal Pattern is detected, it remains static, providing consiste
Owl smart levels
Sergey Ermolov
4.24 (37)
MT5 버전  |   FAQ Owl Smart Levels Indicator 는   Bill Williams 의 고급 프랙탈, 시장의 올바른 파동 구조를 구축하는 Valable ZigZag, 정확한 진입 수준을 표시하는 피보나치 수준과 같은 인기 있는 시장 분석 도구를 포함하는 하나의 지표 내에서 완전한 거래 시스템입니다. 시장과 이익을 취하는 장소로. 전략에 대한 자세한 설명 표시기 작업에 대한 지침 고문-거래 올빼미 도우미의 조수 개인 사용자 채팅 ->구입 후 나에게 쓰기,나는 개인 채팅에 당신을 추가하고 거기에 모든 보너스를 다운로드 할 수 있습니다 힘은 단순함에 있습니다! Owl Smart Levels   거래 시스템은 사용하기 매우 쉽기 때문에 전문가와 이제 막 시장을 연구하고 스스로 거래 전략을 선택하기 시작한 사람들 모두에게 적합합니다. 전략 및 지표에는 눈에 보이지 않는 비밀 공식 및 계산 방법이 없으며 모든 전략 지표는 공개되어 있습니다. Owl Smart Leve
An indicator of pattern #31 ("Long Island") from Encyclopedia of Chart Patterns by Thomas N. Bulkowski. The second gap is in the opposite direction. Parameters: Alerts - show alert when an arrow appears   Push - send a push notification when an arrow appears (requires configuration in the terminal) GapSize - minimum gap size in points ArrowType - a symbol from 1 to 17 ArrowVShift - vertical shift of arrows in points   ShowLevels - show levels ColUp - color of an upward line ColDn - color of a
Like you when I first started trading, It was overwhelming...learning about indicators, about lotsize, leverage and many more things. Its been almost 3 years. I am more knowledgeable in trading. My trading continues to improve as I work on my strategy, technical analysis, trading psychology and trade management. One thing I am not worried about though is being able to close my trades quicky if a trade goes against me or if the trade has reached my take profit level with the help of my Close Tra
Reversal Monster Mini
Abdulfattah Yahya Mohammed Alhazmi
The Most advanced and comprehensive EA to trade Trend Reversals/Pullbacks It is a very profitable EA, to trade trends breakout, and manage trades, takeprofit, stoploss, move to breakeven, and trailing stop. The   “Reversal Monster EA”   trades Reversal/Pullbacks when the current price of the pair pullback to a predefined horizontal level or trendline on the currency chart. The opening of the position can be immediate after pullback to the drawn trendline or after closing the candle below/above
FREE
캔들의 종가를 예측하는 지표입니다. 지표는 주로 D1 차트에서 사용하기 위한 것이. 이 지표는 전통적인 외환 거래와 바이너리 옵션 거래 모두에 적합합니다. 지표는 독립형 거래 시스템으로 사용하거나 기존 거래 시스템에 추가로 사용할 수 있습니다. 이 표시기는 현재 양초를 분석하여 양초 본체 내부의 특정 강도 요인과 이전 양초의 매개변수를 계산합니다. 따라서 지표는 시장 움직임의 추가 방향과 현재 양초의 종가를 예측합니다. 이 방법 덕분에 지표는 단기 및 중장기 거래 모두에 적합합니다. 지표를 사용하면 시장 상황을 분석하는 동안 지표가 생성할 잠재적 신호의 수를 설정할 수 있습니다. 표시기 설정에는 이를 위한 특별한 매개변수가 있습니다. 또한 인디케이터는 새로운 신호에 대해 차트의 메시지 형태, 이메일 및 PUSH 알림 형태로 알릴 수 있습니다. 구매 후 저에게 꼭 써주세요! 나는 당신에게 지표와 거래에 대한 나의 추천을 줄 것입니다! 또한 보너스를 받으세요!
This is a new strategy for SUPPLY DEMAND areas It is based on a calculation using the tick volume to detect the big price action in market for both bear /bull actions this smart volume action candles are used to determine the supply and demand areas prices in between main supply and demand lines indicate sideway market  up arrows will be shown when prices moves above the main supply and the secondary supply lines Down arrows will be shown when prices moves below the main demand and the secondary
BPSPanel
Remi Passanello
BPS Panel Breakout Pro Scalper Solution Panel This indicator is part of the   RPTrade Pro Solutions  systems. BPS Panel   is a daily trend indicator using Price Action, Dynamic Support and Resistances. It's designed to be used by anyone, even the absolute beginner in trading can use it. NEVER repaints . Indications are given   from close to close . Designed to   be used alone , no other indicators are required. Gives you the trend and potential Take Profit at the beginning of the day. How doe
BreakEven Line is a very useful and easy to use indicator. In case of multiple positions opened on the same instrument, the indicator shows the breakeven point where it is possible to close the positions. Its graphic simplicity makes it an unobtrusive and customizable tool. You can enable/disable a line on a chart, so you can make the indicator invisible. Inputs Show cumulative BE (line on/off) Breakeven line color (to change the line color) Breakeven line style Breakeven line width Show short B
SMC Venom Model BPR 지표는 Smart Money(SMC) 개념 내에서 일하는 트레이더를 위한 전문 도구입니다. 가격 차트에서 두 가지 주요 패턴을 자동으로 식별합니다. FVG (공정 가치 갭)는 3개의 캔들의 조합으로, 첫 번째와 세 번째 캔들 사이에 갭이 있습니다. 이는 볼륨 지원이 없는 레벨 사이에 구역을 형성하여 종종 가격 수정으로 이어집니다. BPR (균형 가격 범위)은 두 개의 FVG 패턴의 조합으로, "브리지"를 형성합니다. 이는 가격이 낮은 볼륨 활동으로 움직일 때 브레이크아웃과 레벨로의 복귀 구역으로, 캔들 사이에 갭을 생성합니다. 이러한 패턴은 거래자가 차트에서 거래량과 가격 역학을 분석하여 주요 지지/저항 수준, 돌파 구역 및 진입 지점을 식별하는 데 도움이 되며, 여기서 대형 시장 참여자와 일반 참여자 간의 상호 작용이 발생합니다. 이 지표는 사각형과 화살표 형태로 패턴을 시각화하며 유연한 경고 설정도 지원합니다. 주요 특징: 패턴 표시 모드:
Divergent Accuracy
Yaroslav Varankin
The Divergent Accuracy indicator is designed to identify discrepancies on the price chart of a currency pair. The Divergent Accuracy indicator recognizes bullish and bearish divergences, and can also output a signal that a divergence has been detected... In addition to identifying divergences, the indicator works with overbought and oversold levels, and also shows arrows to enter the market...
For sure, this indicator has become very popular amongst traders. Through coding this indicator will give you the most accurate levels possible for your trading analysis. We have also added in the ability for you to receive alerts when the price breaks above or below a Support or Resistance lines! HOW TO USE The red rectangles represent your resistance/supply zone. The green rectangles represent your support/demand zone.  BONUS FEATURES We coded this indicator with the ability to switch between
Advisor "Orders Assistant" is designed to control the positions and orders that are opened manually by the trader. The control is performed by automatically placing TakeProfit and StopLoss orders after the position is opened by the trader, or setting a pending order and further tracking the position using the services “Transfer StopLoss to breakeven” and “Trailing Stop”. The Expert Advisor also provides the ability to install virtual TakeProfit and StopLoss, which allows you to use scalping str
Happy Scalping Indicator
Leandro Bernardez Camero
이 지표는 공격적인 스캘핑 과 바이너리 옵션에서 빠른 진입 을 위해 설계되었습니다 , 각 캔들 마다 신호를 생성하여 언제든지 무엇이 일어나고 있는지 정확히 알 수 있습니다. Happy Scalping 채널에 가입하세요: MQL5 재작성 없음 : 현재 캔들의 신호는 실시간 으로 생성됩니다. 이는 캔들이 아직 형성 중일 때 가격이 이전 캔들의 종가에 비해 상승하거나 하락하는지에 따라 신호가 변경될 수 있음을 의미합니다. 그러나 캔들이 닫히면 , 신호의 색상은 완전히 고정됩니다 . 변경되지 않으며, 사라지지 않고, 이동하지 않습니다. 보이는 그대로 남습니다. 왜 이렇게 설계되었나요? 많은 스캘퍼들은 특히 가격의 돌파나 급격한 움직임 이 있을 때 즉시 신호를 받는 것을 선호합니다. 이를 통해 그런 빠른 피프스를 바로잡을 수 있습니다. 반면, 일부 트레이더는 닫힌 캔들로 확인을 기다리는 것 을 선호하며, 이 지표는 그들도 완벽하게 사용할 수 있습니다. 두 가지 접근 방식 모두 유효합니
Fractal Zig Zag
Mikhail Nazarenko
A   professional version of the ZigZag indicator for visualizing the structure of price movements by fractals. Fractal ZigZag fixes the flaws of the standard version of the ZigZag indicator MT4. It uses Price action and a unique filtering algorithm to determine fractals. Suitable for all types of trading. Ideal for trading according to the WM pattern "Sniper" strategy !!! Features Marks the place of price reversal during the formation of a new fractal with specified parameters. Suitable for al
Gold Titan King Scalper
Dodong Christian Arnon
Indicator Description GOLD TITAN KING SIGNAL INDICATOR High-Precision Gold Scalping Buy/Sell Signals – Manual Trading Assistant Overview The Gold Titan King Signal Indicator is a manual trading assistant tool designed for high-frequency scalping on Gold (XAUUSD) and other major pairs. It generates clear BUY/SELL signals with precise entry levels, along with adjustable Stop Loss and Take Profit levels displayed directly on the chart. ️ This tool is NOT an EA. It does not execute trades
The analyzer panel allows traders to add the pending order grid (Buy Limit, Sell Limit, Buy Stop, Sell Stop) quickly and efficiently.   Parameters stop mode - select stop setting mode every order - stop levels are set for each order separately position as - common stop levels for all orders order type - select pending order type Buy Limit Sell Limit Buy Stop Sell Stop magic - set a magic number for open orders if necessary. If position as mode is enabled, stop levels are corrected for all orders
Koala Supply Demand
Ashkan Hazegh Nikrou
5 (3)
MetaTrader 4용 Koala 공급 수요 지표 소개 (긍정적이든 부정적이든 귀하의 리뷰나 피드백을 공유하여 다른 트레이더가 귀하의 경험을 통해 이익을 얻을 수 있도록 해주세요.) : 코알라 공급 및 수요 지표에 오신 것을 환영합니다. 이 지표는 끊임없는 공급 및 수요 지역을 식별하기 위해 설계되었습니다. 이 지표는 트레이더가 시장을 지역 영역으로 볼 수 있도록 도와주며 가격이 어떻게 강력한 지역을 존중하는지 확인할 수 있습니다. 또한 이 지표는 지역 내에서 형성된 가격 행동 신호를 보여줄 수도 있습니다.  코알라 트레이딩 솔루션 채널 에 가입하여 모든 코알라 제품에 대한 최신 소식을 확인하십시오. 가입 링크는 다음과 같습니다: https://www.mql5.com/en/channels/koalatradingsolution https://www.mql5.com/en/blogs/post/755700 !중요 : 이 제품에는 무료 전문가 고문 (EA)가 포함되어 있습니다. 구매 후
FREE
Chart Patterns Detect 15 patterns (Ascending Triangle, Descending Triangle, Rising Wedge, Falling Wedge, Bullish Flag, Bearish Flag, Bullish Rectangle, Bearish Rectangle Symmetrical triangle, Head and Shoulders, Inverted Head and Shoulders, Triple top, Triple Bottom, Double Top, Double Bottom) Use historical data to calculate the probability of each pattern to succeed (possibility to filter notification according to the chance of success) gives graphic indication about the invalidation level and
이 제품의 구매자들이 또한 구매함
Local Trade Copier EA MT4
Juvenille Emperor Limited
4.96 (106)
Local Trade Copier EA MT4 를 사용하여 매우 빠른 거래 복사 경험을 해보세요. 1분 안에 간편하게 설정할 수 있으며, 이 거래 복사기를 사용하면 Windows 컴퓨터 또는 Windows VPS에서 여러 개의 MetaTrader 터미널 간에 거래를 0.5초 미만의 초고속 복사 속도로 복사할 수 있습니다. 초보자든 전문가든 Local Trade Copier EA MT4 는 다양한 옵션을 제공하여 사용자의 특정 요구에 맞게 맞춤 설정할 수 있습니다. 이는 수익 잠재력을 높이려는 모든 사람을 위한 최고의 솔루션입니다. 지금 사용해보시고 이것이 왜 시장에서 가장 빠르고 쉬운 무역용 복사기인지 알아보세요! 팁: 여기 에서 데모 계정에서 Local Trade Copier EA MT4 데모 버전을 다운로드하여 사용해 볼 수 있습니다. 다운로드한 무료 데모 파일을 MT4 >> File >> Open Data Folder >> MQL4 >> Experts 폴더에 붙여넣고 터미널
Trade Assistant MT4
Evgeniy Kravchenko
4.42 (193)
거래당 위험 계산, 라인을 사용한 손쉬운 신규 주문, 부분 청산 기능을 통한 주문 관리, 7가지 유형의 트레일링 스탑 및 기타 유용한 기능을 제공합니다. 추가 자료 및 지침 설치 지침 - 애플리케이션 지침 - 데모 계정용 애플리케이션 평가판 라인 기능       - 차트에 개시선, 손절매, 차익실현을 표시합니다. 이 기능을 사용하면 새로운 주문을 쉽게 하고 개봉 전에 추가 특성을 볼 수 있습니다. 위기 관리       -       위험 계산 기능은 설정된 위험과 손절매 주문의 크기를 고려하여 새 주문의 볼륨을 계산합니다. 이를 통해 손절매 크기를 설정하고 동시에 설정된 위험을 존중할 수 있습니다. 로트 계산 버튼 - 위험 계산을 활성화/비활성화합니다. 필요한 위험 값은 위험 필드에 0에서 100 사이의 백분율 또는 예금 통화로 설정됩니다. 설정 탭에서 위험 계산 옵션을 선택합니다. $ 통화, % 잔액, % 지분, % 자유 마진, % 사용자 정의, % AB 이전 일, % AB
Trade Manager EA에 오신 것을 환영합니다. 이 도구는 거래를 보다 직관적이고 정확하며 효율적으로 만들기 위해 설계된 궁극적인 리스크 관리 도구 입니다. 단순한 주문 실행 도구가 아닌, 원활한 거래 계획, 포지션 관리 및 리스크 제어를 위한 종합 솔루션입니다. 초보자부터 고급 트레이더, 빠른 실행이 필요한 스캘퍼에 이르기까지 Trade Manager EA는 외환, 지수, 상품, 암호화폐 등 다양한 시장에서 유연성을 제공합니다. Trade Manager EA를 사용하면 복잡한 계산은 이제 과거의 일이 됩니다. 시장을 분석하고 진입, 손절 및 익절 수준을 차트의 수평선으로 표시한 후 리스크를 설정하면, Trade Manager가 이상적인 포지션 크기를 즉시 계산하고 SL 및 TP 값을 실시간으로 표시합니다. 모든 거래가 간편하게 관리됩니다. 주요 기능: 포지션 크기 계산기 : 정의된 리스크에 따라 거래 크기를 즉시 결정합니다. 간단한 거래 계획 : 진입, 손절, 익절을 위한
Exp COPYLOT CLIENT for MT4
Vladislav Andruschenko
4.69 (65)
MetaTrader 4용 트레이드 복사기.       모든 계정의 외환 거래, 포지션, 주문을 복사합니다. 그것은 최고의 무역 복사기 중 하나입니다       MT4 - MT4, MT5 - MT4       위해       카피롯 MT4       버전(또는       MT4 -  MT5   MT5 - MT5       위해       카피롯 MT5       버전). MT5 버전 전체 설명   +DEMO +PDF 구입 방법 설치하는 방법     로그 파일을 얻는 방법     테스트 및 최적화 방법     Expforex의 모든 제품 복사기   버전         MetaTrader 5   터미널 (   МТ5 - МТ5, МТ4 - МТ5   ) -   Copylot Client MT5 고유한 복사 알고리즘은 마스터 계정에서 고객 계정으로 모든 거래를 정확하게 복사합니다. 이 제품은 또한 높은 작동 속도에서 높은 오류 처리로 유명합니다. 강력한 기능 세트. 프로그램은 여러 터
The product will copy all telegram signal to MT4   ( which you are member  ) , also it can work as remote copier.  Easy to set up, copy order instant, can work with almost signal formats, image signal, s upport to translate other language to English Work with all type of channel or group, even channel have "Restrict Saving Content", work with  multi channel, multi MT5 Work as remote copier: with signal have ticket number, it will copy exactly via ticket number. Support to backtest signal. How to
Comprehensive on chart trade panel with the unique ability to be controllable from mobile as well. Plus has a library of downloadable configuration, e.g. exit rules, extra panel buttons, pending order setup and more. Please see our product video. Works with all symbols not just currency pairs. Features On chart panel plus controllable from free app for Windows, iPhone and Android Built-in script engine with library of downloadable configuration, e.g. add 'Close All Trades in Profit' button, exit
--------------Welcome to use [MQL5 Signal Analyze Master]------------------  Function: Draw order tracks of MQL5 MT4 and MT5 signal on MT4 chart. [Using guide] 1.Use it as Experts. 2.Download history record from MQL5 signal(MT4 signal or MT5 signal).  3.Paste history record file below "MQL4/Files/" 4.Load [Signal Analyze Master] on the symbol chart what you want to analyze. 5.Paste the history record file name to parameter 'FileName' 6.Select  SignalType  match the history you download on MT4
Trade copier MT4
Alfiya Fazylova
4.58 (33)
Trade Copier는 거래 계정 간의 거래를 복사하고 동기화하도록 설계된 전문 유틸리티입니다. 복사는 공급자의 계정/단말기에서 동일한 컴퓨터 또는 vps에 설치된 수신자의 계정/단말기로 발생합니다. 구매하기 전에 데모 계정에서 데모 버전을 테스트할 수 있습니다. 데모 버전 여기 . 전체 지침 여기 . 주요 기능 및 이점: 복사기는 "МТ4> МТ4", "МТ4> МТ5", "МТ5> МТ4" 복사를 지원합니다. 복사기는 데모 계정 > 실 계정, 실 계정 > 데모 계정, 데모 계정 > 데모 계정 및 실제 계정 > 실 계정 복사를 지원합니다. 복사기는 읽기 전용 암호가 적용된 투자자 계정에서 복사를 지원합니다. 하나의 공급자 터미널은 여러 수신 터미널로 트랜잭션을 보낼 수 있고 하나의 수신 터미널은 여러 공급자 터미널에서 트랜잭션을 수신할 수 있습니다. 복사기는 귀하 또는 귀하의 고문이 거래하는 동일한 터미널에서 작동할 수 있습니다. 높은 복사 속도(0.5초 미만). 복사기에는 간편
Copy Cat More Trade Copier MT4 (복사 고양이 MT4) 는 단순한 로컬 트레이드 카피어가 아니라, 오늘날의 거래 환경을 위해 설계된 완전한 리스크 관리 및 실행 프레임워크입니다. Prop Firm 챌린지부터 개인 계좌 관리까지, 강력한 실행력, 자본 보호, 유연한 설정, 고급 거래 처리 기능을 통해 모든 상황에 적응합니다. 이 카피어는 Master(송신자) 와 Slave(수신자) 모드 모두에서 작동하며, 실시간으로 시장가/지정가 주문, 거래 수정, 부분 청산, Close By 작업을 동기화합니다. 데모 및 실계좌 모두 호환되며, 거래용 비밀번호 또는 투자자 비밀번호로도 사용할 수 있습니다. Persistent Trade Memory 기술을 통해 EA, 터미널, VPS가 재시작되더라도 거래가 복원됩니다. 여러 Master와 Slave를 동시에 관리할 수 있으며, 브로커 간 차이는 접두사/접미사 자동 감지 또는 심볼 매핑으로 처리됩니다. 매뉴얼/설정: Copy C
Trade Dashboard MT4
Fatemeh Ameri
4.96 (53)
Tired of complex order placement and manual calculations? Trade Dashboard is your solution. With its user-friendly interface, placing orders becomes effortless, by a single click, you can open trades, set stop loss and take profit levels, manage trade lot size, and calculate risk to reward ratios, allowing you to only focus on your strategy. Say goodbye to manual calculations and streamline your trading experience with Trade Dashboard. Download  Demo Version  right now. You can find  Details of
MT4 to Discord Signal Provider 는 Discord로 직접 거래 신호를 보내는 데에 설계된 사용자 친화적이고 완전히 맞춤화할 수 있는 유틸리티입니다. 이 도구는 귀하의 거래 계좌를 효율적인 신호 제공자로 변환합니다. 귀하의 스타일에 맞게 메시지 형식을 사용자 정의하세요! 사용 편의성을 위해 사전에 디자인된 템플릿을 선택하고 포함하거나 제외할 메시지 요소를 선택할 수 있습니다. [ 데모 ] [ 매뉴얼 ] [ MT5 버전 ] [ Telegram 버전 ]  New: [ Telegram To MT5 ] 설정 간편한 설정을 위해 저희의 상세한 사용자 가이드 를 따르세요. Discord API에 대한 사전 지식이 필요 없습니다; 필요한 모든 도구를 제공합니다. 주요 기능 구독자 업데이트를 위한 주문 세부 정보를 사용자 정의합니다. 각 계층이 다른 수준의 신호 접근을 제공하는 브론즈, 실버, 골드와 같은 계층적 구독 모델을 구현합니다. 주문이 실행된 차트의 스크린샷을 첨
Riskless Pyramid
Snapdragon Systems Ltd
5 (1)
Introduction This powerful MT4 trade mangement EA offers a way potentially to aggressively multiply trade profits in a riskfree manner. Once a trade has been entered with a defined stoploss and take profit target then the EA will add three pyramid add-on trades in order to increase the overall level of profit. The user sets the total combined profit target to be gained if everything works out. This can be specified either as a multiple of the original trade profit or as a total dollar amount. Fo
MT4 to Telegram Signal Provider 는 사용하기 쉽고 완전히 사용자 정의가 가능한 도구로, 텔레그램으로 신호를 보내어 계정을 신호 제공자로 변환할 수 있습니다. 메시지 형식은 완전히 사용자 정의가 가능합니다! 그러나 간단한 사용을 위해 미리 정의된 템플릿을 선택하고 메시지의 특정 부분을 활성화하거나 비활성화할 수도 있습니다. [ 데모 ]  [ 매뉴얼 ] [ MT5 버전 ] [ 디스코드 버전 ] [ 텔레그램 채널 ]  New: [ Telegram To MT5 ] 설정 단계별 사용자 가이드 가 제공됩니다. 텔레그램 API에 대한 지식이 필요 없으며, 개발자가 필요한 모든 것을 제공합니다. 주요 기능 구독자에게 보낸 주문 세부 정보를 사용자 정의할 수 있는 기능 예를 들어 브론즈, 실버, 골드와 같은 계층 구독 모델을 만들 수 있습니다. 골드 구독은 모든 신호 등을 받게 됩니다. ID, 심볼 또는 코멘트별 주문 필터링 주문이 실행된 차트의 스크린샷을 포함 보낸
CloseIfProfitorLoss with Trailing
Vladislav Andruschenko
4.87 (31)
이익 추적 기능으로 총 이익/손실에 도달하면 MetaTrader 4에서 포지션을 청산합니다. 가상 정지 (별도 주문) 을 활성화할 수 있습니다. BUY 및 SELL 포지션을 별도로 계산하고 마감합니다 (BUY SELL 별도). 모든 심볼 또는 현재 심볼 만 닫고 계산합니다 (모든 심볼). 이익을 위해 후행 추적 을 활성화합니다 (후행 이익). 예금 통화, 포인트, 잔액의 %에 대한 총 손익을 마감합니다. 이 애플리케이션은 다른 EA와 함께 또는 수동 거래와 함께 모든 계정에서 사용하도록 설계되었습니다. MT5 버전 전체 설명 + DEMO + PDF 구입 방법 설치하는 방법 로그 파일을 얻는 방법 테스트 및 최적화 방법 Expforex의 모든 제품 일부 쌍 또는 모든 쌍의 총 거래 잔액이 설정에서 지정된 값보다 크거나 같으면 모든 포지션이 닫히고 주문이 삭제됩니다. 이 버전은 지정된 이익 수준에서 포지션을 마감할 수 있을 뿐만 아니라 더 나은 결과를 위해 이익을 추적할 수도 있습니다
My Trade History PRO
Bernhard Schweigert
5 (3)
현재 20% 할인 !! 초보자 또는 전문가 상인을위한 최상의 솔루션! 당신의 거래를 검토하는 것은 성공적인 거래자의 첫 번째 단계입니다. 성공적인 트레이더는 거래 성과를 정기적으로 검토하는 습관이 있습니다. 이 도구는 당신이 그렇게하는 데 도움이 될 것입니다. 검토 과정은이 도구에서 가장 효과적이며 거래를 추적합니다. 수동 거래 또는 EA의 거래를 분석하십시오. 3 가지 일반적인 견해를 사용하십시오. 버튼을 클릭하는 것만으로 전환하려면 폐쇄 거래 열린 거래 폐쇄 + 공개 거래 모든 거래는 각 기호에 대해 나열됩니다. 다른 기호로 이동하려면 기호 이름 버튼을 클릭하십시오. 새로 개설 및 마감 거래에 경고를 사용하십시오. 열린 거래를 보는 데 매우 유용합니다. EA, 신호 또는 수동으로 시작될 수 있습니다. 이익 또는 PIP의 결과를 전환하려면 버튼을 클릭하십시오. 이익 핍 그런 다음 3 분석 유형을 전환하십시오. 버튼을 클릭합니다. 모든 기호 모드 1 스피볼
Auto SLTP Maker MT4  is an assistant for all those who forget to set StopLoss and/or TakeProfit in deal parameters, or trade on a very fast market and fail to place them in time. This tool automatically tracks trades without StopLoss and/or TakeProfit and checks what level should be set in accordance with the settings. The tool works both with market and pending orders. The type of orders to work with can be set in the parameters. It can track either trades for the instrument it runs on, or all
TradePanel MT4
Alfiya Fazylova
4.85 (91)
Trade Panel은 다기능 거래 보조원입니다. 이 애플리케이션에는 수동 거래를 위한 50개 이상의 거래 기능이 포함되어 있으며 대부분의 거래 작업을 자동화할 수 있습니다. 전략 테스터에서는 애플리케이션이 작동하지 않습니다. 구매하기 전에 데모 계정에서 데모 버전을 테스트할 수 있습니다. 데모 버전 여기 . 전체 지침 여기 . 거래. 한 번의 클릭으로 거래 작업을 수행할 수 있습니다: 자동 위험 계산을 통해 지정가 주문 및 포지션을 엽니다. 한 번의 클릭으로 여러 주문과 포지션을 열 수 있습니다. 주문 그리드를 엽니다. 그룹별 대기 주문 및 포지션을 마감합니다. 포지션 반전(매수 청산 후 매도 개시 또는 매도 청산 후 매수 개시). 포지션 고정(매수 포지션과 매도 포지션의 양을 동일하게 하는 추가 포지션 개설). 한 번의 클릭으로 모든 포지션을 부분 청산합니다. 모든 포지션의 이익실현과 손절매를 동일한 가격 수준으로 설정합니다. 모든 포지션에 대한 손절매를 해당 포지션의 손익 분기
Exp SafetyLock PRO
Vladislav Andruschenko
4.57 (28)
SAFETYLOCK을 사용하면 거래자는 이미 열린 포지션에 대해 반대 주문을 설정하여 강한 시장 반전을 피할 수 있습니다. 거래자 또는 EA가 포지션을 열면, SAFETYLOCK은 자동으로 반대 방향의 보류 주문을 설정합니다. 포지션이 손실 상태로 전환되면, 이 보류 주문이 활성화되어 잠금(락)을 생성하여 손실을 최소화합니다. EA는 초기 포지션을 닫거나, 후행 정지를 사용하여 수익을 최적화하거나, 로트를 증가시켜 거래 전략을 강화하는 다양한 옵션을 제공합니다. 또한, 포지션 가격에 맞추어 미결 주문의 오픈 가격을 조정하여 시장 움직임에 유연하게 대응할 수 있습니다. 전체 설명 +DEMO +PDF 구입 방법 설치하는 방법     로그 파일을 얻는 방법     테스트 및 최적화 방법     Expforex의 모든 제품 매개변수 기본(블로그의 매개변수에 대한 전체 설명) MilliSecondsTimerForMonitoring – 알고리즘 실행 시간을 밀리초 단위로 설정합니다(기본
Trend Line Optimizer
Evgenii Aksenov
4.11 (19)
이 추세선 프로 표시기에 대한 자동 매개 변수 최적화 프로그램입니다 쉽고 빠르게 당신은 당신의 마음에 드는 추세선 프로 표시기에 대한 최적의 매개 변수를 선택합니다. 최적화에는 몇 초 밖에 걸리지 않습니다. 최적화할 수 있는 최고의 매개변수에 대한 각 쌍고기간:진폭,TP1-TP3,stoploss 에뿐만 아니라,값은 시간을 필터 및 카테고에 필터가 역사를 선택 섹션(일) 다른 시간대를 최적화하려면 다른 범위의 히스토리가 필요합니다: M5-M15 계산 범위 매개 변수 설정(일)=60(3 개월) M30-H1 계산 범위 매개 변수 설정(일)=120(6 개월) H4 매개 변수 계산 범위 설정(일)=240(1 년) D1-W1 매개 변수 계산 범위 설정(일)=720(3 년) Mn1 매개 변수 계산 범위 설정(일)=1200(5 년) 최적화 후 매개 변수는 폴더의 기성품 세트 파일에 자동으로 저장됩니다.MQL4>Files>trendlineoptimizedsettings 최적화 유틸리티 사용
TPSpro Trade PRO
Roman Podpora
4.67 (6)
주어진 손절매 수준에 따라 포지션 규모 또는 위험을 즉시 계산할 수 있는 도구는 전문 트레이더와 초보 트레이더 모두에게 필수적입니다. TRADE PRO 거래 유틸리티는 빠르고 정확한 계산을 제공하여 시간적 제약이 있고 변동성이 큰 시장 상황에서 의사 결정을 내리는 데 도움을 줍니다. MT5 버전        /   추가 설치 자재 주요 기능: 독창적이고, 간결하며, 효과적입니다. 메인 거래 패널을 여는 독특하고 편리한 방법: 차트 오른쪽에 마우스 커서를 올려놓고 원하는 방향을 클릭하여 선물 주문을 하세요. 시장가 주문을 빠르게 설정할 수 있습니다. TRADE PRO를 사용하여 잔액 또는 자본 대비 백분율로 위험 수준을 설정하거나 특정 위험 금액을 지정할 수 있습니다. 차트에서 손절매 수준을 시각적으로 정의하면 도구가 각 통화 쌍에 대한 최적의 포지션 크기를 자동으로 계산합니다. 또한 지정된 위험-보상 비율을 기반으로 목표 수익(익절)을 자동으로 설정할 수 있습니다. 총 위험을 분
Copy Master mt4
Evgenii Aksenov
5 (5)
이 유틸리티를 사용하면 마스터 설정이있는 한 터미널에서 슬레이브 설정이있는 다른 터미널로 모든 트랜잭션을 복사 할 수 있습니다 동시에 복사 할 쌍을 선택하고 여러 매개 변수에 따라 복사 된 순서의 크기를 설정할 수 있습니다. 드로우 다운 손실 한도를 설정하거나 수익성있는 거래 만 복사하십시오 Mt4 또는 mt5 에서 다른 브로커의 mt4 또는 MT5 로 거래를 복사 할 수 있습니다 이제 mt4 에서 일하는 전문가의 신호를 MT5 터미널 또는 뒤로 복사하는 것이 어렵지 않을 것입니다 복사 마스터를 사용하여 다른 신호,전문가 고문,수동 거래에서 거래를 복사하십시오.  를 사용하여 설정을 변경할 수 있습니다 많은 크기,무역 방향으로만 복사 수익을 거래하고 설정 값을 저장하는 금고  복사 마스터는 하나의 계정에 서로 다른 가입 신호의 여러 전략을 결합 할 수 있습니다 익을 MT4,당신은 필요합 복사본을 마스터 MT5 버전:  https://www.mql5.com/ko/mar
Unlimited Trade Copier Pro is a tool to copy trade remotely to multiple MT4, MT5 and cTrader accounts at different computers/locations over internet. This is an ideal solution for you if you are a signal provider and want to copy your trades to other receivers globally on your own rules. One provider can copy trades to multiple receivers and one receiver can get trade from multiple providers as well. The provider can even set the subscription expiry for each receiver, so that receiver will not b
The indicator has three main tools: Magnifier (Zoom chart), Ruler  ( Time and Price scales ),   and Crosshair. You can move it all around with your mouse and customize different formats for  displaying , customize   size and color of each element. The Magnifier (zoom chart) allows you to display candles from any time frame and at different scales. Hotkeys: 'Q' - higher timeframe, 'A' - lower timeframe, 'W' - decrease candle size, 'S' - increase candle size, 'Z' - show/hide zoom chart You can
EasyInsight AIO MT4
Alain Verleyen
4 (2)
EASY Insight AIO – 스마트하고 손쉬운 트레이딩을 위한 올인원 솔루션 개요 외환, 금, 암호화폐, 지수, 심지어 주식까지 — 전 시장을 몇 초 만에, 수동 차트 확인이나 복잡한 설치, 인디케이터 설정 없이 스캔할 수 있다고 상상해 보세요. EASY Insight AIO 는 AI 기반 트레이딩을 위한 궁극의 플러그 앤 플레이(Plug & Play) 데이터 내보내기 도구입니다. 단 하나의 깔끔한 CSV 파일로 전체 시장 스냅샷을 제공하며, ChatGPT, Claude, Gemini, Perplexity 등 다양한 AI 플랫폼에서 즉시 분석할 수 있습니다. 창 전환, 복잡함, 차트 오버레이는 더 이상 필요 없습니다. 자동으로 내보내지는 순수하고 구조화된 데이터 인사이트만으로, 반복적인 차트 감시 대신 데이터 기반의 스마트한 의사결정에 집중할 수 있습니다. 왜 EASY Insight AIO인가요? 진정한 올인원 • 별도의 설정, 인디케이터 설치, 차트 오버레이가 필요 없습
PnL Calendar MT4
Keni Chetankumar Gajanan -
PnL Calendar ... analyse to profit PnL Calendar transforms your trading history into a clear calendar view, helping you spot profitable days, monitor risk in real time, and unify accounts with the new Multi‑Broker data export feature. Core Features Calendar Panel: Profit breakdowns by day, week, month, and year Account Panel: Balance, equity, margin alerts, multi‑timeframe summaries, overnight gap adjustments Risk Dashboard: Leverage, drawdown, profit factor, consistency ratio, holding time, ri
Account Protector Metatrader 4
Emmanuel Lovski Ijeawele Maduagwuna
Account Protector Meta Trader 4 This utility prevents risk of ruin per trading cycle.  Retail forex trading accounts are designed with   stop out levels   that make it impossible to quickly restore lost trading capital   (to initial levels)   in the event of a human or algorithm trader  " blowing"   an account. This hampers the efforts of a trader who after growing an account investment to a multiple of its initial value, suddenly suffers irreparable loss because of several trade entry mishaps.
Exp Averager
Vladislav Andruschenko
4.82 (22)
Exp-Averager는   평균 거래를 개시하여 특정 하락폭을 받은 거래를 평균화하도록 설계되었습니다. 고문은 추세에 맞춰 또는 현재 추세에 반대하여 새로운 위치를 열 수 있는 능력이 있습니다. 또한 일련의 위치에 적용되는 스마트 트레일링 스톱 기능도 포함되어 있습니다. 고문은 직위의 로트 크기를 늘리거나 줄일 수 있습니다. 이는 손실 포지션을 평균 가격으로 가져오기 위해 널리 사용되는 전략입니다. MT5 버전 전체 설명 +DEMO +PDF 구입 방법 설치하는 방법     로그 파일을 얻는 방법     테스트 및 최적화 방법     Expforex의 모든 제품 연결 TickSniper   스캘퍼   의 평균화 시스템 예 평균화 기능을 갖춘 범용 트레이딩 어드바이저   The X Expert Advisor는 차트가 첨부된 통화 쌍에 대해 작업합니다. 예를 들어 EURUSD에 대한 평균을 활성화하려면 EURUSD 차트를 열고 Expert Advisor를 실행하십시오. 메모
EchoTrade Telegram to MT4 Copier
Perpetual Chinemerem Vincent
5 (2)
EchoTrade Telegram to MT5 Copier Seamless, Instant, and Reliable Signal Copying - Direct from Telegram to MetaTrader 4! The product does not run in the strategy tester but you can get free trial version   here  for testing before purchase. Tired of manually executing trades from Telegram signals? EchoTrade automates the process, instantly copying trades from any Telegram channel or group directly into your MT5 account—accurately, efficiently, and without delay. Key Features: Universal Compatib
Trading History MT4
Siarhei Vashchylka
5 (9)
Trading History - A program for trading and money management on the history of quotes in stratagy tester. It can work with pending and immediate orders, and is equipped with trailing stop, breakeven and take profit functions. Very good for training and testing different strategies. Manual (Be sure to read before purchasing) Advantages 1. Allows you to test any trading strategy in the shortest possible time 2. An excellent simulator for trading training. You can gain months of trading experience
Eezeorder 2
Tawanda Tinarwo
5 (2)
NEW VERSION!  NB: IF YOU ARE USING A VERY HIGH RESOLUTION MACHINE AND THE EA DISPLAY LOOKS TOO SMALL, CONTACT ME SO I CAN HELP YOU. Open Multiple Trades on MT4 in 1 click at one price. Enter the Lot size Specify the number of trades you want to open Choose whether you want TP SL or Trailing Stop Once you are done, click Buy or Sell Open Multiple Pending Orders on MT4 in 1 click at one price. Enter the Lot size Specify the gap from the current price, where you want to place the pending order Spe
제작자의 제품 더 보기
Main Candles
Igor Semyonov
The indicator detects the following types of Japanese candlesticks: Doji, Hammer and/or Hanging Man, Shooting Star and/or Inverted Hammer, Spinning Top, Maribozu. The indicator is intended for manual and/or automated trading within an Expert Advisor. There is a possibility to choose colors for bullish and bearish candlesticks. For automated trading, use any indicator buffer of the double type: 0, 1, 2 or 3, whose value is not zero!
The indicator is intended for detecting big (long) and/or small (short) candlesticks. There is possibility of coloring the bullish and bearish candlesticks. The indicator can be used for manual and/or automated trading within an Expert Advisor. The indicator data that can be used for automated trading can be taken from one of four buffers of the double type: 0, 1, 2 or 3. Values must not be equal to zero. 
The indicator of DeMark fractals. The indicator can be drawn on the basis of price data and on the basis of a moving average. There is a possibility to color the up and down fractals. The indicator can be used for manual and for automated trading within an Expert Advisor. For automated trading, use any indicator buffer of the double type: 0 - up fractals, 1 - down fractals! Values of the buffers must not be equal to zero.  A moving average is drawn on the basis of input parameters: Calc_Method 
Stochastic Global
Igor Semyonov
4 (1)
Description A universal colored indicator Stochastic. The rising and falling lines and the levels of the indicator can be colored.   The indicator can be calculated as the standard one on the basis of a price or as a derivative on the basis of the following nineteen other indicators included in the standard package of the MetaTrader 4 terminal: AD - an indicator of accumulation and distribution of volume. OBV - On Balance Volume. Volume - tick volume indicator. AC - indicator of acceleration. AO
Description A universal colored indicator MACD Histo. The rising and falling of the indicator histogram can be colored.   The indicator can be calculated as the standard one on the basis of a price or as a derivative on the basis of the following twelve other indicators included in the standard package of the MetaTrader 4 terminal: AD - an indicator of accumulation and distribution of volume. OBV - On Balance Volume. Volume - tick volume indicator. Force - Force Index indicator. MFI - Money Flow
Description A colored universal indicator MACD Line (MA convergence-divergence indicator, shown as a histogram). The rising and falling of the indicator histogram can be colored. The indicator can be calculated as the standard one on the basis of a price or as a derivative on the basis of the following twelve other indicators included in the standard package of the MetaTrader 4 terminal: AD - an indicator of accumulation and distribution of volume. OBV - On Balance Volume. Volume - tick volume i
RSI Global
Igor Semyonov
Description A universal indicator RSI together with moving averages based on it. Depending on the need, moving averages can be disabled. You can color the indicator lines and levels: lines of RSI, moving average lines and thresholds of overbought and oversold levels.   The indicator can be calculated as the standard one on the basis of a price or as a derivative on the basis of the following eighteen other indicators included in the standard package of the MT4 terminal: AD - an indicator of accu
CCI Global
Igor Semyonov
5 (1)
Description A universal indicator CCI together with moving averages based on it. Depending on the need, moving averages can be disabled. You can color the indicator lines and levels: lines of CCI, moving average lines and thresholds of overbought and oversold levels.   The indicator can be calculated as the standard one on the basis of a price or as a derivative on the basis of the following eighteen other indicators included in the standard package of the MetaTrader 4 terminal: AD - an indicato
Description A multi-purpose multi-colored/multi-symbol indicator, which is a set of standard tools from the MetaTrader 4 terminal. The difference is that below the basic price chart it allows to calculate and build in a separate window any of the twenty indicators in a colored form, painting bulls and bears in different colors, for any financial instrument in accordance with the list below:  AD - an indicator of accumulation and distribution of volume. OBV - On Balance Volume. Force - Force Inde
AO Global
Igor Semyonov
Description A colored universal indicator AO (Awesome Oscillator). The rising and falling of the indicator histogram can be colored.   The indicator can be calculated as the standard one or as a derivative on the basis of the following eleven other indicators included in the standard package of the MetaTrader 4 terminal: AD - an indicator of accumulation and distribution of volume. OBV - On Balance Volume. Volume - tick volume indicator. Force - Force Index indicator. MFI - Money Flow Index. ATR
Description A colored universal indicator MACD Classic (MA convergence-divergence indicator) that combines two indicators: MACD Line and MACD Histo. The rising and falling lines, the signal line and the indicator histogram can be colored. The indicator can be calculated as the standard one on the basis of a price or as a derivative on the basis of the following twelve other indicators included in the standard package of the MetaTrader 4 terminal: AD - an indicator of accumulation and distributio
Description The universal colored multicurrency/multisymbol indicator MACD Classic, consisting of two MACD indicators: MACD Line and MACD Histo. The indicator may be used with any broker, irrespective of the name of the financial instrument since it is necessary to manually enter the name as an input parameter. If you enter a non-existent or incorrect name of a financial instrument, you will receive an error message that this financial instrument is unknown (does not exist). Inputs Currency_Nam
Description A colored universal indicator/oscillator based on crossing moving averages. The rising and falling lines of the indicator histogram can be colored. The combined use of the line and the histogram increases the level of the analysis when making a decision to open or close deals. The indicator can be calculated as the standard Price Oscillator or as a derivative on the basis of the following eleven other indicators included in the standard package of the MetaTrader 4 terminal: AD - an i
Description A universal colored multicurrency/multi-symbol indicator RAVI. Was proposed by T. Chand as a trend indicator. RAVI means Range Action Verification Index. The indicator may be used with any broker, irrespective of the name of the financial instrument since it is necessary to manually enter the name as an input parameter. If you enter a non-existent or incorrect name of a financial instrument, you will receive an error message that this financial instrument is unknown (does not exist).
Description A colored multicurrency/multisymbol oscillator of the market mood. The oscillator is designed for detecting the continuation or change of the market mood prior to its occurrence. An excellent example is the screenshots that show all the features of the oscillator. The oscillator may be used with any broker, irrespective of the name of the financial instrument since it is necessary to manually enter the name as an input parameter. If you enter a non-existent or incorrect name of a fin
Inside Bar
Igor Semyonov
Description The indicator determines the appearance of internal bars on the chart, and paints them in accordance with the bullish and/or bearish mood. The indicator can notify of the appearance of a formed internal bar by playing a beep, as well as display the time remaining until the end of the formation of the current bar in the format of <d:h:m:s, where: < means the current bar. d - days. h - hours. m - minutes. s - seconds. The bullish and bearish mood can be colored. Inputs Sound_Play - a
Reversal Bars
Igor Semyonov
Description The indicator determines the appearance of the bars that signal of a reversal of current local moods and plays a beep. It also paints these bars in accordance with the bullish and/or bearish priority. You can select the color for bullish and bearish moods. Inputs Sound_Play - a flag that allows the sound notification. Use Detection of the reversal bar can be a signal to perform appropriate trading activities.  The indicator can be used for manual or automated trading in an Expert A
Description The indicator determines the appearance of bars that notify of the reversal of the current trend, and paints them in accordance with the bullish and/or bearish mood. The indicator can notify of the appearance of a formed reversal bar by playing a beep, as well as display the time remaining until the end of the formation of the current bar in the format of <d:h:m:s, where: < means the current bar. d - days. h - hours. m - minutes. s - seconds. You can select the color for bullish and
Description A universal colored multicurrency/multi-symbol indicator of moving averages: Moving Average, Double Moving Average, Triple Moving Average . The indicator is drawn in a separate window, so below the main trading chart a user can see the development of another financial instrument. It is very useful when considering the combined values of various moving averages for different financial instruments below the main trading chart.  The indicator may be used with any broker, irrespective of
Description A universal colored indicator of moving averages: Moving Average, Double Moving Average, Triple Moving Average . The indicator provides various opportunities for the analysis of prices based on different ways of constructing moving averages in the window of the main financial instrument. You can color bullish and bearish moods. Inputs MA_Type - type of multiplicity: Moving Average. Double Moving Average. Triple Moving Average. MA_Period - the MA period. MA_Method - the averaging met
Description A colored universal multicurrency/multi-symbol indicator Bollinger Bands to be drawn in a separate window below the main financial instrument. The rising and falling line of the main indicator and Bollinger Bands can be colored. The indicator can be calculated based on one of the eleven basic indicators included in the standard package of the MetaTrader 4 terminal: AD - an indicator of accumulation and distribution of volume. OBV - On Balance Volume. Force - Force Index indicator. MF
Description A colored universal multicurrency/multi-symbol indicator Channel to be drawn in a separate window below the main financial instrument. The indicator uses the calculation method of the Price Channel indicator. The rising and falling line of the main indicator and the Channel lines can be colored. The indicator can be calculated based on one of the eleven basic indicators included in the standard package of the MetaTrader 4 terminal: AD - an indicator of accumulation and distribution o
Keltner Channel
Igor Semyonov
5 (1)
Description Keltner's colored channel indicator,also called STARC band, drawn in the main chart window. The indicator uses the calculation technique of the three drawing options: basic, improved and modified . The first two were proposed by Keltner, the third one - by a successful trader L. Rakshe. You can also search for your own best parameters of the indicator. The upper, middle and lower bands can be colored. The indicator includes the basic analytical tool of the market moods by Keltner. Th
ZigZag Global
Igor Semyonov
Description A colored universal multicurrency/multi-symbol indicator ZigZag to be drawn in a separate window below the main financial instrument. The indicator may be used with any broker, irrespective of the name of the financial instrument since it is necessary to manually enter the name as an input parameter. If you enter a non-existent or incorrect name of a financial instrument, you will receive an error message that this financial instrument is unknown (does not exist).  The indicator can
Description A colored channel indicator Price Channel to be drawn on the main chart of a financial symbol. It can color bullish and bearish moods based on the middle line of the indicator, as well as change the color of the upper and lower lines of the channel. Purpose The indicator can be used for manual or automated trading in an Expert Advisor. Values of indicator buffer of the double type can be used for automated trading:  The middle line of the indicator - buffer 4. The upper line of the
Description Candlesticks is a colored multicurrency/multy-symbol indicator. It shows a financial instrument as a candlestick chart in a separate window below the chart of the main financial symbo. The indicator may be used with any broker, irrespective of the name of the financial instrument since it is necessary to manually enter the name as an input parameter. If you enter a non-existent or incorrect name of a financial instrument, you will receive an error message that this financial instrume
Description Candlestick Tools  is a colored multicurrency/multy-symbol indicator. It shows one of four standard indicators as a candlestick chart in a separate window below the chart of the main financial symbol. The indicator is calculated based on one of two indicators included in the standard package of the МetaТrader 4 terminal: CCI - Commodity Channel Index. RSI - Relative Strength Index. The default indicator is Commodity Channel Index. The indicator may be used with any broker, irrespecti
Pivot Pro
Igor Semyonov
Description Pivot Pro  is a universal color indicator of the  Pivot Points  levels systems. You can select one of its three versions:  Standard   Old , Standard New  and  Fibo . The system will automatically calculate the  Pivot Point  on the basis of market data for the previous day ( PERIOD_D1 ) and the system of support and resistance levels, three in each. It can also display price tags for each level. You can color the indicator lines. Only a method of calculation of the third level of supp
Price Levels
Igor Semyonov
Description The indicator is intended for labeling the chart using horizontal levels and/or half-round prices. The indicator works on any financial instrument regardless of the name and the number of digits. A user can choose colors for the indicator lines. Input Parameters Calc_Method - method of calculation of the lines: levels of round prices. levels of half-round prices. Digits_Accepted - flag for calculating the levels according to number of decimal places in the quotes of a financial inst
Description A colored universal multicurrency/multi-symbol indicator MACD Line Smart (the indicator moving average convergence divergence is displayed as a histogram) based on double or triple moving average .  Comparing to the standard MACD this indicator is more sensitive to what allows generating advance signals. he indicator may be used with any broker, irrespective of the name of the financial instrument since it is necessary to manually enter the name as an input parameter. If you enter a
필터:
리뷰 없음
리뷰 답변