MA cross Alert MT5
- 지표
- 버전: 1.3
- 업데이트됨: 18 5월 2021
- 활성화: 20

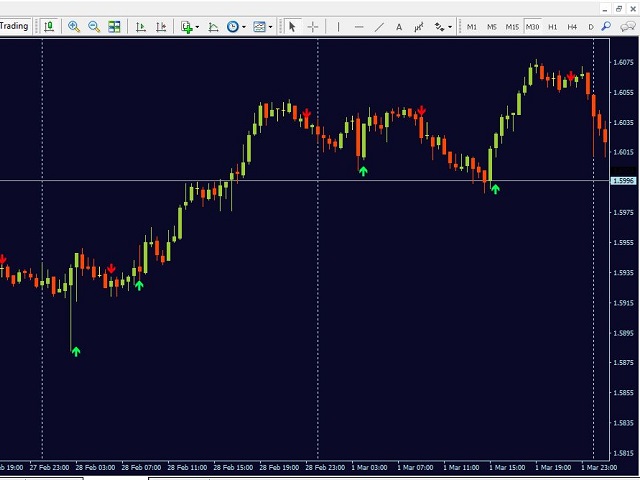
MA cross ALERT MT5
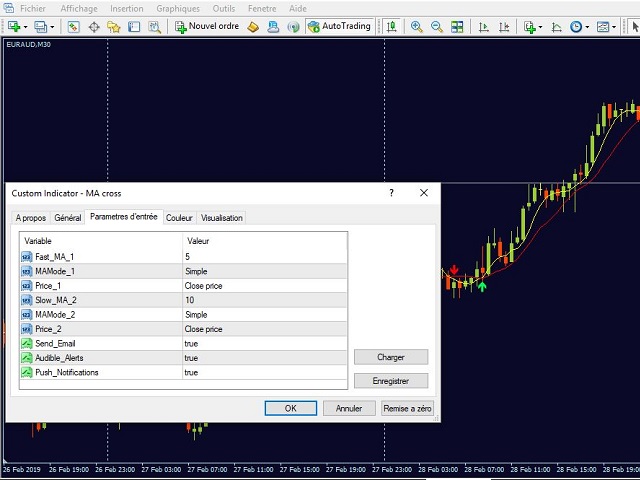
This indicator is a full 2 moving averages cross Alert ( email and push notification "mobile"), 2 MA with full control of MA method and applied price for each moving average "slow and fast",
-simple, exponential, smoothed, linear weighted.
-close, open, high, low, median price, typical price, weighted price.
you can modify periods as well for both MA.
For any suggestions don't hesitate, thanks


Good day. The indicator works well, but one important function is missing, namely, that the push notifications on the phone would display on which time frame the signal triggered, since it is convenient to work with this indicator on one pair in 4 time frames. In general, it was a request to you, dear developer, if you have time, please make this function. And thank you in advance! English at google level, sorry)