• 미리보기
  • 리뷰
  • 코멘트

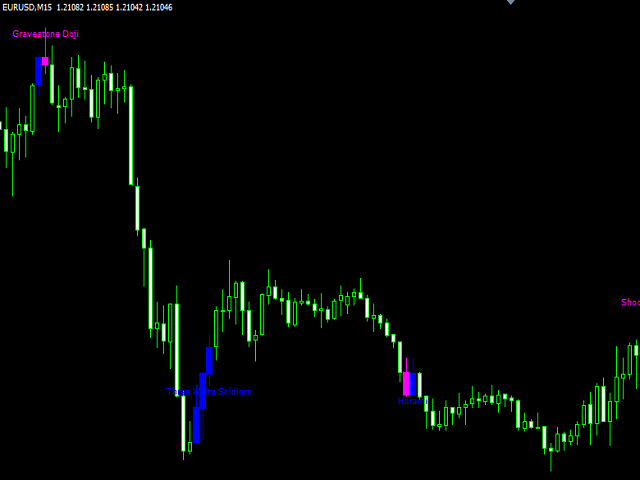
Candlestick Pattern System

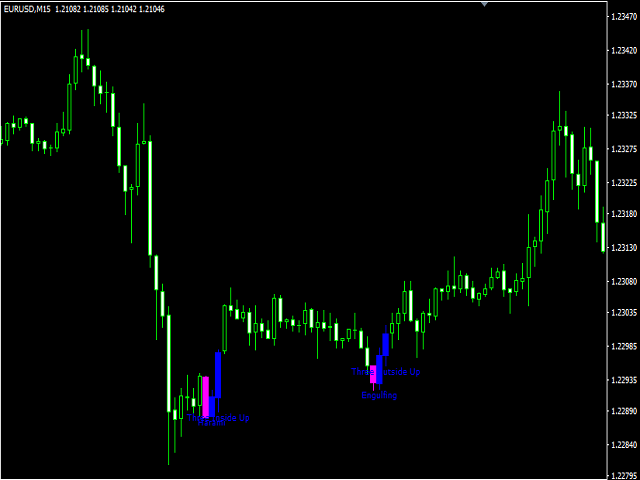
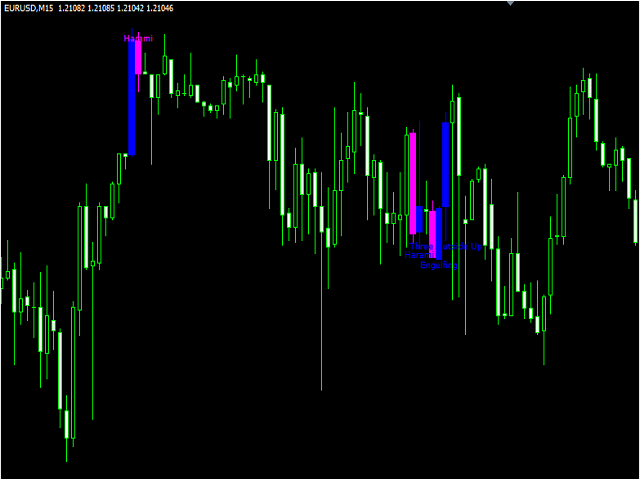
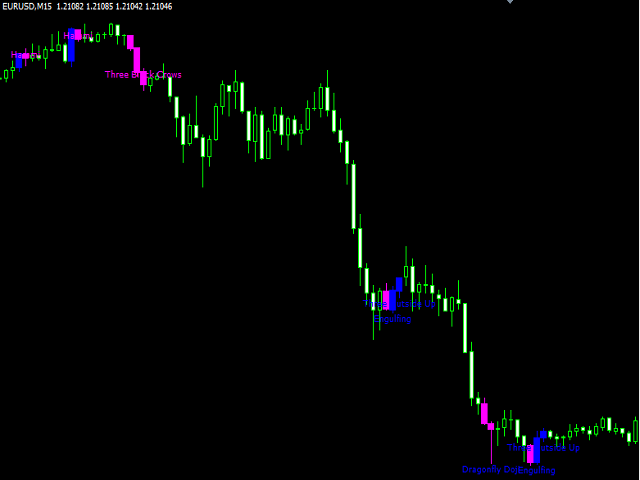
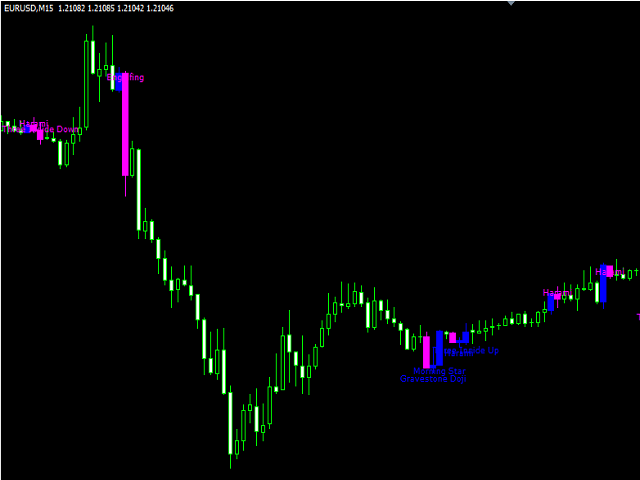
Candlestick pattern system finds 40 candle formations.

Features

  • Has the feature to send the notification.
  • It has candlestick patterns feature.
  • Bullish patterns feature.
  • Bearish patterns feature.
  • Trend filter and reliability features.


Parameters

  • Show alert - Send alert
  • Send email - Send alerts to mail address.
  • Look back - Retrospective calculation
  • ===PATTERN SETUP===
  • Show bullish patterns - Open close feature
  • Show bearish patterns - Open close feature
  • Trend filter - Open close feature
  • Reliability - Open close feature
  • Show candlestick patterns - Open close feature
  • ===BEARISH CONTINUATION===
  • Falling three methods - Open close feature
  • Bearish three line strike - Open close feature
  • Bearish mat hold - Open close feature
  • ===BEARISH REVERSAL===
  • Evening star - Open close feature
  • Dark could cover - Open close feature
  • Abandoned baby top - Open close feature
  • Three inside down - Open close feature
  • Three outside down - Open close feature
  • Three black crows - Open close feature
  • Upside gap two crows - Open close feature
  • Bearish engulfing - Open close feature
  • Dragonfly Doji top - Open close feature
  • Gravestone Doji top - Open close feature
  • Doji star top - Open close feature
  • Bearish harami cross - Open close feature
  • Advance block - Open close feature
  • Two cross - Open close feature
  • Bearish breakaway - Open close feature
  • Shooting star - Open close feature
  • Hanging man - Open close feature
  • ===BULLISH CONTINUATION===
  • Rising three methods - Open close feature
  • Bullish three line strike - Open close feature
  • Bullish mat hold - Open close feature
  • ===BULLİSH REVERSAL===
  • Morningstar - Open close feature
  • Piercing line - Open close feature
  • Abandoned baby bottom - Open close feature
  • Three inside up - Open close feature
  • Three outside up - Open close feature
  • Three white soldiers - Open close feature
  • Concealing baby swallow - Open close feature
  • Bullish engulfing - Open close feature
  • Dragonfly Doji bottom - Open close feature
  • Gravestone Doji bottom - Open close feature
  • D‌oji star bottom - Open close feature
  • Bullish harami cross - Open close feature
  • Three stars in the south - Open close feature
  • Bullish breakaway - Open close feature
  • Bullish harami - Open close feature
  • Hammer - Open close feature
  • Inverted hammer - Open close feature


추천 제품
Pro Trend Tracking   indicator is designed for trend and signal trading. This indicator generates trend signals.  It uses many algorithms and indicators to generate this signal. It tries to generate a signal from the points with the highest trend potential. This indicator is a complete trading product. This indicator does not need any additional indicators.  You can only trade with this indicator. The generated signals are displayed on the graphical screen.  Thanks to the alert features you can
MT4용 외환 지표 "슈팅 스타 패턴" 지표 "슈팅 스타 패턴"은 가격 행동 거래에 대한 매우 강력한 지표입니다. 다시 칠하지 않고 지연도 없습니다. 지표가 차트에서 약세 슈팅 스타 패턴을 감지합니다. 차트의 빨간색 화살표 신호(그림 참조) PC, 모바일 및 이메일 알림이 포함되어 있습니다. 표시기 "슈팅 스타 패턴"은 지원/저항 수준과 결합하는 데 탁월합니다: https://www.mql5.com/en/market/product/100903 // 더 훌륭한 전문가 자문 및 지표는 여기에서 확인할 수 있습니다: https://www.mql5.com/en/users/def1380/seller // 또한 수익성 있고 안정적이며 신뢰할 수 있는 신호 https://www.mql5.com/en/signals/1887493에 참여하실 수 있습니다. 본 MQL5 홈페이지에서만 제공되는 오리지널 제품입니다.
Smart trends
Yvan Musatov
Smart indicator Smart trend allows you to find the most likely trend reversal points. You will not find this indicator anywhere else. A simple but effective system for determining the forex trend. From the screenshots you can see for yourself the accuracy of this tool. Works on all currency pairs, stocks, raw materials, cryptocurrencies. This is a trend indicator for the MetaTrader 4 trading platform. The alert system (alert, email notifications) will help you monitor several trading instrume
PipFinite Exit EDGE
Karlo Wilson Vendiola
4.89 (160)
Did You Have A Profitable Trade But Suddenly Reversed? In a solid strategy, exiting a trade is equally important as entering. Exit EDGE helps maximize your current trade profit and avoid turning winning trades to losers. Never Miss An Exit Signal Again Monitor all pairs and timeframes in just 1 chart www.mql5.com/en/blogs/post/726558 How To Trade You can close your open trades as soon as you receive a signal Close your Buy orders if you receive an Exit Buy Signal. Close your Sell orde
MetaCOT 2 is a set of indicators and specialized utilities for the analysis of the U.S. Commodity Futures Trading Commission reports. Thanks to the reports issued by the Commission, it is possible to analyze the size and direction of the positions of the major market participants, which brings the long-term price prediction accuracy to a new higher-quality level, inaccessible to most traders. These indicators, related to the fundamental analysis, can also be used as an effective long-term filter
Trade Trend
Harun Celik
5 (1)
Trade Trend indicator is an oscillator designed to calculate trend reversal points. A set of bar calculations and a set of algorithms to calculate trend reversals. Level probing system with high probability trends. All of these features combine to make it easier for investors to find trends. Suggestions and Features There are two levels on the Trade Trend indicator. They are at levels of upper level and lower level. The oscillator bar should be below lower level to find the upward trend. And a
This indicator depends on High and Low price of Currency in last Week and then i made some secret equations to draw 10 lines. Features: You will know what exactly price you should enter the market . You will know when to be out of market. You will know you what should you do in market: Buy Sell Take profit and there are 3 levels to take your profit Support Resistance Risk to buy Risk to Sell Signal Types and Frame used: You can use this indicator just on H4 frame and you have to download the
Diamond Pattern
Ugur Oezcan
5 (1)
The diamond top and bottom are reversal patterns. It represents a rally to a new high with a drop to a support level followed by a rally to make a new high and a quick decline, breaking the support level to make a higher low. The bounce from the higher low is then followed by a rally, but making a lower high instead. Once this behavior is identified, prices then break the trend line connecting the first and second lows and start to decline further. You can find MT5 version hier Indicator shows
Owl smart levels
Sergey Ermolov
4.63 (54)
MT5 버전  |   FAQ Owl Smart Levels Indicator 는   Bill Williams 의 고급 프랙탈, 시장의 올바른 파동 구조를 구축하는 Valable ZigZag, 정확한 진입 수준을 표시하는 피보나치 수준과 같은 인기 있는 시장 분석 도구를 포함하는 하나의 지표 내에서 완전한 거래 시스템입니다. 시장과 이익을 취하는 장소로. 전략에 대한 자세한 설명 표시기 작업에 대한 지침 고문-거래 올빼미 도우미의 조수 개인 사용자 채팅 ->구입 후 나에게 쓰기,나는 개인 채팅에 당신을 추가하고 거기에 모든 보너스를 다운로드 할 수 있습니다 힘은 단순함에 있습니다! Owl Smart Levels   거래 시스템은 사용하기 매우 쉽기 때문에 전문가와 이제 막 시장을 연구하고 스스로 거래 전략을 선택하기 시작한 사람들 모두에게 적합합니다. 전략 및 지표에는 눈에 보이지 않는 비밀 공식 및 계산 방법이 없으며 모든 전략 지표는 공개되어 있습니다. Owl Smart Lev
Fibonacci retracement and extension line drawing tool Fibonacci retracement and extended line drawing tool for MT4 platform is suitable for traders who use  golden section trading Advantages: There is no extra line, no too long line, and it is easy to observe and find trading opportunities Trial version: https://www.mql5.com/zh/market/product/35884 Main functions: 1. Multiple groups of Fibonacci turns can be drawn directly, and the relationship between important turning points
Real Magic Trend
Muhammed Emin Ugur
This   Real Magic Trend   indicator is designed for signal trading. This indicator generates trend signals. It uses many algorithms and indicators to generate this signal. It tries to generate signals from the points with the highest trend potential. This indicator is a complete trading product. This indicator does not need any additional indicators. The indicator is never repainted. The point at which the signal is given does not change.      Features and Recommendations Time Frame
Multi Divergence Indicator for MT4 - User Guide Introduction Overview of the Multi Divergence Indicator and its capabilities in identifying divergences across multiple indicators. Importance of divergence detection in enhancing trading strategies and decision-making. List of Indicators RSI CCI MACD STOCHASTIC AWSOME MFI ACCELERATOR OSMA MOMENTUM WPR( Williams %R) RVI Indicator Features Indicator Selection: How to enable/disable specific indicators (RSI, CCI, MACD, etc.) for divergence detection.
Dugum Trader
Jabir Ismaeili
Düğüm Trader는 R&D 팀의 점진적 가격 조치 방법을 기반으로 개발되고 개발된 진입 구역 감지기 및 거래 제안 지표입니다. 이 도구는 거래자가 잠재적인 지원 및 저항 구역으로 범위 영역을 더 깊이 볼 수 있도록 도와줍니다. 표시기에는 고밀도 보류 주문 영역을 진입 구역으로 찾고 가격 조치 규칙을 통해 필터링하는 특수 계산이 있습니다. 새로운 Entry Zone 생성 후 "Entry" 태그가 있는 녹색 라인으로 확인을 기다립니다. 이 확인 후 영역 분할 측면(위에서 또는 아래로) 표시기를 기반으로 주문 유형을 결정합니다. 가격이 진입 가격으로 돌아오면 주문은 시장 거래로 간주되며 거래 수명을 명확하게 표시하기 위해 SL 직사각형이 그려집니다. 가격이 거래를 대신하여 움직이면 SL 직사각형의 색상이 녹색이 ​​되고 그 반대의 경우 빨간색이 됩니다. 이익 포인트가 SL 포인트와 같거나 클 때 거래는 수익성 있는 주문이 될 것입니다. 즉, 지표는 RR이 최소 1:1일 때
Cosmic Diviner X Planet
Olena Kondratenko
4 (2)
This unique multi-currency strategy simultaneously determines the strength of trends and market entry points, visualizing this using histograms on the chart. The indicator is optimally adapted for trading on the timeframes М5, М15, М30, Н1. For the convenience of users, the indicator renders the entry point (in the form of an arrow), recommended take profit levels (TP1, TP2 with text labels) and the recommended Stop Loss level. The take profit levels (TP1, TP2) are automatically calculated for
Mirror
Stanislav Korotky
This indicator predicts rate changes based on the chart display principle. It uses the idea that the price fluctuations consist of "action" and "reaction" phases, and the "reaction" is comparable and similar to the "action", so mirroring can be used to predict it. The indicator has three parameters: predict - the number of bars for prediction (24 by default); depth - the number of past bars that will be used as mirror points; for all depth mirroring points an MA is calculated and drawn on the ch
Identify Pinbar Candle Pattern with Arrows & Alert (built-in RSI filter). This indicator helps you to identify Pin bar Candlestick Pattern (or shooting star & hammer pattern) on the chart with arrows, along with an alert when a new Pin bar appears. Pin bar pattern is one of the most important reversal Price Action signals. You can set Minimum Percent of Wick (or Tail) Length over full bar length (Recommended: 60%, 70%, 75%). Alerts can be turned on and off: Popup Email Push Notification S
Line Magnit
Aleksey Trenin
The LineMagnit Indicator for MT4 is a highly precise tool that builds support and resistance levels which magnetically attract prices. This feature allows traders to easily determine the most probable entry and exit points in the market, as well as identify the market's directional forces, as levels are based on capital inflows into the instrument. Equipped with an intuitively understandable graphical interface, the LineMagnit Indicator enables users to quickly locate and analyze support and res
Forex Gump Trend
Andrey Kozak
5 (1)
Forex Gump Trend is a universal indicator for highly effective determination of the trend direction. If you identify the trend correctly, this is 95% of trading success, because you will be able to open trades in the direction of the price movement and benefit from it. The Forex Gump Trend indicator helps traders with a high degree of efficiency to determine the current trend direction, as well as trend reversal points. The direction of the trend is shown by colored lines on the chart, and the
The Th3Eng PipFinite indicator is based on a very excellent analysis of the right trend direction with perfect custom algorithms. It show the true direction and the best point to start trading. With StopLoss point and Three Take Profit points. Also it show the right pivot of the price and small points to order to replace the dynamic support and resistance channel, Which surrounds the price. And Finally it draws a very helpful Box on the left side on the chart includes (take profits and Stop loss
Gioteen Volatility Index (GVI)   - your ultimate solution to overcoming market unpredictability and maximizing trading opportunities. This revolutionary indicator helps you in lowering your losing trades due to choppy market movements. The GVI is designed to measure market volatility, providing you with valuable insights to identify the most favorable trading prospects. Its intuitive interface consists of a dynamic red line representing the volatility index, accompanied by blue line that indicat
DF Signal AM
Andriy Matviyevs'kyy
DF Signal AM - this is an indicator that marks on the chart the moments when the price direction changes. The indicator uses adaptive digital filters for analysis. Digital filters are (simplified) a way to smooth data. Unlike traditional moving averages, a digital filter will be more effective in most cases. The indicator does not redraw, the signal is generated after the candle is completed. It is optimal to use the indicator signals as signals to open a trade when the price overcomes the maxim
FREE
Buy and sell zones
Evgeniy Zhdan
5 (3)
평면 및 추세를 결정하기 위한 표시기. 가격이 2개의 히스토그램과 2개의 선(빨간색 및 파란색) 중 하나보다 낮으면 판매 영역입니다. 이 버전의 표시기를 구매할 때 하나의 실제 계정과 하나의 데모 계정에 대한 MT4 버전 - 선물로(수신하려면 개인 메시지를 작성하세요)! 가격이 2개의 히스토그램과 2개의 선(빨간색 및 파란색) 중 하나보다 높으면 구매 영역입니다. MT4 버전:   https://www.mql5.com/en/market/product/3793 가격이 두 라인 사이 또는 히스토그램 영역에 있으면 시장에 명확한 추세가 없습니다. 간단히 말해서 시장은 평평합니다. 표시기의 작업은 스크린샷에 더 명확하게 표시됩니다. 지표는 선행 데이터를 얻는 데 사용할 수 있습니다. 또는 현재 추세의 상태를 확인합니다.
Market Trend Catcher
Alexander Fedosov
Market Trend Catcher indicator analyzes the duration of trend movements and, with a certain development of the current trend, offers market entry points in the form of arrows with recommended profit targets. The indicator is very easy to use and does not require a lot of information to understand how it works. It has a minimum of settings and is transparent in understanding the principle of its operation, fully displaying the information on the basis of which it makes decisions on recommending e
Super signal series magic arrows is an indicator that generates trade arrows. It generates trade arrows with its own algorithm. These arrows give buying and selling signals. The indicator certainly does not repaint. Can be used in all pairs. Sends a signal to the user with the alert feature. Trade rules Enter the signal when the buy signal arrives. In order to exit from the transaction, an opposite signal must be received. It is absolutely necessary to close the operation when an opposite sign
Top Bottom Tracker MT4
Rodrigo Arana Garcia
탑 바텀 트래커는 시장 추세를 분석하고 추세의 고점과 저점을 감지할 수 있는 정교한 알고리즘을 기반으로 하는 지표입니다 / MT5 버전 . 가격은 500$에 도달할 때까지 점진적으로 상승합니다. 다음 가격 --> $99 특징 다시 칠하지 않음 이 표시기는 새 데이터가 도착해도 값을 변경하지 않습니다 거래 쌍 모든 외환 쌍 기간 모든 기간 파라미터 ==== 인디케이터 구성 ==== 구성 매개 변수 // 40 (값이 높을수록 신호가 적지만 더 정확한 신호가 제공됩니다) 상위 레벨 값 // 80 (상단 수평선의 값) 하단 레벨 값 // 20 (하단 수평선 값) 인디케이터 계산 막대 수 // 3000 (인디케이터를 계산할 막대 수). 값 0은 모든 막대에 대해 인디케이터를 계산합니다) ==== 알람 구성 ==== 팝업 알림 // 참(터미널에서 알람) 이메일 알림 // 참(이메일로 알람 전송) 알람 시간 간격 // 10
True SnD
Indra Lukmana
5 (1)
This Supply & Demand indicator uses a unique price action detection to calculate and measures the supply & demand area. The indicator will ensure the area are fresh and have a significant low risk zone. Our Supply Demand indicator delivers functionality previously unavailable on any trading platform. Trading idea You may set pending orders along the supply & demand area. You may enter a trade directly upon price hit the specific area (after a rejection confirmed). Input parameters Signal - S
Elliots Triangle
Stephen Reynolds
Elliot's Triangle is taken from 1 of the 13 patterns within the Elliot Wave Theory that says social or crowd behaviour tends to reverse in recognisable patterns and of which they reveal a structural pattern that appears in nature, as well as the mass psychology of trading participants. From this, he has devised various identifiable patterns that appear in market prices. One of these is what I have named Elliot's Triangle. This triangular pattern appears to reflect a balance of forces, causing
Blahtech Market Profile
Blahtech Limited
4.61 (18)
Was: $249  Now: $99   Market Profile defines a number of day types that can help the trader to determine market behaviour. A key feature is the Value Area, representing the range of price action where 70% of trading took place. Understanding the Value Area can give traders valuable insight into market direction and establish the higher odds trade. It is an excellent addition to any system you may be using. Blahtech Limited presents their Market Profile indicator for the MetaTrader community. Ins
The Discrete wavelet transform indicator is an enhanced implementation of the numerical and functional analysis for MetaTrader 4, the discrete wavelet transform method (DWT). The specific feature of DWT is the way the wavelet is represented in the form of a discrete signal (sample). DWT is widely used for filtering and preliminary processing of data, for analyzing the state and making forecasts for the stock and currency markets, for recognizing patterns, processing and synthesizing various sign
PatternMMB
Mikhail Bilan
The PatternMMB trading indicator finds the most common candlestick analysis patterns and provides trading recommendations based on them. The PatternMMB trading indicator is designed to search for candlestick patterns on the price chart and issue trading recommendations depending on the nature of the found candlestick pattern. It is also possible to send sound notifications when all or any of the selected patterns appear, with an explanation of the pattern and its interpretation. In addition, th
이 제품의 구매자들이 또한 구매함
Gann Made Easy
Oleg Rodin
4.96 (47)
Gann Made Easy 는 mr.의 이론을 사용하여 최고의 거래 원칙을 기반으로 하는 전문적이고 사용하기 쉬운 Forex 거래 시스템입니다. W.D. 간. 이 표시기는 Stop Loss 및 Take Profit Levels를 포함하여 정확한 BUY 및 SELL 신호를 제공합니다. PUSH 알림을 사용하여 이동 중에도 거래할 수 있습니다. 구매 후 연락주세요! 내 거래 팁과 훌륭한 보너스 지표를 무료로 공유하겠습니다! 아마도 Gann 거래 방법에 대해 이미 여러 번 들었을 것입니다. 일반적으로 Gann의 이론은 초보자 거래자뿐만 아니라 이미 거래 경험이 있는 사람들에게도 매우 복잡한 것입니다. Gann의 거래 방식은 이론적으로 적용하기 쉽지 않기 때문입니다. 나는 그 지식을 연마하고 Forex 지표에 최고의 원칙을 적용하기 위해 몇 년을 보냈습니다. 표시기는 적용하기가 매우 쉽습니다. 차트에 첨부하고 간단한 거래 권장 사항을 따르기만 하면 됩니다. 지표는 지속적으로 시장 분석 작업
Atomic Analyst
Issam Kassas
5 (2)
우선적으로 언급할 점은이 거래 지표가 다시 그리지 않고 지연되지 않으며 이를 통해 수동 및 로봇 거래 모두에 이상적이라는 점입니다. Atomic Analyst는 가격의 강도와 모멘텀을 활용하여 시장에서 더 나은 이점을 찾는 PA Price Action Indicator입니다. 고급 필터를 장착하여 잡음과 거짓 신호를 제거하고 거래 잠재력을 높이는 데 도움이 됩니다. 복잡한 지표의 다중 레이어를 사용하여 Atomic Analyst는 차트를 스캔하고 복잡한 수학적 계산을 간단한 신호와 색상으로 변환하여 초보 트레이더가 이해하고 일관된 거래 결정을 내릴 수 있도록합니다. "Atomic Analyst"는 새로운 및 경험이 풍부한 트레이더를위한 종합적인 거래 솔루션입니다. 프리미엄 지표와 최고 수준의 기능을 하나의 거래 전략에 결합하여 모든 종류의 트레이더에 대한 다재다능한 선택지가되었습니다. 인트라데이 거래 및 스캘핑 전략 : 빠르고 정확한 일일 거래 및 단기 거래를 위해 설계
TPSproTREND PrO
Roman Podpora
5 (15)
TPSpro TRENDPRO  - is a trend indicator that automatically analyzes the market and provides information about the trend and each of its changes, as well as giving signals for entering trades without redrawing! The indicator uses each candle, analyzing them separately. referring to different impulses - up or down impulse. Exact entry points into transactions for currencies, crypto, metals, stocks, indices!  -  Version MT5               DETAILED DESCRIPTION        /       TRADING SETUPS           
Advanced Currency Strength28 Indicator
Bernhard Schweigert
4.9 (663)
현재 26% 할인 초보자 또는 전문가 트레이더를 위한 최고의 솔루션! 이 지표는 우리가 독점 기능과 새로운 공식을 통합했기 때문에 독특하고 고품질이며 저렴한 거래 도구입니다. 단 하나의 차트로 28 Forex 쌍의 통화 강도를 읽을 수 있습니다! 새로운 추세 또는 스캘핑 기회의 정확한 트리거 포인트를 정확히 찾아낼 수 있기 때문에 거래가 어떻게 개선될지 상상해 보십시오. 사용 설명서: 여기를 클릭  https://www.mql5.com/en/blogs/post/697384 그것이 첫 번째, 원본입니다! 쓸모없는 지망생 클론을 사지 마십시오. 더 스페셜  강력한 통화 모멘텀을 보여주는 하위 창의 화살표 GAP가 거래를 안내합니다! 기본 또는 호가 통화가 과매도/과매도 영역(외부 시장 피보나치 수준)에 있을 때 개별 차트의 기본 창에 경고 표시가 나타납니다. 통화 강도가 외부 범위에서 떨어질 때 풀백/반전 경고. 교차 패턴의 특별 경고 추세를 빠르게 볼 수 있는
Scalper Vault
Oleg Rodin
5 (27)
Scalper Vault 는 성공적인 스캘핑에 필요한 모든 것을 제공하는 전문 스캘핑 시스템입니다. 이 표시기는 외환 및 바이너리 옵션 거래자가 사용할 수 있는 완전한 거래 시스템입니다. 권장 시간 프레임은 M5입니다. 시스템은 추세 방향으로 정확한 화살표 신호를 제공합니다. 또한 상단 및 하단 신호와 Gann 시장 수준을 제공합니다.  이 시스템은 사용하기가 매우 쉽습니다. 원하는 시장 지역의 화살표만 따라가면 됩니다. 엑시트는 가격이 적정 수준에 도달하거나 시장의 고점 또는 저점 신호가 나타날 때 수행됩니다.  표시기는 PUSH 알림을 포함한 모든 유형의 경고를 제공합니다. 인디케이터 구매 후 연락주세요. 내 개인 거래 권장 사항과 훌륭한 보너스 지표를 무료로 공유합니다! 나는 당신에게 행복하고 유익한 거래를 기원합니다!
현재 20% 할인 ! 초보자 또는 전문가 트레이더를 위한 최고의 솔루션! 이 대시보드 소프트웨어는 28개의 통화 쌍에서 작동합니다. 2가지 주요 지표(Advanced Currency Strength 28 및 Advanced Currency Impulse)를 기반으로 합니다. 전체 Forex 시장에 대한 훌륭한 개요를 제공합니다. 고급 통화 강도 값, 통화 이동 속도 및 모든(9) 시간대의 28 Forex 쌍에 대한 신호를 보여줍니다. 추세 및/또는 스캘핑 기회를 정확히 파악하기 위해 차트의 단일 지표를 사용하여 전체 시장을 볼 수 있을 때 거래가 어떻게 개선될지 상상해 보십시오! 잠재적인 거래를 식별하고 확인하면서 강력한 통화와 약한 통화를 더욱 쉽게 식별할 수 있도록 이 지표에 기능을 내장했습니다. 이 표시기는 통화의 강세 또는 약세가 증가 또는 감소하는지 여부와 모든 시간대에서 수행되는 방식을 그래픽으로 보여줍니다. 추가된 새로운 기능은 현재 시장 조건 변화에 적
Scalper Inside PRO
Alexey Minkov
4.75 (55)
SALE NOW! Limited Time Offer! An exclusive indicator that utilizes an innovative algorithm to swiftly and accurately determine the market trend. The indicator automatically calculates opening, closing, and profit levels, providing detailed trading statistics. With these features, you can choose the most appropriate trading instrument for the current market conditions. Additionally, you can easily integrate your own arrow indicators into Scalper Inside Pro to quickly evaluate their statistics and
Quantum Trend Sniper Indicator MT4
Bogdan Ion Puscasu
4.59 (39)
소개       Quantum Trend Sniper Indicator는   추세 반전을 식별하고 거래하는 방식을 변화시키는 획기적인 MQL5 지표입니다! 13년 이상의 거래 경험을 가진 숙련된 트레이더 팀이 개발한       Quantum Trend Sniper 표시기       매우 높은 정확도로 추세 반전을 식별하는 혁신적인 방법으로 거래 여정을 새로운 차원으로 끌어올리도록 설계되었습니다. ***Quantum Trend Sniper Indicator를 구입하면 Quantum Breakout Indicator를 무료로 받을 수 있습니다!*** Quantum Trend Sniper Indicator는 추세 반전을 식별하고 세 가지 이익실현 수준을 제안할 때 경고, 신호 화살표를 제공합니다. 초보자 거래자와 전문 거래자 모두에게 적합합니다. Quantum EA 채널:       여기를 클릭하세요 MT5 버전:       여기를 클릭하세요
TPSpro RFI Levels
Roman Podpora
5 (13)
A key element in trading is zones or levels from which decisions to buy or sell a trading instrument are made. Despite attempts by major players to conceal their presence in the market, they inevitably leave traces. Our task was to learn how to identify these traces and interpret them correctly. Reversal First Impulse levels (RFI)   -  Version MT5                INSTRUCTIONS                 RUS                 ENG                                       R ecommended to use with an indicator   -  
Quantum Breakout Indicator PRO
Bogdan Ion Puscasu
4.96 (26)
소개       Quantum Breakout PRO   , 브레이크아웃 존 거래 방식을 변화시키는 획기적인 MQL5 지표! 13년 이상의 거래 경험을 가진 숙련된 트레이더 팀이 개발한   Quantum Breakout PRO는   혁신적이고 역동적인 브레이크아웃 영역 전략으로 거래 여정을 새로운 차원으로 끌어올리도록 설계되었습니다. Quantum Breakout Indicator는 5개의 이익 목표 영역이 있는 브레이크아웃 영역의 신호 화살표와 브레이크아웃 상자를 기반으로 한 손절 제안을 제공합니다. 초보자 거래자와 전문 거래자 모두에게 적합합니다. Quantum EA 채널:       여기를 클릭하세요 MT5 버전 :   여기를 클릭하세요 중요한! 구매 후 설치 매뉴얼을 받으려면 개인 메시지를 보내주십시오. 추천: 기간: M15 통화쌍: GBPJPY, EURJPY, USDJPY,NZDUSD, XAUUSD 계정 유형: 스프레드가 매우 낮은 ECN, Ra
FX Volume
Daniel Stein
4.6 (35)
모닝 브리핑을 통해 세부 정보와 스크린샷으로 매일 시장 업데이트를 받으세요 여기 mql5 및 텔레그램에서 FX 거래량은 브로커의 관점에서 시장 심리에 대한 실제 통찰력을 제공하는 최초이자 유일한 거래량 지표입니다. 브로커와 같은 기관 시장 참여자가 외환 시장에서 어떤 포지션을 취하고 있는지에 대한 훌륭한 통찰력을 COT 보고서보다 훨씬 빠르게 제공합니다. 차트에서 이 정보를 직접 확인하는 것은 트레이딩의 진정한 판도를 바꾸고 획기적인 솔루션입니다. 다음과 같은 고유한 시장 데이터 인사이트의 이점 비율 는 통화의 매수/매도 포지션 비율을 백분율로 표시 비율 변화 는 선택한 기간 내 매수 비율과 비율 변화를 표시 총 거래량 는 해당 통화의 총 거래량(롱 및 숏)을 로트 단위로 보여줍니다 Volumes Long 는 해당 통화의 모든 롱 포지션의 거래량을 보여줍니다 Volumes Short 는 해당 통화의 모든 숏 포지션의 거래량을 보여줍니다 Net Long 는 순 롱 포지션의 거래량
FX Power MT4 NG
Daniel Stein
5 (8)
모닝 브리핑 여기 mql5 와 텔레그램에서 FX Power MT4 NG 는 오랫동안 인기 있는 통화 강도 측정기인 FX Power의 차세대 버전입니다. 이 차세대 강도 측정기는 무엇을 제공합니까? 기존 FX Power에서 좋아했던 모든 것 PLUS GOLD/XAU 강도 분석 더욱 정밀한 계산 결과 개별 구성 가능한 분석 기간 더 나은 성능을 위한 사용자 정의 가능한 계산 한도 특별 멀티더 많은 것을보고 싶은 사람들을위한 특별한 다중 인스턴스 설정 모든 차트에서 좋아하는 색상을위한 끝없는 그래픽 설정 수많은 알림 옵션, 중요한 것을 다시는 놓치지 않도록 Windows 11 및 macOS 스타일의 둥근 모서리가 있는 새로운 디자인 마법처럼 움직이는 인디케이터 패널 FX 파워 키 특징 모든 주요 통화의 완전한 강세 이력 모든 시간대에 걸친 통화 강세 이력 모든 브로커 및 차트에서 고유 계산 결과 100% 신뢰할 수있는 실시간100 % 신뢰할 수있는 실시간 계산-> 다시 칠하지 않음
Currency Strength Wizard
Oleg Rodin
4.91 (44)
통화 강도 마법사는 성공적인 거래를 위한 올인원 솔루션을 제공하는 매우 강력한 지표입니다. 표시기는 여러 시간 프레임의 모든 통화 데이터를 사용하여 이 또는 해당 외환 쌍의 힘을 계산합니다. 이 데이터는 특정 통화의 힘을 확인하는 데 사용할 수 있는 사용하기 쉬운 통화 지수 및 통화 전력선의 형태로 표시됩니다. 필요한 것은 거래하려는 차트에 표시기를 부착하는 것뿐입니다. 표시기는 거래하는 통화의 실제 강세를 보여줍니다. 지표는 또한 추세와 거래할 때 유리하게 사용할 수 있는 구매 및 판매 거래량 압력의 극한값을 보여줍니다. 지표는 또한 피보나치에 기반한 가능한 대상을 보여줍니다. 표시기는 PUSH 알림을 포함한 모든 유형의 알림을 제공합니다. 구매 후 연락주세요. 나는 당신과 거래 팁을 공유하고 당신에게 무료로 훌륭한 보너스 지표를 줄 것입니다! 나는 당신에게 행복하고 유익한 거래를 기원합니다!
기적적인 외환 지표 소개: 정확한 트레이딩의 힘을 발휘하세요 모든 시간대에서 뛰어난 결과를 제공하는 최고의 외환 지표를 찾는데 지친 적이 있나요? 더 이상 찾을 필요가 없습니다! 기적적인 외환 지표가 도래하여 귀하의 트레이딩 경험을 혁신하고 수익을 새로운 고도로 끌어올립니다. 최첨단 기술과 수년간의 정성스런 개발을 토대로 기적적인 외환 지표는 외환 시장에서의 힘과 정확성의 정점으로 떠오릅니다. 이 탁월한 도구는 모든 수준의 트레이더의 요구를 충족시키고 지속적인 수익을 추구하는 데에서 비길 데 없는 우위를 제공하기 위해 설계되었습니다. 기적적인 외환 지표의 가장 큰 장점은 그 뛰어난 적응성에 있습니다. 당신이 데이 트레이더, 스윙 트레이더이든 장기 포지션을 선호하든, 이 지표는 모든 시간대에서 뛰어난 결과를 제공하기 위해 최적화되었습니다. 그러나 그 정확성과 시장의 복잡한 움직임을 포착하는 능력이 참으로 빛을 발하는 것은 1시간 기간대에서 사용할 때입니다. 기적적인 외환 지표의 정확성
Advanced Supply Demand
Bernhard Schweigert
4.92 (310)
현재 33% 할인! 초보자나 전문 트레이더를 위한 최고의 솔루션! 이 보조지표는 우리가 다수의 독창적 기능과 새로운 공식을 통합한 독특하고 고품질이며 저렴한 거래 도구입니다. 이 업데이트를 통해 이중 시간대를 표시할 수 있습니다. 더 높은 TF를 표시할 수 있을 뿐만 아니라 차트 TF와 더 높은 TF 모두를 표시할 수 있습니다: 중첩 영역 표시. 모든 Supply Demand 트레이더들이 좋아할 것입니다. :) 중요한 정보 공개 Advanced Supply Demand의 잠재력을 극대화하려면 다음을 방문하십시오. https://www.mql5.com/ko/blogs/post/720245   진입 또는 목표의 명확한 트리거 포인트를 정확히 찾아냄으로 해서 거래가 어떻게 개선될지 상상해 보십시오. 새로운 알고리즘을 기반으로 매수자와 매도자 간의 잠재적인 불균형을 훨씬 더 쉽게 분간할 수 있습니다. 왜냐하면 가장 강한 공급영역과 가장 강한 수요 영역과 과거에 어떻게 진행 되었는지를(이
TrendDecoder Premium
Christophe, Pa Trouillas
5 (3)
범위 및 다음 가능한 움직임 식별   |  추세의 초기 신호와 강도를 확인하세요   |  반전 전 명확한 출구 확보   |  가격이 테스트 할 피보 레벨 파악 비추적, 비지연 지표 - 수동 및 자동 거래에 이상적 - 모든 자산 및 모든 시간 단위에 적합 기간 한정 혜택 >>   50% 할인 구매 후 이 채널로 문의 하여 권장 설정을 확인하세요. MT5   버전:   여기를 클릭하세요 BladeSCALPER   및   PowerZONES   로 전체 방법을 확인하세요. 어떤 서비스인가요? 트렌드디코더는 추세 모니터링을 간단하고 쉽게 하기 위한 여러 혁신 기술의 집약체입니다. 투영 추세선(투영 추세선) - 다가오는 추세의 속도 기준 실시간 추세선과 투영 추세선 비교 - 시장이 이전과 같은 방향으로 움직이고 있는지, 아니면 둔화되고 있는지? 실시간 추세선 교차 - 추세가 궤도를 이탈하고 있습니다. 그레이박스 - 시장이 더 이상 추세가 아니며 새로운 전환기에 들어섰습
TrendMaestro
Stefano Frisetti
5 (2)
note: this indicator is for METATRADER4, if you want the version for METATRADER5 this is the link: TRENDMAESTRO recognizes a new TREND in the bud, he never makes mistakes. The certainty of identifying a new TREND is priceless. DESCRIPTION TRENDMAESTRO identifies a new TREND in the bud, this indicator examines the volatility, volumes and momentum to identify the moment in which there is an explosion of one or more of these data and therefore the moment in which prices have strong probability of f
Advanced Currency IMPULSE with ALERT
Bernhard Schweigert
4.91 (494)
현재 31% 할인!! 초보자 또는 전문가 트레이더를 위한 최고의 솔루션! 이 지표는 우리가 독점 기능과 비밀 공식을 통합했기 때문에 독특하고 고품질이며 저렴한 거래 도구입니다. 단 하나의 차트로 28개 통화 쌍 모두에 대한 경고를 제공합니다. 새로운 추세 또는 스캘핑 기회의 정확한 트리거 포인트를 정확히 찾아낼 수 있기 때문에 거래가 어떻게 개선될지 상상해 보십시오! 새로운 기본 알고리즘을 기반으로 구축되어 잠재적인 거래를 훨씬 더 쉽게 식별하고 확인할 수 있습니다. 이는 통화의 강세 또는 약세가 가속되는지 여부를 그래픽으로 표시하고 가속 속도를 측정하기 때문입니다. 자동차의 속도계처럼 생각하면 됩니다. 가속화할 때 Forex 시장에서 동일한 일이 분명히 더 빠르게 발생합니다. 즉, 반대 방향으로 가속화되는 통화를 페어링하면 잠재적으로 수익성 있는 거래를 식별한 것입니다. 통화 모멘텀의 수직선과 화살표가 거래를 안내합니다! 역동적인 Market Fibonacci 23
Price Action Entry Alerts
Stephen Sanjeeve Sahayam
5 (3)
이 지표는 매수 또는 매도 압력에 대한 모든 막대를 선별하고 볼륨이 가장 높은 4가지 유형의 캔들 패턴을 식별합니다. 이 양초는 여러 선형 필터를 사용하여 필터링되어 매수 또는 매도 신호를 표시합니다. 신호는 더 높은 시간 프레임 방향과 함께 거래량이 많은 시간에 거래될 때 가장 잘 작동합니다. 모든 필터는 사용자 정의가 가능하며 독립적으로 작동합니다. 버튼 클릭으로 단일 방향의 신호를 볼 수 있습니다. 또한 이 지표에는 의사 결정 과정을 지원할 수 있는 가장 중요한 가격 조치 및 스마트 머니 개념이 포함되어 있습니다. 하나의 도구에서 신호 및 거래 교육을 모두 제공합니다. 특징: 신호는 다시 칠하지 않습니다. Engulfing candles, Rejection candles, Expanded range candles 및 Pinbars를 식별합니다. 각 유효한 신호에 대해 여러 항목, 손절매 및 여러 이익 실현 수준을 표시합니다. 대량 세션으로 필터링합니다. 지원/저항 수준 및
Entry Points Pro
Yury Orlov
4.7 (225)
다시 색을 칠하지 않고 거래에 진입할 수 있는 정확한 신호를 제공하는 MT4용 지표입니다. 외환, 암호화폐, 금속, 주식, 지수 등 모든 금융 자산에 적용할 수 있습니다. 매우 정확한 추정값을 제공하고 매수와 매도의 가장 좋은 시점을 알려줍니다. 하나의 시그널로 수익을 내는 지표의 예와 함께 비디오 (6:22)시청하십시오! 대부분의 거래자는 Entry Points Pro 지표의 도움으로 첫 거래 주 동안 트레이딩 결과를 개선합니다. 저희의   Telegram Group 을 구독하세요! Entry Points Pro 지표의 좋은점. 재도색이 없는 진입 신호 신호가 나타나고 확인되면(시그널 캔들이 완성된 경우) 신호는 더 이상 사라지지 않습니다. 여타 보조지표의 경우 신호를 표시한 다음 제거되기 때문에 큰 재정적 손실로 이어집니다. 오류 없는 거래 게시 알고리즘을 통해 트레이드(진입 또는 청산)를 할 이상적인 순간을 찾을 수 있으며, 이를 통해 이를 사용하는 모든 거래자의
EasyTrade Indicator
Gabor Bocsak
5 (5)
다중 통화 및 다중 시간대 매수 및 매도 알림. 자동 추적 중지 및 위험 보상 이익 실현! 지표는 시장을 스캔하고 분석하므로 귀하가 할 일이 없습니다! 하나의 차트에서 모든 통화를 거래하세요!   구매 후 댓글 남겨주시면 연락드리겠습니다. 무역도우미 EA를 보내드리겠습니다. 표시기는 여러 오실레이터와 부착된 필터를 사용하여 최상의 확인 진입점을 찾으므로 걱정할 필요가 없습니다! 이는 귀하에게 경고하고 귀하가 시청하기로 선택한 모든 기간과 통화에 대한 버튼을 그립니다. 버튼을 누르면 차트로 이동하여 거래를 시작할 수 있습니다! 이 표시기는 또한 모든 기본 및 시장 감시 통화에 대한 강도 패널을 그립니다(설정에서 조정 가능). 그러면 모든 통화 쌍과 선택한 더 높은 기간의 통화가 표시됩니다. 표시기 창에는 추세 필터가 포함된 특수 MACD 히스토그램과 차트 통화에 대한 다중 기간 추세 패널이 있습니다! 모든 통화와 시간대에 대한 거래 알림을 제공하며 버튼을 누르면
How to use Pair Trading Station Pair Trading Station is recommended for H1 time frame and you can use it for any currency pairs. To generate buy and sell signal, follow few steps below to apply Pair Trading Station to your MetaTrader terminal. When you load Pair Trading Station on your chart, Pair Trading station will assess available historical data in your MetaTrader platforms for each currency pair. On your chart, the amount of historical data available will be displayed for each currency pai
PRO Renko System
Oleg Rodin
5 (24)
PRO Renko System 은 RENKO 차트 거래를 위해 특별히 고안된 매우 정확한 거래 시스템입니다. 이것은 다양한 거래 상품에 적용될 수있는 보편적 인 시스템입니다. 체계는 효과적으로 당신에게 정확한 반전 신호에 접근을 주는 소위 시장 소음을 중화합니다. 이 표시기는 사용하기가 매우 쉽고 신호 생성을 담당하는 매개 변수가 하나만 있습니다. 당신은 쉽게 당신의 선택의 어떤 무역 계기에 공구를 적응시킬 수 있고 renko 막대기의 크기. 나는 항상 당신이 내 소프트웨어로 수익성있게 거래 할 수 있도록 추가 지원을 제공 할 준비가되어 있습니다! 나는 당신에게 행복하고 수익성있는 거래를 기원합니다! 구매 후 저에게 연락하십시오! 내 렌코 차트 생성기를 보내드립니다. 또한 내 개인 권장 사항 및 시스템의 다른 모듈을 무료로 공유 할 것입니다!
우선적으로 이 거래 시스템은 다시 그리지 않고, 다시 그리지 않으며, 지연되지 않는 것을 강조할 가치가 있습니다. 이는 전문적인 거래에 이상적입니다. "스마트 서포트 앤 레지스턴스 트레이딩 시스템"은 새로운 및 경험 많은 트레이더를 위해 개발된 고급 지표입니다. 이 시스템은 외환 시장에서 정밀도와 신뢰감을 제공합니다. 이 포괄적인 시스템은 일일 거래 전략, 스윙 거래 전략, 지원 및 저항 전략, 캔들스틱 패턴 전략, VWAP 전략, 다중 시간대 추세 전략 등을 포함한 7개 이상의 전략, 10개의 지표 및 다양한 거래 방식을 결합합니다. 이 시스템은 화살표 신호, 진입 및 출구 지점, 거래 경보, 높은 시간대 추세 분석, 실시간 거래 모니터링 및 트렌드 및 볼륨 캔들 색상 제공합니다. 자동 지원 및 저항 감지로 다양한 시장 상황에서 신중한 결정을 돕는 다면적 인 지표입니다. 스마트 서포트 앤 레지스턴스 트레이딩 시스템은 프리미엄 및 강력한 지표 및 도구 모음을 통합한 견고한
PTS Precision Index Oscillator V2
PrecisionTradingSystems
5 (1)
프리시전 트레이딩 시스템의 로저 메드칼프에 의한 프리시전 인덱스 오실레이터 (Pi-Osc) 버전 2는 차트에 신속하게 로드되도록 주의 깊게 다시 코딩되었으며 경험을 향상시키기 위해 몇 가지 다른 기술적 개선 사항이 통합되었습니다. Pi-Osc는 정확한 거래 타이밍 신호를 제공하도록 개발되었으며 시장이 모든 사람의 스톱을 청산하기 위해 가야 하는 극도의 고갈 지점을 찾는 데 목적이 있습니다. 이 제품은 극단적인 지점이 어디에 있는지 알고 있는 고전적인 문제를 해결하며 트레이더로서의 삶을 훨씬 간단하게 만듭니다. 이것은 업계 표준 오실레이터와는 상당히 다른 강력한 차이점을 가지고 있는 고도로 복잡한 합의 지표입니다. 사용하는 기능 중 일부는 수요 지수, 자금 흐름, RSI, 스토캐스틱, 패턴 인식, 거래량 분석, 표준 편차 극단점 및 다양한 길이에서 위와 유사한 변형을 갖습니다. 미숙한 눈에는 다른 오실레이터와 비슷해 보일 수 있지만 RSI 또는 모멘텀과 같은 다
GOLD Impulse with Alert
Bernhard Schweigert
4.56 (9)
이 지표는 Advanced Currency IMPULSE with ALERT  +   Currency Strength Exotics  의 2가지 제품의 슈퍼 조합입니다. 그것은 모든 시간 프레임에 대해 작동하며 8개의 주요 통화와 하나의 기호에 대한 강약의 충동을 그래픽으로 보여줍니다! 이 표시기는 금, 이국적인 쌍, 상품, 지수 또는 선물과 같은 기호에 대한 통화 강도 가속을 표시하는 데 특화되어 있습니다. 금, 은, 오일, DAX, US30, MXN, TRY, CNH 등의 진정한 통화 강도 가속(충동 또는 속도)을 표시하기 위해 9번째 줄에 모든 기호를 추가할 수 있습니다. 새로운 기본 알고리즘을 기반으로 구축되어 잠재적인 거래를 훨씬 더 쉽게 식별하고 확인할 수 있습니다. 이는 통화의 강세 또는 약세가 가속되는지 여부를 그래픽으로 표시하고 가속 속도를 측정하기 때문입니다. 자동차의 속도계처럼 생각하면 됩니다. 가속화할 때 Forex 시장에서 동일한 일이 분명히
PTS Divergence Buy Finder
PrecisionTradingSystems
PTS - Precision Trading Systems의 Divergence Buy Finder Precision Divergence Finder는 시장 바닥을 핀포인트 정확도로 찾아내도록 설계되었으며 이를 자주 수행합니다. 기술적 분석에서 바닥을 고르는 기술은 일반적으로 정상을 선택하는 것보다 훨씬 쉽습니다. 이 항목은 정확히 이 작업을 위해 설계되었습니다. 상승 Divergence가 식별되면 구매하기 전에 트렌드가 반등할 때 기다리는 것이 현명합니다. 10 또는 20 바 높음을 사용하거나 이전 바의 이동 평균 15-30이 상승하는 것을 식별하기 위해 사용할 수 있습니다. 복잡한 알고리즘은 실시간 바 단위로 활성 Demand Index(DI) Divergence 수를 찾아내고 계산합니다. 모델은 시장 가격이 새로운 최저점을 기록하고 Demand Index가 새로운 최저점을 기록하지 않을 때 Divergence를 발생시키는 것을 관찰합니다. 이 지표는 두 가지
PTS Divergence Sell Finder V2
PrecisionTradingSystems
로저 메드칼프 (Roger Medcalf)의 PTS 다이버전스 파인더 판매 인디케이터 - 프리시전 트레이딩 시스템. 이 인디케이터는 곰세 - 판매 신호만을 제공합니다. 먼저, 많은 해 동안 매수 신호 다이버전스 파인더를 제공하는 반면 판매 다이버전스 인디케이터를 제공하지 않았던 이유를 자주 묻는 질문을 받았습니다. 매도 다이버전스가 매수 다이버전스보다 신뢰성이 떨어진다고 답했으며, 이것은 여전히 사실입니다. 이를 변경하기 위한 몇 가지 솔루션이 발견되었으며, 이는 동료 압력에 따르거나 15년 전에 만든 이 인디케이터를 수정하는 것이 아니라 기본 설정을 보다 엄격하게 변경함으로써 이루어졌습니다. PTS 다이버전스 파인더 판매 인디케이터는 어떻게 작동합니까? PTS 다이버전스 파인더 판매 인디케이터는 거래량을 기반으로 한 Demand Index에서 발생한 다이버전스의 수를 정확하게 측정합니다. MT4는 거래량 대신 틱 거래량을 제공하므로 기본 Demand Index 인디케이터에서 발생하
ICT, SMC, SMART MONEY CONCEPTS, SMART MONEY, Smart Money Concept, Support and Resistance, Trend Analysis, Price Action, Market Structure, Order Blocks, BOS/CHoCH,   Breaker Blocks ,  Momentum Shift,   Supply&Demand Zone/Order Blocks , Strong Imbalance, HH/LL/HL/LH,    Fair Value Gap, FVG,  Premium  &   Discount   Zones, Fibonacci Retracement, OTE, Buy Side Liquidity, Sell Side Liquidity, BSL/SSL Taken, Equal Highs & Lows, MTF Dashboard, Multiple Time Frame, BigBar, HTF OB, HTF Market Structure, 
TPA True Price Action indicator reveals the true price action of the market makers through 100% non-repainting signals (except early signals mode) strictly at the close of a candle! TPA shows entries and re-entries, every time the bulls are definitely stronger than the bears and vice versa. Not to confuse with red/green candles. The shift of power gets confirmed at the earliest stage and is ONE exit strategy of several. There are available now two free parts of the TPA User Guide for our custo
제작자의 제품 더 보기
Super Trend Bars
Harun Celik
3 (1)
Super Trend Bars is a trend finding indicator. It tries to find the trends that are most likely to trend. A set of indicators and a set of algorithms. Trend probability changes color when it finds a high trend. The red color represents the declining trend. The lime color represents the upward trend. Super Trend Bar changes color when it finds a trend. Features This indicator is a trend indicator by itself. It can operate without the need for additional indicators. When you see the first lime c
Multiple RSI
Harun Celik
4.5 (2)
Multiple RSI indicator works based on the standard RSI indicator. This indicator will display the RSI indicator from different timeframes on one screen. You will see the RSI indicator for all timeframes on one screen. This indicator saves you from constantly changing charts. At the same time you can analyze the operations of other graphs relative to each other. Features This indicator shows the RSI graph of the timeframe you are working on and the upper timeframe graphs. For example, if you ru
FREE
The High and Low Points indicator is designed to calculate potential order points. The main feature of this indicator is to specify the points that the price can not exceed for a long time. The market always wants to pass points that can not pass. It is necessary to place an order waiting for this point indicated by this indicator. Is an indicator that constitutes many EA strategies. Designed for manual trading. Transaction Strategies High point buy stop order Low point sell stop order For exa
HC Cross Signal
Harun Celik
5 (2)
This indicator uses Donchian channel and ATR indicators. This trend tracking system uses historical data to buy and sell. This indicator does not repaint. The point at which the signal is given does not change. You can use it in all graphics. You can use it in all pairs. This indicator shows the input and output signals as arrows and alert. Open long deals on blue arrows Open short deals on red arrows When sl_tp is set to true, the indicator will send you the close long and close short warnings.
Are you tired of channeling? This indicator is designed to draw channels. Triple graphics channels, automatically installs 3 different graphics channels. These channels are shown on a single graphic. These channels are calculated by a number of different algorithms. Automatically draws on the screen. You can select three time zones. Parameters Period1 - from here you can select the first period. It can be selected from 1 minute time period to monthly time period. Period1_Channel_Color - period
‌This indicator indicates potential entry points. Rsi indicator and console wax combination. In addition to the signals in the graphic arrows, text comments are also used. Features Works on any currency pairs. It works in all periods. Sensitivity setting. You can set the signal frequency. Use recommended standard settings. ‌The greatest feature of this display is the possibility of manual martingale. The signal intensity region tends to go in the direction of the signal. Works on all charts.
Pivot Trend
Harun Celik
5 (2)
Pivot trend indicator is a trend indicator that uses standard pivot calculation and some indicators. The purpose of the indicator is to calculate the possible trends using the pivot point. And to give the user an idea about trend direction. You can use this display as a trend indicator. Or with other indicators suitable for your strategy. Features The green bar represents the upward trend. The red bar represents the downward trend. The blue pivot point represents the upward trend. The yellow p
Strong trend indicator is a special indicator designed to capture healthy signals. There are lines showing the signal of the indicator and the power of buying and selling. The signal line is yellow. The green lines are Buy lines. The ones that are brown are Sell lines. The green line must close above the yellow line to perform the operation. The brown line must close above the yellow line to sell. The important line is the first one that closes above the yellow line. If the first line is green,
Trend Guess
Harun Celik
3 (2)
The ”Trend Guess” is a complex software that does not involve the MACD, RSI or moving averages. It adapts itself to current market conditions using complicated algorithms based on price action and out custom indicators. The indicator will gives you trading signals Buy or Sell stop loss levels indicated in the popup alert window and graphically. You have to do is to press buy or sell button whenever you get a signal Important Rules Identify a current long term trend. Example – if you trade on a
Box martingale system is an indicator designed to trade martingale. This indicator sends a signal from the highest point where the trend is likely to return. With these signals the user starts the trades. These signals appear in the form of a box. The user can see from which point the signal is given. The important thing in trading martingale is to find a good starting point. This indicator provides this starting point. Trade rules Start processing when the first trade signal arrives. The impo
HC candlestick pattern is a simple and convenient indicator able to define candle patterns.‌ Candlestick charts are a type of financial chart for tracking the movement of securities. They have their origins in the centuries-old Japanese rice trade and have made their way into modern day price charting. Some investors find them more visually appealing than the standard bar charts and the price action is easier to interpret. Hc candlestick pattern is a special indicator designed to find divergence
Face smiling trend indicator is an oscillator designed to search for turning points. Face smiling trend indicator represents an oscillator that uses in his work an average price for a certain period and is designed to determine the price reversal points. Face smiling trend indicator oscillates between 0.00 (oversold) and 105 (overbought) values depending upon market conditions. Red bars suggest bearish pressure and blue bars bullish pressure. Typically, a reversal of the trend occurs when achiev
The Stubborn Scalper indicator can run in any currency pair and at any time interval. The larger the time interval, the less false signals are obtained. Always choose a larger time interval for healthy signals. Trade rules Turn on the Buy action when the Stubborn Scalper indicator turns blue and the trend up warning is displayed. The Stop Loss is set to the level at the end of the green circle. Turn off the operation when the Stubborn Scalper indicator is green or red. Turn on the Sell action
Big Trend Signal   indicator is designed for trend and signal trading. This indicator generates trend signals.  It uses many algorithms and indicators to generate this signal. It tries to generate a signal from the points with the highest trend potential. This indicator is a complete trading product. This indicator does not need any additional indicators.  You can only trade with this indicator. The generated signals are displayed on the graphical screen.  Thanks to the alert features you can ge
This indicator is designed to find the difference in price and indicator. This indicator uses various indicators. These indicators RSI, Macd, Momentum, RVI, Stochastic, Standard deviation, Derivative, Williams, and custom. You can use these indicators by selecting the indicator type section. This indicator shows the price and indicator difference on the screen. Indicators are individually selectable. You can use the custom type to enter the desired parameters. The user is alerted with the alert
Undefeated trend indicator, an indicator that uses MacD and Bollinger bands. It is a coded indicator to find trends. It finds these trends by its own algorithm. This indicator requires visual monitoring. It does not give any warning because it needs visual follow-up. The main trendline should turn down to find the down trend. The main trend line should go under the white line and then go under the yellow line. The main trendline should turn upward to find the upward trend. The main trend line sh
Super signal series magic arrows is an indicator that generates trade arrows. It generates trade arrows with its own algorithm. These arrows give buying and selling signals. The indicator certainly does not repaint. Can be used in all pairs. Sends a signal to the user with the alert feature. Trade rules Enter the signal when the buy signal arrives. In order to exit from the transaction, an opposite signal must be received. It is absolutely necessary to close the operation when an opposite sign
This indicator is designed to filter trends. Using the RSI indicator we know. It is aimed to confirm trends with this indicator. Can be used alone. It can be used as an indicator to help other indicators. He is already a trend indicator. You can confirm the signals given by other indicators according to your strategy with this indicator. The RSI Trend Filtering indicator confirms trends using a number of complex algorithms. Red below trend zero represents the downward trend. If trend is blue abo
Colored trend indicator is a trend indicator that uses Average True Range and Standard Deviation indications. It is aimed to find more healthy trends with this indicator. This indicator can be used alone as a trend indicator. Detailed review 4 different trend colors appear on this indicator. The blue color represents the upward trend. The dark blue color has a tendency to decline after rising from the rising trend. The red color represents the declining trend. The dark red color has a tendency
Super signal series trend arrows is an indicator designed to generate trading signals. This indicator uses a number of different indicators and generates a signal using a number of historical data. It generally tries to calculate the trend return points. These trend returns may be sometimes very large, sometimes small. The investor should act with the belief that the signal may be small. Monthly median produces 5 to 10 signals. These signals vary according to market conditions. The signals do no
EMA Trend
Harun Celik
The EMA Trend indicator is a trend indicator using two moving averages. These two moving average is the main trend indicator with 89 EMA. 89 EMA is generally regarded as a trend in the Forex market. The second moving average is 49 EMA. A trend was created using two moving averages. You can use this display alone as a trend indicator. Or with other indicators suitable for your strategy. This indicator sends a warning every new trend starts. Features You can select and edit the periods. Time fra
Every successful trader knows what support and resistance spots are working. And always know that these points need to be kept in mind. They always trade according to this point. The support and resistance point indicator operates in two different modes. The first is the standard support and resistance points we know. The second is Fibonacci levels. This indicator automatically calculates and displays the support and resistance points on the screen. Features You can select the time frame you w
Real Trend Lines
Harun Celik
5 (2)
Real Trend Lines is an indicator that calculates trends using a set of channels and using a set of algorithms. This indicator helps to find trend return points. It generally represents an oscillator. This trend tracking system helps the investor to understand small or large trends and determines the direction according to it. Trending features Up trend Rule 1 - yellow trend line should be below zero level. Rule 2 - the yellow trend line should be in the green and orange channel. Rule 3 - the t
Super signal series mystery arrows is an indicator designed to generate trading signals. This indicator uses a number of different indicators and generates a signal using a number of historical data. Currency pairs:  Any Time interval:  M5, M15, M30. Suggested M5 Work with at least 20 pairs Parameters AlertsOn -  send alerts. If this feature is activated, it will be activated in other warning properties. AlertsMessage -  send a message AlertsSound -  sound alert setting AlertsEmail -  email al
Super Oscillator
Harun Celik
5 (1)
Super oscillator indicator is an oscillator designed to calculate trend reversal points. A set of bar calculations and a set of algorithms to calculate trend reversals. Level probing system with high probability trends. All of these features combine to make it easier for investors to find trends. Suggestions and Features There are two levels on the super oscillator indicator. They are at levels of 0.5 and -0.5. The oscillator bar should be below -0.5 to find the upward trend. And a blue color
The super oscillator trading system is a trend finding tool. This system consists of a few indicators and a few algorithms. The aim of this indicator is to direct the investor to find healthy trends. Trade Rules This indicator has two channel lines. These channels are red lines below zero and above zero. There is a line in two places to process. These are blue lines. There is one trend line, the yellow line. Up trend rules Rule 1 - the yellow trend line should close below the red line below th
Trend Beads
Harun Celik
The trend beads indicator is software that does not include trend indicators such as moving average, Bollinger bands. This indicator works entirely with price and bar movements. The purpose of the indicator is to calculate the most likely trends. To assist the user in determining trend trends. The user determines the trend direction with the colors on the screen. You can use this indicator alone as a trend indicator. Or with other indicators suitable for your strategy. Trade Rules Rising trend
The I Return Signal indicator is a product designed for signal trading. This indicator works by using a number of factors such as a set of indicators, recent history data, bar combinations, price movements, custom filtering system and various algorithms. It uses all of these factors at the same time and generates turn signals. The signals are generated by calculating from the highest possible points of the signal. This indicator is easy to use and understandable. Thanks to the warning features,
Super Cross Trend
Harun Celik
5 (2)
The Super Cross Trend indicator is designed for trend and signal trading. This indicator generates trend signals. It uses many algorithms and indicators to generate this signal. It tries to generate a signal from the points with the highest trend potential. This indicator is a complete trading product. This indicator does not need any additional indicators. You can only trade with this indicator. The generated signals are displayed on the graphical screen. Thanks to the alert features you can ge
Signal MACD
Harun Celik
The Signal MACD product is an indicator that works with the standard MACD indicator. This indicator is designed to do signal trading using the objective MACD indicator and a set of algorithms. This indicator can be used both as an oscillator and as a signal producing product. So you can use this indicator in two goal. When the indicator finds a signal, it shows arrow marks on the oscillator. These arrows allow investors to trade. Trade Rules "Buy" action when you see a green arrow and receive
필터:
리뷰 없음
리뷰 답변