Pixy Plus

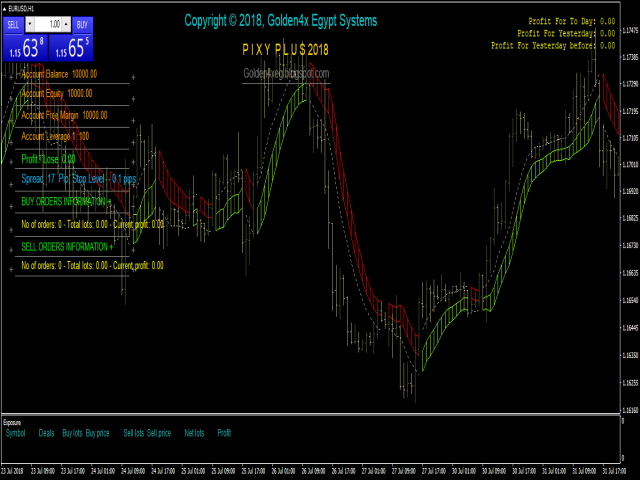
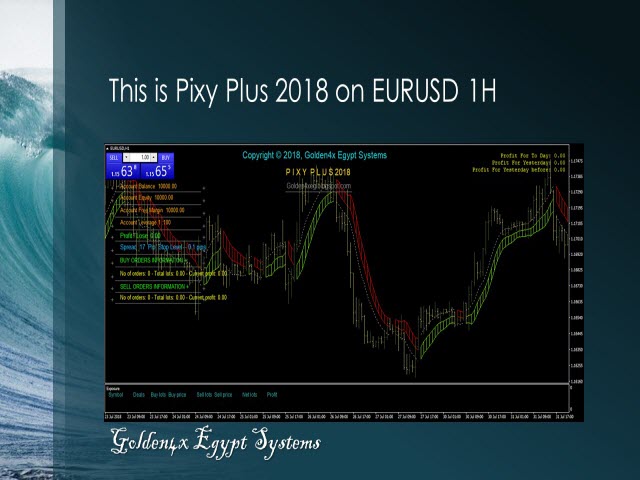
A sophisticated trend change indicator with additional filters to cherry pick trades. Also includes genuine statistics and ground-breaking automatic optimization. The indicator does not repaint but doesn't calculates stop loss and take profit. We Follow the trend depending on special formula plus price action

The statistics explain all important information most trader need it.consideration spread, the last three days can be shown together with results at the charts and ordered/ranked by profitability.

The automatic optimization will examine chart history to fine tune indicator inputs as well as when trend will change regime, filters, trading hours, upper timeframe checks and other factors. The optimization takes place initially and then on-going when the market is closed. This is all automatic without having to use the strategy tester and works on multiple charts at the same time. Optimized settings are saved to file for if MetaTrader is restarted.

The indicator can be used on any timeframe or symbol but for currency pairs it has an additional filter to check currency strengths of the pair.

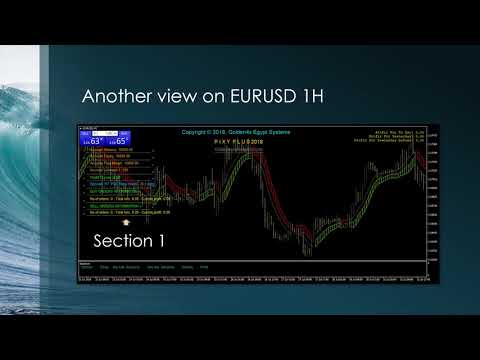
Please see the screenshots and video below to see the indicator in action.

Notice:

The time frame input you Can choose any like it appears at the Mt4 .

Example: 30 M you must write it M30 , The one hour write it H1 and so on....

Second : note you cant see the indicator only at the time frame you choose so you need to change it if you change the time frame


추천 제품
Weddell Pro
Dmitriy Kashevich
Weddell Pro is a good trading tool that is suitable for both a beginner and an experienced trader. It can be used both separately and combined with other strategies and indicators Configured for currency pairs was tested several times on cryptocurrency but did not show a high result Currency pairs USD/EUR AUD/CAD GBP/USD Showed itself very well here The percentage of correct transactions is above 68%, which does not make it perfect and bad Doesn't draw or disappear The red arrow shows a t
HorizonFX
Gabriel Gomes
5 (1)
HorizonFX — Market Oscillator for Technical Analysis Support HorizonFX is a market oscillator developed to support technical analysis in Forex and other CFD markets. It is designed to help visualize price momentum behavior and volatility context through an oscillator panel and clear visual references on the chart. Core Features Oscillator with Momentum Representation HorizonFX calculates an internal oscillator line and histogram to represent momentum behavior relative to recent market movement
Binary Option Signal
Yaroslav Varankin
Indicator for binary options arrow is easy to use and does not require configuration works on all currency pairs, cryptocurrencies buy signal blue up arrow sell signal red down arrow tips do not trade during news and 15-30 minutes before their release, as the market is too volatile and there is a lot of noise it is worth entering trades one or two candles from the current period (recommended for 1 candle) timeframe up to m 15 recommended money management fixed lot or fixed percentage of the depo
POWR Trend Trader
Trade Indicators LLC
Our most popular indicator in our fleet of indicators. The POWR Trend Trader is the highest grossing manual strategy for trading on the market today. This indicator is upgraded with more Profit Points and also introduces Re-Entry alerts. The POWR Trend Trader (PTT) is our premier indicator! What this indicator can do for your profits is staggering! HOW TO USE The POWR Trend Trader has a Master Trend Meter at the bottom of the chart. We actually re-coded the main indicator that turns your candle
Padthai Ai Robot
Nirundorn Promphao
I will support only my client. สำหรับลูกค้า Padthai Ai Robot is a safe system for Forex and Crypto currencies trading. Developed exclusively for the XAUUSD pair(GOLD), any currency pairs and any broker. Try now! The Ai Robot is designed to operate in the XAUUSD (GOLD) and any currencies market, entering only when there are high probabilities of success and certain unique conditions. The Ai Robot is based on a robust, profitable strategy and using percent level step of 1st lot size for MARTINGA
PTW NON REPAINT TRADING SYSTEM + HISTOGRAM Non-Repainting ,   Non-Redrawing   and   Non-Lagging  Trading System. Does the following: - Gives Accurate Entry and Exit Points - Scalping, Day and Swing Trading  - 95% Accuracy  - Targets, where to take profits. - Shows Trends, Support and resistance levels - Works on All Brokers - Works on All Currencies, CFDs and Stocks - It does not place trades for you, it only shows you what trades to place. - It works on All Timeframes - It is for Trend or ran
Ideal Pips
Yaroslav Varankin
Reliable Tool for the Financial Market This tool delivers high-performance results in trading on financial markets. Advantages: Fast and Accurate Signals: The arrow signals of this tool are easily and accurately analyzed, providing quality signals that you can rely on. No Repainting: This tool does not have any repainting, ensuring reliable trading signals. Quality Guarantee: If any signal repainting is detected, which we cannot correct, we will refund your money without commission. Recommendat
Momentum Shark Pro   is an advanced arrow-based trading system that provides high-accuracy signals for both new and experienced traders. With an adaptive algorithm, it displays clear buy and sell arrows, simplifying trading decisions. Optimized for key currency pairs and major sessions, Momentum Shark Pro helps users confidently capture high-probability entries and exits. Features of Momentum Shark Pro Indicator Arrow-Based Signal System Displays buy and sell arrows directly on the chart for e
빠르게 변화하는 금융 시장에서 모든 초는 중요하며 모든 결정은 거래를 성사시키거나 망칠 수 있습니다. 바이너리 해커 지표(Binary Hacker Indicator)는 분 단위로 가격 움직임을 분석하는 방식을 혁신할 준비가 된 획기적인 도구입니다. 거래의 정밀도 밝히기: 바이너리 해커 지표는 일반적인 거래 도구가 아닙니다. 실시간 분석기 역할을 하며 차트의 각 분을 분석하여 트레이더에게 귀중한 통찰력을 제공합니다. 광범위한 수동 분석이 필요한 기존 지표와 달리 바이너리 해커는 거래 전략에서 추측 작업을 제거하고 순수 데이터에 기반한 계산된 접근 방식을 제공합니다. 매 분의 힘: 거래의 매 분을 분석하고 매수와 매도 압력 사이의 복잡한 균형을 이해할 수 있다고 상상해보세요. 바이너리 해커를 통해 이러한 비전이 현실이 됩니다. 이 독창적인 지표는 시장을 지속적으로 모니터링하고 매 분마다 상승 틱과 하락 틱의 수를 계산하여 가격 액션의 본질을 쉽게 이해할 수 있는 정보로 정제합니다. 독특
Trend Arrow Super
Aleksandr Makarov
5 (2)
Trend Arrow Super The indicator not repaint or change its data. A professional, yet very easy to use Forex system. The indicator gives accurate BUY\SELL signals. Trend Arrow Super is very easy to use, you just need to attach it to the chart and follow simple trading recommendations. Buy signal: Arrow + Histogram in green color, enter immediately on the market to buy. Sell signal: Arrow + Histogram of red color, enter immediately on the market to sell.
Duna1
Victor Gauto
DUNA — 알고리즘 기반 Forex 트레이딩 Expert Advisor DUNA는 외환(Forex) 시장에서 자동 매매를 위해 설계된 전문 Expert Advisor(EA)입니다. 규율 있는 알고리즘 구조를 기반으로 구축된 DUNA는 시장의 움직임을 지속적으로 분석하고, 사전에 정의된 규칙에 따라 거래를 실행하며 감정적이거나 임의적인 개입 없이 작동합니다. 이 시스템은 가격 변동을 실시간으로 모니터링하고 시장 조건이 잠재적인 거래에 유리해지는 순간을 식별합니다. 구조화된 의사결정 모델과 동적인 거래 관리 방식을 적용함으로써, DUNA는 통제되고 체계적인 접근을 유지하면서 시장 기회에 참여하는 것을 목표로 합니다. 수동 거래와 달리, DUNA는 트레이딩 플랫폼에 설치되면 자동으로 작동합니다. EA는 시장 데이터를 평가하고 전략 조건이 충족되면 포지션을 열며, 시장 상황이 변화함에 따라 거래를 동적으로 관리합니다. DUNA는 일관성, 규율, 그리고 체계적인 실행을 우선적으로 고려하도록
Candlestick Patterns Scanner MT4
KEENBASE SOFTWARE SOLUTIONS
KT Candlestick Patterns Scanner is a Multi-Symbol and Multi-Timeframe scanner that fetches and shows various candlestick patterns on 28 currency pairs and 9 time-frames concurrently . The scanner finds the candlestick patterns by loading the KT Candlestick Patterns indicator as a resource in the background. Features The scanner can find the candlestick patterns on 252* combinations of symbols and time-frames from a single chart. Open the signal's chart loaded with a predefined template with a s
Multi Signal
Filip Maurice Daelman
Multi Signal Indicator contains a whole series of intersting buy,sell and exit signals that can be separately turned on/off. Signals : Liquidity Pools Liquidity Pools Forecast Projection Reversal Blocks Pinbar groups Overbought/Oversold with Moving Average Band (5 MA bands) Moving Average Difference Liquidity is an important aspect in the market, especially for institutional investors, as they need lots of liquidity to enter or exit the market. Therefore, institutional traders focus more on dema
Pocioli
Mike Amega
Pocioli X  The Smart AI That Trades for You Trade Smarter. Profit Faster. Relax More. Say hello to Pocioli X, the next-generation AI trading robot designed to think, learn, and adapt just like a professional trader. Unlike traditional robots that follow fixed rules, Pocioli X evolves with the market. It studies patterns, learns from every move, and adjusts its strategy automatically to keep you ahead  whether you trade Forex, Crypto, Indices, or Commodities. Why Traders Love Pocioli
Volume Arrow Signal
Michael Oko Oboh
Volume Arrow Signal Product Description Volume Arrow Signal is a smart trading indicator designed to help traders identify potential buy and sell opportunities using price action, volume behavior, and directional arrow signals. The indicator places clear arrows directly on the chart, making it easy to spot possible market reversals, trend continuations, and entry opportunities without spending hours analyzing charts manually. Whether you are trading Gold (XAUUSD) , Forex pairs, Indices, or Crypt
TPSproTREND PrO
Roman Podpora
4.67 (27)
TPSproTrend PRO       - 이는 시장을 자동으로 분석하여 추세 및 추세 변화에 대한 정보를 제공하고 거래 진입 시점을 표시하는 추세 지표입니다.       다시 그릴 필요 없이! ИНСТРУКЦИЯ RUS   -   지침   영어   -   버전 MT5 주요 기능: 정확한 진입 신호       재도색 없이! 한 번 신호가 나타나면 그 신호는 계속 유효합니다! 이는 신호를 제공한 후 변경되어 잠재적으로 예치금 손실로 이어질 수 있는 리페인팅 지표와는 확연히 다른 점입니다. 이제 더 높은 확률과 정확도로 시장에 진입할 수 있습니다. 또한 화살표가 나타난 후 목표가(익절)에 도달하거나 반전 신호가 나타날 때까지 캔들에 색상을 입히는 기능도 있습니다   . 손절매/이익실현 영역 표시 진입점을 찾을 때 시각적 명확성을 높이기 위해, 최적의 진입점을 찾을 수 있는 매수/매도 영역을 초기에 표시하는 모듈을 개발했습니다. 또한, 손절매 수준을 시간에 따라 관리하는 지능형 로직을
Reversal Overlap Bot is an automated trading strategy. No technical indicators are used in the work. At the beginning of trading, the first order is placed in a certain direction (at your option). When you open a new candle, this order is closed if it is in profit. Otherwise, the next order opens in the opposite direction. Orders are closed when profit is reached. If there are unprofitable orders on the chart, the robot will close one of them. When closing loss-making orders, the profit covers t
Sell Signall
Dmitriy Kashevich
This indicator is named so for a reason, because it will show the reverse side of the market. It has several math indicators built in that are tuned to show the best signals for currency pairs! Ideally proved to be in work on the M5-M15 no more and no less! Only at the same time it shows up to 86.5% of correct signals! The settings include the colors of the arrows, the alert, and the same parameters so that you can reconfigure the indicator and trade on cryptocurrency and raw materials! If
ScalperMulti
Andrey Spiridonov
ScalperMulti is a multicurrency indicator for professional traders. The indicator shows the complete market situation for the trader. The main advantage of this indicator is that it simultaneously analyzes six major currency pairs on all timeframes from M1 to MN. The indicator analyzes the trend strength. The indicator generates color-coded signals to visualize the market situation: Green - ascending trend. Red - descending trend. Yellow - trend is not defined. The indicator is excellent for sca
Limitless MT4
Dmitriy Kashevich
Limitless MT4 is a universal indicator suitable for every beginner and experienced trader. works on all currency pairs, cryptocurrencies, raw stocks Limitless MT4 - already configured and does not require additional configuration And now the main thing Why Limitless MT4? 1 complete lack of redrawing 2 two years of testing by the best specialists in trading 3 the accuracy of correct signals exceeds 80% 4 performed well in trading during news releases Trading rules 1 buy signal - the ap
Shark Trading
Yaroslav Varankin
The indicator is designed to trade binary options on small time frames up to m 30 Signals The blue up arrow is a buy signal. The red dn arrow is a sell signal. The signal will appear together with the advent of a new candle  and during formation Signals on the current candle Expiration time one candle from the timeframe on which you are trading You can use moving average to filter out false signals. Or escort support levels. This tool is reliable in trading.
BSS Indicator
Ailin Zamani
What Is BSS Indicator?  A tool for metatrader4 which gives signals   Forex  Technical Analysis  Indicators  are usually used to forecast price changes on the currency market. By using  Forex indicators , traders can make decisions about market entry and exit . BSS  indicator  is one of the most accurate indicators you will face.   Features Applicable on all forex pairs of Metatrader4.  Non Repaint 5m,15m,30m,1h time frames 79% winning rate User Friendly How  BSS   Works ? A file that you downloa
I will support only my client. สำหรับลูกค้า Proton Electron Ai Robot with Current TF, Auto Trading, Current Chart, Any Asset Pairs, Any Brokers, Any time zone He can recovery with compare the position win and loss direction. No Martingale, No more indicator. You can select day to trade, You can input period time to trade You can using frequency trading (HFT). Recommended 1-3 minutes Next open trade after time(Minutes) Not Recommend for ECN/Lowest Spread Account type, because it have commission f
Alphabet AI MT4
Sergei Pomytkin
알파벳 AI는 평균 회귀 전략을 기반으로 하는 어드바이저입니다. 즉, 시장의 자연스러운 특성인 큰 변동 후 평균값으로 회귀하는 특성을 활용합니다. 이 알고리즘은 자산의 현재 가격을 지속적으로 분석하여 계산된 평균값과 비교합니다. 가격이 평균값에서 크게 벗어나면 어드바이저는 이를 행동 신호로 해석합니다. 상한선을 초과하면 가격 하락을 예상하여 숏 포지션을, 하한선 아래로 떨어지면 가격 상승을 예상하여 롱 포지션을 취합니다. 저희 어드바이저의 특징은 채널 경계를 파악하고 잘못된 신호를 걸러내는 적응형 접근 방식으로, 중간 정도의 추세에서도 효과적으로 작동한다는 것입니다. 특히 가격 채널 내에서 급격한 변동을 보이는 통화쌍에서 탁월한 성과를 보입니다. Advisor는 20년 넘게 데이터 테스트를 거쳤으며 그 기간 동안 가장 불안정한 기간도 견딜 수 있습니다. 컴퓨터를 연중무휴 24시간 실행할 수 없다면 VPS 서버 서비스를 이용하는 것이 좋습니다. 고문은 12개월 이상 낮은 손실률로 안
Professional Level
Yaroslav Varankin
indicator for trading binary options and forex trading. The indicator does not redraw the readings. when trading binary options, testing was performed. This indicator showed the good results correct predictions. Under these conditions, the eur / usd m1 chart, when a signal appears, the transaction opens in the direction indicated by the indicator for 5 candles, then the truth is (5 minutes since in us the 1-minute chart of a candlestick is 1 minute) the result was. When trading in the forex m
Professional Trade Arrow  Non-repaint  MT4 technical indicator. works on all timeframes 1 minute to the monthly timeframe  the trade vision buy and sell arrow is a multi currency and synthetic indicator Aqua arrow look for selling opportunities Crimson arrow look for buying opportunities.  wait for candle to close and arrow to appear before taking any trades. Settings: Key value - 3.0 ( This parameter is adjusted for a better signal.) We recommend a trend indicator -    Trend Arrow Super
BinaryIndi
Andrey Kravchenko
This is an arrow indicator for binary options. It does not redraw, arrows do not disappear. The indicator implements an optional tester for visual monitoring of the number of signal and win rate. Does not require adjustment or fitting. Works on all pairs and gold. The signal appears at the close of a candle. Entry is made on the next bar. Optional alert. For trading with robots, there is a setting for the number of bars in history. If 0, the entire history is used. The EA operation time: 24/5 Wo
Ichimoku Map
Pavel Verveyko
Ichimoku Map (instant look at the markets) - built on the basis of the legendary Ichimoku Kinko Hyo indicator. The task of the Ichimoku Map is to provide information about the market strength on the selected time periods and instruments, from the point of view of the Ichimoku indicator. The indicator displays 7 degrees of buy signal strength and 7 degrees of sell signal strength. The stronger the trend, the brighter the signal rectangle in the table. The table can be dragged with the mouse. The
Indicador MTXPRO
Matheus Silva De Castro
PROMOÇÃO LIMITADA, NA COMPRA DE 1 INDICADOR VOCÊ LEVA CLUBINARIAS 6.0 , 5.1 e DonForex DE BRINDE!! ATÉ FINAL DO MÊS! -NA HORA DA COMPRA SELECIONAR COMBINAR COM O VENDEDOR OU BUSCAR PESSOALMENTE, A ENTREGA É DIGITAL EM POUCOS SEGUNDOS ==> VEJA O VIDEO PARA TIRAR AS SUAS DUVIDAS <== ==> VÍDEO OPERANDO NO YOUTUBE ROBÔ FEITO COM MUITO ESFORÇO E CARINHO E QUE ESTA TRAZENDO ÓTIMOS LUCROS APESAR DE EXISTIREM PESSOAS QUE APENAS VENDEM ROBÔS FAKES DE OPERAÇÕES , ACREDITO QUE SERIA MUITO BOM DA MI
The indicator is like a mother-in-law, who talks often, talks a lot and often inappropriately. The indicator, in addition to giving us an entry signal on parameters which I will then list, monitors the trend of the hourly timeframe, OSMA to understand the entry direction, RSI to sense any overbought or oversold conditions from which to abstain, ATR for the volatility and ADX for the trend. Indicator not recommended for newbies. Only the human judgment of these parameters, combined with the entr
이 제품의 구매자들이 또한 구매함
Miraculous Indicator – Gann Square of Nine 기반 100% 비리페인트 Forex 및 바이너리 도구 이 영상은 Miraculous Indicator 를 소개합니다. 이 지표는 Forex 및 바이너리 옵션 트레이더를 위해 특별히 개발된 매우 정확하고 강력한 트레이딩 도구입니다. 이 지표가 독특한 이유는 전설적인 **Gann Square of Nine(Gann 9의 사각형)**과 **Gann's Law of Vibration(Gann 진동의 법칙)**에 기반을 두고 있기 때문입니다. 이는 현대 트레이딩에서 가장 정밀한 예측 도구 중 하나로 손꼽힙니다. Miraculous Indicator는 완전히 비리페인트(non-repaint) 됩니다. 즉, 캔들이 마감된 후에도 신호가 변경되거나 사라지지 않습니다. 보이는 것이 곧 결과입니다. 이는 트레이더가 자신감을 가지고 거래에 진입하고 청산할 수 있는 신뢰할 수 있고 일관된 기반을 제공합니다. 주요 특징: Gann
Breakout Arrows Mt4
Michael Oko Oboh
5 (1)
Trend Breakout Arrows Indicator The Trend Breakout Arrows Indicator is a momentum-based signal tool designed to identify potential bullish and bearish breakout opportunities. It displays clear arrow signals directly on the price chart, helping traders quickly recognize possible trend changes and continuation setups. Up Arrow (Buy Signal) A magenta up arrow appears below a candle when bullish momentum begins to strengthen. This signal indicates that buying pressure may be overtaking selling press
Dynamic Scalper System
Vitalyi Belyh
5 (1)
" Dynamic Scalper System " 지표는 추세 파동 내에서 스캘핑 방식으로 거래하도록 설계되었습니다. 주요 통화쌍 및 금에서 테스트되었으며, 다른 거래 상품과의 호환성이 가능합니다. 추가적인 가격 변동 지원을 통해 추세에 따라 단기 포지션 진입 신호를 제공합니다. 지표의 원리 큰 화살표는 추세 방향을 결정합니다. 작은 화살표 형태의 스캘핑 신호를 생성하는 알고리즘은 추세 파동 내에서 작동합니다. 빨간색 화살표는 상승 방향을, 파란색 화살표는 하락 방향을 나타냅니다. 민감한 가격 변동선은 추세 방향으로 그려지며, 작은 화살표의 신호와 함께 작용합니다. 신호는 다음과 같이 작동합니다. 적절한 시점에 선이 나타나면 진입 신호가 형성되고, 선이 있는 동안 미결제 포지션을 유지하며, 완료되면 거래를 종료합니다. 권장되는 작업 시간대는 M1~H4입니다. 화살표는 현재 캔들에 형성되며, 다음 캔들이 이미 시작되었더라도 이전 캔들의 화살표는 다시 그려지지 않습니다. 입력 매개
TRADING STRATEGY GUIDE DELIVERY The full Trading Strategy Guide will be sent directly to you after purchase. Just message me on MQL5 and ask for it — you'll receive it instantly, along with priority support and setup help. Powered Market Scanner for Smart Trading Decisions Keypad Support & Resistance is a next-generation MT4 trading system built for serious traders who demand precision, reliability, and clarity. It combines advanced smart filters with real-time price structure logic to genera
CountSig
Yin Zhou Luo
一款信号统计指标(MT4)——实现基于当前图表周期下的单线MA转向和双线MA金叉/死叉统计 . 转向定义:前一K向下或走平,当前K向上,视为转向向上;反之,转向向下。 金死叉定义:前一K快线在慢线下方,当前K快线在慢线上方,为金叉;反之,死叉。 参数及使用说明: 1、可指定统计K线数。 2、可指定4个不同的日内时间段,格式如"03:00-07:59",4个时间段可交叉任意输入。 3、可配置ABC三个浮盈区间段点值。如:分界区间统计小点值设为500,即当某转向信 号出现后到下一反向信号止浮盈<=此点值,计入A区间; 若大于此点值<大分界点值时,计入B区间;若大于“大分界点值”计入C区间。 4、最大/最小浮盈统计。显示所有统计区间内的最大浮盈点值和最小浮盈点值(亏损点值)。 5、输出完整信号,按信号出现顺序排列,如“ACCBCA”之类。 6、综合预测。使用概率、周期、趋势、马尔可夫链等综合概算输出预测该信号出现的归类概率值。 7、加载指定MA线。在当前图表自动载入相应设置的MA线。 8、自适应列宽。以完整显示统计信号数。 9、用法:点击相应统计按钮即输出相应的统计表格.
KuKl
IGOR KIRIANEN
The indicator is built on a non-standard Zig Zag, it draws accumulations after which if the price leaves this zone and a test of this zone occurs, then a sound signal is given and an arrow appears - after the test candle closes.The indicator does not redraw its signals, it is very easy to use, there are only three settings 1- this is the zig zag parameter 2- this is the minimum price exit from the zone 3- this is the maximum price exit from the zone. The lower the parameter for Zig Zag, the more
WanaScalper MT4
Isaac Wanasolo
1 (1)
A scalping indicator based on mathematical patterns, which on average gives signals with relatively small SL, and also occasionally helps to catch big moves in the markets (more information in the video) This indicator has three main types of notifications: The first type warns of a possible/upcoming signal on the next bar The second type indicates the presence of a ready signal to enter the market/open a position The third type is for SL and TP levels - you will be notified every time price re
Meravith
Ivan Stefanov
5 (3)
마켓 메이커를 위한 도구. Meravith는 다음과 같은 기능을 제공합니다: 모든 타임프레임을 분석하고 현재 유효한 추세를 표시합니다. 강세와 약세 거래량이 동일한 유동성 구간(거래량 균형 구간)을 강조 표시합니다. 서로 다른 타임프레임의 모든 유동성 레벨을 차트에 직접 표시합니다. 텍스트 기반 시장 분석을 생성하여 참고용으로 제공합니다. 현재 추세를 기반으로 목표가, 지지선 및 손절가를 계산합니다. 거래의 위험 대비 보상 비율(Risk/Reward)을 계산합니다. 계좌 잔고에 따라 포지션 크기를 산출하고 잠재 수익을 추정합니다. 시장에 중대한 변화가 발생할 경우 경고도 제공합니다. 지표의 주요 라인: 강세/약세 거래량 소진 라인 — 목표가로 사용됩니다. 시장 추세를 나타내는 라인. 시장이 강세인지 약세인지에 따라 색상이 변경되며 추세 지지선 역할을 합니다. 색상은 주로 시장 심리를 보여줍니다. 거래량 균형선(Eq). Eq(Volume Equilibrium) 라인은 시스템의 핵심입니
Rtc ML Ai Predictor MT4
Muhammad Faisal Sagala
Rtc ML Ai | Predictor CORE MACHINE LEARNING ENGINE Adaptive ML Market Predictor – Multi-Bar Trend & Candle Forecast What This Indicator Does This indicator is a  real-time market prediction engine  designed to analyze price behavior and estimate  future market tendencies . Unlike conventional indicators, this system  does not rely on static parameters or historical curve-fitting , but adapts its internal state dynamically during live market operation. Instead of using static rules, the indic
SYSTEM INTRODUCTION:   The Binary Options Channels System Is Specifically Designed For Binary Options Trading. Unlike Other Systems And Indicators That Were Adopted From Other Trading Environments For Binary Options. Little Wonder Why Many Of Such Systems Fail To Make Money . Many End Up Loosing Money For Their Users.  A Very Important Fact That Must Be Noted Is The Fact That Application Of Martingale Is not Required. Thus Making It Safer For Traders Usage And Profitability. A Trader Can Use Fi
Fxland Price Reversal Zones (MT4) FXLAND Smart Reversal Indicator is a professional technical analysis tool designed to help traders identify potential price reversal zones and key market turning points with clarity and precision. The best reversal indicator and price return by choosing only one ceiling or floor in each time frame A masterpiece of combining mathematics and Gann, fractal matrix, Fibonacci, movement angle and time. Completely intelligent Key Features Detects potential pr
The Hurricane Indicator
Paul Nicholas Clevett
5 (1)
Currently switched to the 4 hour chart - but use other time frames for confirmation. :-)  I change my main time frame based on the market movement at the time. The Hurricane Forex Indicator is a multi time frame indicator that includes such things as Trade Notifications, Trade Calculator, Momentum Indicator, risk reward and much more. We have a free Trade room for our users as well. Please check out the video for full details of how this indicator works as it has over 15 years worth of developme
VTrende Pro mt4
Andrii Diachenko
3 (2)
VTrende Pro MT4 - MTF indicator for trend trading with a display panel for MT5 *** Videos can be translated into any language using subtitles (video language - Russian) Although the signals of the VTrende Pro indicator can be used as signals of a full-fledged trading system, it is recommended to use them in conjunction with the Bill Williams TS. VTrende Pro  MT4 is an extended version of the VTrende indicator. Difference between Pro version and VTrende: - Time zones - Signal V - signal 1-2 wave
[Trend Line Pro 3]  Trend Line Pro 3 is a discretionary analysis indicator that visualizes swing structure based on Dow Theory / ZigZag concepts and organizes key lines (support/resistance and trendlines) as well as potential break/structure-change points (BreakEdge) directly on the chart. * This product is NOT an EA. It does not place trades or send orders. It helps you organize market structure with the same rules and align your decision criteria more consistently.
FFx Engulfing Setup Alerter gives trade suggestions with Entry, Target 1, Target 2 and StopLoss. Below are the different options available: Entry suggestion - pips to be added over the break for the entry 3 different options to calculate the SL - by pips, by ATR multiplier or at the pattern High/Low 3 different options to calculate the 2 TPs - by pips, by ATR multiplier or at Risk/Reward Offset the dashboard - any place on the chart Remove the suggestion once the price reached the SL line Lines
FFx InsideBar Setup Alerter gives trade suggestions with Entry, Target 1, Target 2 and StopLoss. Below are the different options available: Entry suggestion - pips to be added over the break for the entry Minimum candle size - to avoid too close buy/sell entry suggestions 3 different options to calculate the SL - by pips, by ATR multiplier or at the pattern High/Low 3 different options to calculate the 2 TPs - by pips, by ATR multiplier or at Risk/Reward Offset the dashboard - any place on the c
FFx OutsideBar Setup Alerter gives trade suggestions with Entry, Target 1, Target 2 and StopLoss. Below are the different options available: Entry suggestion - pips to be added over the break for the entry. 3 different options to calculate the SL - by pips, by ATR multiplier or at the pattern High/Low. 3 different options to calculate the 2 TPs - by pips, by ATR multiplier or at Risk/Reward. Offset the dashboard - any place on the chart. Remove the suggestion once the price reached the SL line.
FFx PinBar Setup Alerter gives trade suggestions with Entry, Target 1, Target 2 and StopLoss. Below are the different options available: Entry suggestion - pips to be added over the break for the entry Minimum candle size - to avoid too small candles 3 different options to calculate the SL - by pips, by ATR multiplier or at the pattern High/Low 3 different options to calculate the 2 TPs - by pips, by ATR multiplier or at Risk/Reward Offset the dashboard - any place on the chart Remove the sugges
Lineverse Trendlines
Arkady Segal
5 (1)
Automatic, live & interactive picture of all trendlines. Assign push, email and sound alerts to the lines of your choice and be informed about price rollback, breakout, rollback after breakout, number of rollbacks, line expiration by double breakout. Correct, drag or delete the lines and interactively tune the line system. https://youtu.be/EJUo9pYiHFA . Chart examples https: //www.mql5.com/en/users/efficientforex Price Interaction Events All events are effective immediately and only after one
FFx MACD Divergences
Eric Venturi-Bloxs
The purpose of this new version of the MT4 standard indicator provided in your platform is to display in a sub-window multiple timeframes of the same indicator with its divergences. See the example shown in the picture below. But the display isn't like a simple MTF indicator. This is the real display of the indicator on its timeframe. Here's the options available in the FFx divergences indicator: Select the timeframes to be displayed (M1 to Monthly) Define the width (number of bars) for each tim
FFx RSI Divergences
Eric Venturi-Bloxs
The purpose of this new version of the MT4 standard indicator provided in your platform is to display in a sub-window multiple timeframes of the same indicator with its divergences. See the example shown in the picture below. But the display isn't like a simple MTF indicator. This is the real display of the indicator on its timeframe. Here's the options available in the FFx divergences indicator: Select the timeframes to be displayed (M1 to Monthly) Define the width (number of bars) for each tim
FFx CCI Divergences
Eric Venturi-Bloxs
The purpose of this new version of the MT4 standard indicator provided in your platform is to display in a sub-window multiple timeframes of the same indicator with its divergences. See the example shown in the picture below. But the display isn't like a simple MTF indicator. This is the real display of the indicator on its timeframe. Here's the options available in the FFx divergences indicator: Select the timeframes to be displayed (M1 to Monthly). Define the width (number of bars) for each ti
The FFx Dashboard MTF alerter will show you on a single chart all the timeframes (M1 to Monthly) with their own status for the indicator. 2 Alert Options: Single timeframe: each selected timeframe alert separately when a signal occurs Multi timeframes: all selected timeframes must agree for an alert to be triggered Both options have an input to select the timeframes to be used for the alert(s). How to Understand the Status: Green/Red square: histogram above/below 0 line Green square + Red bord
The FFx Dashboard MTF alerter will show you on a single chart all the timeframes (M1 to Monthly) with their own status for the indicator. 2 Alert Options: Single timeframe: each selected timeframe alert separately when a signal occurs Multi timeframes: all selected timeframes must agree for an alert to be triggered Both options have an input to select the timeframes to be used for the alert(s). How to understand the status: Green/Red square: RSI above/below 50 line Green square + Red border: R
The FFx Dashboard MTF alerter will show you on a single chart all the timeframes (M1 to Monthly) with their own status for the indicator. 2 Alert Options: Single timeframe: each selected timeframe alert separately when a signal occurs Multi timeframes: all selected timeframes must agree for an alert to be triggered Both options have an input to select the timeframes to be used for the alert(s). How to understand the status: Green/Red square: Stoch above/below 50 line Green square + Red border:
The FFx Dashboard MTF alerter will show you on a single chart all the timeframes (M1 to Monthly) with their own status for the indicator. 2 Alert Options: Single timeframe: each selected timeframe alert separately when a signal occurs Multi timeframes: all selected timeframes must agree for an alert to be triggered Both options have an input to select the timeframes to be used for the alert(s). How to understand the status: Green/Red square: Price above/below Cloud (Kumo) Green square + Red bo
The FFx Dashboard MTF alerter will show you on a single chart all the timeframes (M1 to Monthly) with their own status for the indicator. 2 Alert Options: Single timeframe: each selected timeframe alert separately when a signal occurs Multi timeframes: all selected timeframes must agree for an alert to be triggered Both options have an input to select the timeframes to be used for the alert(s). How to understand the status: Green/Red square: MA pointing Up/Down Green square + Red border: MA po
The FFx Dashboard MTF alerter will show you on a single chart all the timeframes (M1 to Monthly) with their own status for the indicator. 2 Alert Options: Single timeframe: each selected timeframe alert separately when a signal occurs. Multi timeframes: all selected timeframes must agree for an alert to be triggered. Both options have an input to select the timeframes to be used for the alert(s). How to understand the status: Green square: Price above PSAR Red square: Price below PSAR Options
필터:
리뷰 없음
리뷰 답변