MOR Multiple Bollinger Bands

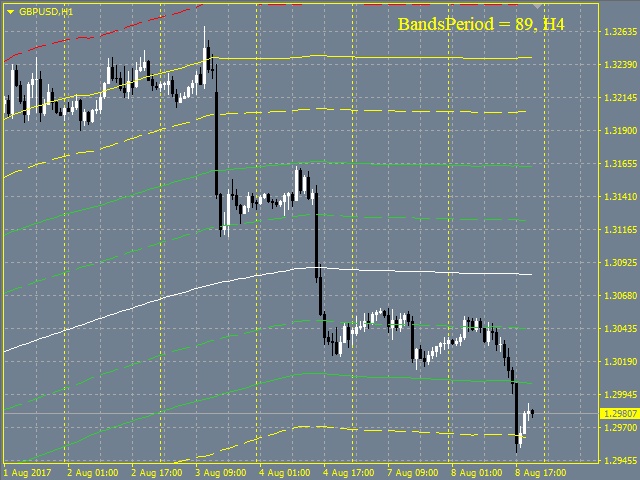
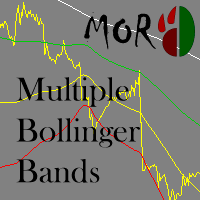
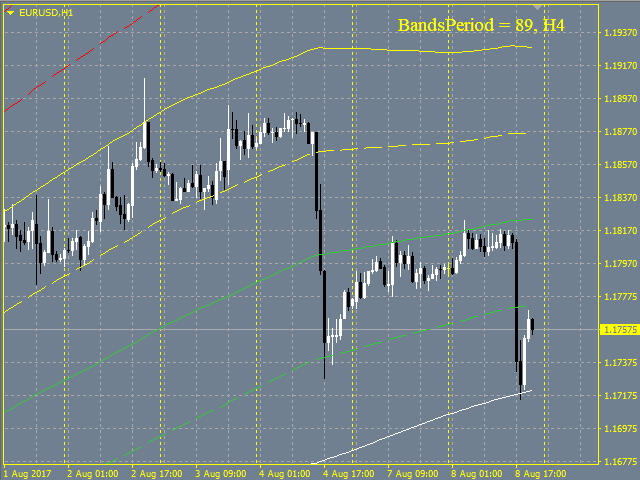
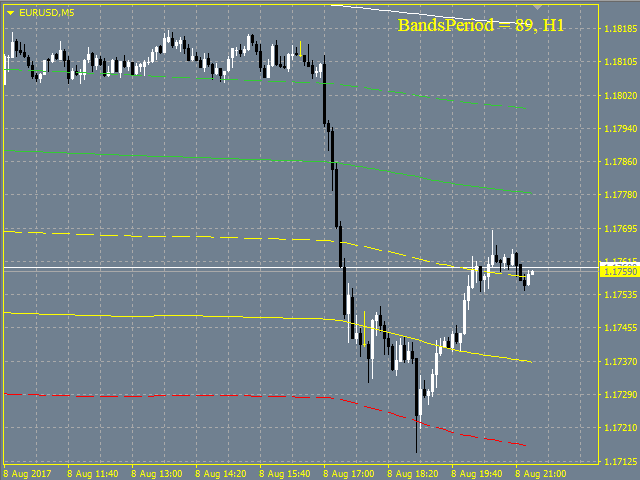
This indicator is based of the well-known Bollinger Bands indicator and provides for an easier operation with BB. It allows drawing up to 3 Bollinger channels and thus simplifies navigation in the list of indicators. Also it allows plotting Bollinger Bands of different timeframes, for example: draw BB on M5 timeframe with parameters: Period = 100, Timeframe = H1.


Inputs Value

  • Mode - choosing different modes of working with the indicator
    • StaticTimeFrame - the indicator draws Bollinger Bands from the specified timeframe
    • NextTimeFrame - the indicator draws Bollinger Bands of the next higher timeframe
  • TimeFrame - choose a timeframe to draw Bollinger Bands if Mode = StaticTimeFrame, otherwise the parameter is ignored
  • Label - show/hide the current period and timeframe of Bollinger Bands, by default it is shown in the upper right corner of the window
  • BandsPeriod - period for drawing Bollinger Bands
  • MainBand_0 - show/hide the main Bollinger Bands line
  • BandsDeviation_1, BandsDeviation_2, BandsDeviation_3 - deviation of BollingerBands, the line is hidden if set to 0.0
  • BandsShift - shift of Bollinger Bands
  • BandsAppliedPrice - price used for calculating and drawing Bollinger Bands
  • Label_X, Label_Y - coordinates of the label showing the current BB period and timeframe

The indicator does not support the drawing of values ​​from the MN1 timeframe. Also, there may not be enough history data, e.g. if you draw Bollinger Bands with parameters: Period = 100, Timeframe = D1 on M1.
추천 제품
InfoLot
Aleksandr Nadein
Индикатор помощник при торговле на валютных рынках.Работает на любых таймфреймах и любых валютных парах.Стоит его установить на любое открытое окно,чтобы получить текущую информацию по счету.Для более детальной информации нужно зайти в историю терминала и выбрать конкретный период торговли.Это может быть один день,последние три дня,неделя,месяц или вся торговля по данному счету.Индикатор учитывает все протаргованные сделки доступные в истории за выбранный период времени и по все торгуемым инстру
Trinitron
Oleksii Ferbei
Индикатор Trinitron создан для того чтобы отображать тренд в наглядном виде. Одним из главных определений для мониторинга рынка валют является тренд. Тренд - это устойчивое направление движения цены. Для его нахождения индикатор использет расчёты, призванные сглаживать резкие колебания, не влияющие на общую картину движения цены. Тренд может быть возрастающим (бычий тренд) и убывающий (медвежий тренд). В большинстве случаев тренд растёт долго и резко падает, но во всём бывают исключения. На дв
Description Candlesticks is a colored multicurrency/multy-symbol indicator. It shows a financial instrument as a candlestick chart in a separate window below the chart of the main financial symbo. The indicator may be used with any broker, irrespective of the name of the financial instrument since it is necessary to manually enter the name as an input parameter. If you enter a non-existent or incorrect name of a financial instrument, you will receive an error message that this financial instrume
Fakey
Roman Lipatov
5 (2)
Панель предназначена для быстрого визуального нахождения и отображения ложных пробоев по всем периодам и на любых выбранных валютных парах одновременно . Цвет сигнальных кнопок , указывает на направление возможного движения . По клику на сигнальную кнопку , осуществляется открытие графика с данным паттерном . Отключить не используемые периоды , можно кликом по его заголовку . Кнопка "All" открывает графики всех сигналов по данному периоду . Имеется поиск в истории ( по предыдущим барам ). Прокру
VR Cub
Vladimir Pastushak
VR Cub 은 고품질 진입점을 얻는 지표입니다. 이 지표는 수학적 계산을 용이하게 하고 포지션 진입점 검색을 단순화하기 위해 개발되었습니다. 지표가 작성된 거래 전략은 수년 동안 그 효율성을 입증해 왔습니다. 거래 전략의 단순성은 초보 거래자라도 성공적으로 거래할 수 있다는 큰 장점입니다. VR Cub은 포지션 개시 지점과 이익 실현 및 손절매 목표 수준을 계산하여 효율성과 사용 편의성을 크게 높입니다. 간단한 거래 규칙을 이해하려면 아래 전략을 사용한 거래 스크린샷을 살펴보세요. 설정, 세트 파일, 데모 버전, 지침, 문제 해결 등은 다음에서 얻을 수 있습니다. [블로그] 다음에서 리뷰를 읽거나 작성할 수 있습니다. [링크] 버전 [MetaTrader 5] 진입점 계산 규칙 포지션 개설 진입점을 계산하려면 VR Cub 도구를 마지막 최고점에서 마지막 최저점까지 늘려야 합니다. 첫 번째 지점이 두 번째 지점보다 빠른 경우, 거래자는 막대가 중간선 위에서 마감될 때까지 기다립니다
블로그: https://www.mql5.com/en/blogs/post/768816 MT4 버전: https://www.mql5.com/en/market/product/139061 MT5 버전: https://www.mql5.com/en/market/product/139062 문제점 여러 종목과 시간대를 동시에 모니터링하는 것은 느리고 반복적이며 정신적으로 피로감을 줍니다. 대부분의 트레이더는 차트를 하나씩 전환하며 시간을 낭비하지만, 결국 움직임은 이미 발생한 후입니다. 명확한 추세 변화가 보일 때쯤이면 기회를 놓치거나 너무 늦게 진입하는 경우가 많습니다. 해결책 MT5용 스캐너 HalfTrend [tambangEA]는 실용적인 다중 종목, 다중 시간대 스캐너 패널과 차트 상 HalfTrend 표시 기능을 결합하여 이러한 문제를 해결하도록 설계되었습니다. 단일 차트에서 어떤 시장이 상승 또는 하락 추세를 보이는지, 어떤 신호가 아직 유효한지, 어떤 종목에 즉각적인 주의를
ENTRY AND EXIT ARROWS Indicator – Description The Entry and Exit Arrows indicator is a simple yet effective momentum-based tool designed to highlight potential buy and sell opportunities directly on the chart using visual arrows. It works by comparing two internal momentum measurements with different sensitivities. When both measurements align in the same direction, the indicator confirms a stronger directional bias and plots a signal. How It Works Buy Signal (Lime Arrow Below Candle): Appea
Persona
Maryna Shulzhenko
Persona is a trend indicator. Flexible settings of the Persona trend indicator allow you to receive more accurate signals for opening positions. Along with its advantages, it also has its disadvantages. These include the following: Disadvantages. While Persona shows the current market trend, it does not indicate when it will be completed. And even when such signals do arrive, they are too late in relation to price changes; Even despite the flexible settings, no one has yet been able to achie
Buy and sell zones
Evgeniy Zhdan
5 (2)
평면 및 추세를 결정하기 위한 표시기. 가격이 2개의 히스토그램과 2개의 선(빨간색 및 파란색) 중 하나보다 낮으면 판매 영역입니다. 이 버전의 표시기를 구매할 때 하나의 실제 계정과 하나의 데모 계정에 대한 MT4 버전 - 선물로(수신하려면 개인 메시지를 작성하세요)! 가격이 2개의 히스토그램과 2개의 선(빨간색 및 파란색) 중 하나보다 높으면 구매 영역입니다. MT4 버전:   https://www.mql5.com/en/market/product/3793 가격이 두 라인 사이 또는 히스토그램 영역에 있으면 시장에 명확한 추세가 없습니다. 간단히 말해서 시장은 평평합니다. 표시기의 작업은 스크린샷에 더 명확하게 표시됩니다. 지표는 선행 데이터를 얻는 데 사용할 수 있습니다. 또는 현재 추세의 상태를 확인합니다.
Trend Teller MT4
Ian Nganga Comba
Trend Teller는 모든 주요 통화쌍과 모든 시간대(M1부터 MN1까지)의 시장 트렌드를 한눈에 파악할 수 있는 강력하고 직관적인 대시보드 도구입니다. 트레이더가 직접 만든 이 도구는 시장 트렌드 분석에서 추측을 제거하고, 더 큰 흐름에 맞춰 거래할 수 있도록 도와줍니다. 대부분의 초보 트레이더는 시장 방향을 파악하는 데 어려움을 겪으며, 심지어 숙련된 전문가들조차도 방향을 잘못 판단할 때가 있습니다. 그래서 Trend Teller는 초보자부터 전문가까지 모든 트레이더에게 이상적인 도구입니다. 주요 기능: 다중 시간대 분석 모든 주요 통화쌍의 강도와 방향을 즉시 스캔합니다. 스캘핑이든 스윙 트레이딩이든, Trend Teller는 모두를 지원합니다. 사용자 맞춤형 표시 데이터가 너무 많다고 느껴진다면? 걱정 마세요. 숫자만 표시하거나 색상 신호만 표시하거나, 원한다면 특정 시간대를 숨길 수도 있습니다. 내장 알림 기능 하루 종일 화면을 바라볼 필요 없습니다! 강한 추세나 거래 아
FREE
공급 및 수요 구역 주요 가격 지표 배경 시스템은 K-라인에서 자동으로 공급 및 수요 영역을 검색하고 실시간 주요 가격선을 그립니다. 거래자는 가격 거래선을 기준으로 거래할 수 있습니다. 주요 특징 시스템은 K-라인의 공급 및 수요 지역을 자동으로 검색합니다. 이 시스템은 또한 실시간 주요 가격선을 도출하고, 거래자는 가격 거래선을 기준으로 거래할 수 있습니다. 따라서 공급과 수요 구역 전략을 사용하는 거래자는 더 이상 공급과 수요 구역의 징후를 찾는 데 시간을 허비할 필요가 없습니다. 대신, 그들은 공급과 수요 영역 및 주요 가격에 대한 가격 반응에 집중하고 이에 맞는 거래 전략을 개발할 수 있습니다. 하지만 공급과 수요 구역 전략 자체는 변동성이 큰 기간 동안 더욱 효과적인 전략이므로 시장이 강한 추세를 보일 때는 주의해서 사용하거나 지표가 제시하는 제안을 추세 방향으로 사용해야 합니다. 범위 ShowZones: 공급 및 수요 구역을 표시할지 여부 DrawLines: 주요 가
El indicador "MR BEAST ALERTAS DE LIQUIDEZ" es una herramienta avanzada diseñada para proporcionar señales y alertas sobre la liquidez del mercado basándose en una serie de indicadores técnicos y análisis de tendencias. Ideal para traders que buscan oportunidades de trading en función de la dinámica de precios y los niveles de volatilidad, este indicador ofrece una visualización clara y detallada en la ventana del gráfico de MetaTrader. Características Principales: Canal ATR Adaptativo: Calcula
SFO Trend Racer
Tevin Marshall
5 (1)
SFO Trend Racer system is a trend indicator created by the CEO and Founder of " Simple Forex Options ", Tevin Marshall . It serves 6 different functions all in one. It shows the trader the entry signals as well as exit signals, whether it is a take profit or a stop loss. It also uses trend filters and signal confirmations so that the trader is able to make the most logically fit decision. Trend Racer uses various filters and specific settings from a plethora of indicators. The beauty in this ind
AO and AC Zones
Dmitriy Falkov
According to Bill Williams' trading system, the zone is formed by the combination of Accelerator Oscillator (AC) and Awesome Oscillator (AO). When they go up, we are in the green zone. When AO and AC bars are red, we are in the red zone. If one of the bars is red, while another is green, we are in the gray zone. When the current AC and AO histogram bars exceed the previous ones, the indicator is colored in green. If the current AC and AO histogram bars are below the previous ones, the indicator
FxBears Powers
Rachid Lafhil
3 (2)
FxBears Powers – Institutional Entry Levels with Precision Stop Chasing the Market. Trade the Levels That Matter. FxBears Powers is a professional trading indicator designed to identify high-probability reversal zones before price reaches them. Instead of reacting after the move has already started, FxBears Powers helps you prepare for the market by providing precise Buy Limit and Sell Limit levels based on advanced market structure analysis. The algorithm combines multiple layers of price behav
Price Alert with Trendline
Rainer Albrecht
5 (1)
The indicator plays sound alerts when the price reaches certain levels, specified by trader. You only need to draw a trendline and then press the alert button in the panel. The texts of the notification you determine. Notification via a smartphone or email address is possible. Note for "Free Demo" : MetaTrader 4 does not support displaying an alert window or playing sounds in the strategy tester, only in live or demo accounts. How it works Draw a trendline Click the "Alert" button (Trendline m
AW Candle Patterns MT4
AW Trading Software Limited
AW 양초 패턴 표시기는 강력한 양초 패턴 스캐너와 결합된 고급 추세 표시기의 조합입니다. 가장 신뢰할 수 있는 30개의 촛대 패턴을 인식하고 강조 표시하는 데 유용한 도구입니다. 또한 색상 막대를 기반으로 하는 현재 추세 분석기입니다.       크기를 조정하고 위치를 지정할 수 있는 플러그인 다중 시간 프레임 추세 패널. 트렌드 필터링에 따라 패턴 표시를 조정하는 고유한 기능. 장점: 캔들 패턴을 쉽게 식별 결과를 다시 그리지 않습니다 내장된 다중 시간 추세 패널 비활성화된 패턴 유형(1, 2, 3 촛불) 패턴 표시 시 트렌드 필터링 조정 MT5 version - >   HERE   / Instructions and description  -> HERE 표시된 패턴 목록: 망치 패턴 핀 업 / 핀 다운 약세 하라미 / 강세 하라미 Bearish Harami Cross / Bullish Harami Cross 피벗 포인트 반전 업 / 피벗 포인트 반전 다운 더 높은 종가와 함께 낮
Mirror
Stanislav Korotky
This indicator predicts rate changes based on the chart display principle. It uses the idea that the price fluctuations consist of "action" and "reaction" phases, and the "reaction" is comparable and similar to the "action", so mirroring can be used to predict it. The indicator has three parameters: predict - the number of bars for prediction (24 by default); depth - the number of past bars that will be used as mirror points; for all depth mirroring points an MA is calculated and drawn on the ch
Description Candlestick Tools  is a colored multicurrency/multy-symbol indicator. It shows one of four standard indicators as a candlestick chart in a separate window below the chart of the main financial symbol. The indicator is calculated based on one of two indicators included in the standard package of the МetaТrader 4 terminal: CCI - Commodity Channel Index. RSI - Relative Strength Index. The default indicator is Commodity Channel Index. The indicator may be used with any broker, irrespecti
This indicator is another variant of the famous powerful indicator Fibonacci-SS https://www.mql5.com/en/market/product/10136 but has different behaviour in placing Pending Order and TP Line. Automatically places Fibonacci retracement lines from the last highest and lowest visible bars on the chart with: An auto Pending Order (Buy/Sell). Taking Profit 1, Taking Profit 2 is pivot point and Taking Profit 3 for extended reward opportunity. The best risk and reward ratio. Simple and powerful indicat
Cosmic Diviner X Planet
Olena Kondratenko
4 (2)
This unique multi-currency strategy simultaneously determines the strength of trends and market entry points, visualizing this using histograms on the chart. The indicator is optimally adapted for trading on the timeframes М5, М15, М30, Н1. For the convenience of users, the indicator renders the entry point (in the form of an arrow), recommended take profit levels (TP1, TP2 with text labels) and the recommended Stop Loss level. The take profit levels (TP1, TP2) are automatically calculated for

Diviner PRO
Andrei Sennikov
Diviner PRO   Divine PRO indicator   is based on the random forest machine learning algorithm. This is my first standalone product. In this indicator, all calculations of price patterns and the formation of indicator trading signals is performed through 43x Trees. I chose this amount to keep the indicator deep in training and reduce the size of the indicator. DIVINE   indicator   - universal indicator, can work with the following:   EURUSD, USDCHF, GBPUSD . In the future I will conduct experimen
TRADING STRATEGY GUIDE DELIVERY The full Trading Strategy Guide will be sent directly to you after purchase. Just message me on MQL5 and ask for it — you'll receive it instantly, along with priority support and setup help. Powered Market Scanner for Smart Trading Decisions keypad support resistance logic 1  is a next-generation MT4 trading system built for serious traders who demand precision, reliability, and clarity. It combines advanced smart filters with real-time price structure logic to
GeoWprPro
Georgij Komarov
WPR by Profile, or WPR for Professionals Geo_WprPro is one of the well-known currency profile indicators. It simultaneously displays two WPR indicators with different parameters in the matrix form on all timeframes of multiple currency pairs forming the currency profile . As follows from the description, " WPR is a leading indicator that often goes ahead of the price chart. The oscillator frequently reaches extreme values before the price reversal as if anticipating that event: it almost always
Market Ticker
John Louis Fernando Diamante
The only Market Ticker on the market! Add a professional novelty to your workspace, with built in mini-charts A scrolling Market Ticker that displays price changes from all symbols in the Market Watch list. Provides an easy snapshot of symbol prices, and keeps scrolling automatically while you trade and analyse the chart. The ticker color (+/- price changes) are based on either the current or completed candle, and the previous candle. Options include: - MTF, eg choose to show price changes of
Momentum Jurik
Augustine Kamatu
Introducing Momentum Jurik—an innovative indicator designed to optimize your forex trading strategy by incorporating custom moving averages based on the Momentum indicator with the MetaTrader 4 indicator, Momentum. Jurik moving averages are renowned for their precision and reliability in analyzing price movements in the forex market. They provide traders with smoother representations of price action, reducing noise and offering clearer signals for identifying trends and potential reversals. T
FREE
Gioteen Volatility Index (GVI)   - your ultimate solution to overcoming market unpredictability and maximizing trading opportunities. This revolutionary indicator helps you in lowering your losing trades due to choppy market movements. The GVI is designed to measure market volatility, providing you with valuable insights to identify the most favorable trading prospects. Its intuitive interface consists of a dynamic red line representing the volatility index, accompanied by blue line that indicat
History Pattern Search
Yevhenii Levchenko
표시기는 현재 시세를 작성하여 과거 시세와 비교할 수 있으며 이를 바탕으로 가격 변동을 예측합니다. 표시기에는 원하는 날짜로 빠르게 이동할 수 있는 텍스트 필드가 있습니다. 옵션: 기호 - 표시기가 표시할 기호 선택. SymbolPeriod - 지표가 데이터를 가져올 기간 선택. IndicatorColor - 표시기 색상. HorisontalShift - 지시자가 그린 따옴표를 지정된 막대 수만큼 이동합니다. Inverse - true는 인용 부호를 반대로, false - 원래 보기를 반전합니다. ChartVerticalShiftStep - 차트를 수직으로 이동합니다(키보드의 위/아래 화살표). 다음은 날짜를 입력할 수 있는 텍스트 필드의 설정으로, '엔터'를 누르면 즉시 이동할 수 있습니다.
Distinctive
Tatiana Savkevych
Distinctive is a forex trending arrow indicator for identifying potential entry points. I like it, first of all, because it has a simple mechanism of work, adaptation to all time periods and trading tactics. Created on the basis of a regression channel with filters. Plotting the Lawrence indicator signals on a price function chart using a mathematical approach. How it works - when the price breaks out in the overbought / oversold zone (channel levels), a buy or sell signal is generated. Everyt
Splendid
Prihatiningrum
Following trend indicator coached by Alina. This product made based by RSI and Oscillator. Another indicator to support this strategy will send to you free by whatsapp. Been tested this for over 3 years, over 60% winning rate. Support Eur Usd, Eur JPY , Nzd Usd, Xau Usd. Aud Jpy , Aud Usd , Eur Cad , Usd Cad , Usd Chf , Gbp Usd, Aud Cad , Aud Nzd. quality signals and can be used for everyday .
이 제품의 구매자들이 또한 구매함
Gann Made Easy
Oleg Rodin
4.84 (169)
Gann Made Easy 는 mr.의 이론을 사용하여 최고의 거래 원칙을 기반으로 하는 전문적이고 사용하기 쉬운 Forex 거래 시스템입니다. W.D. 간. 이 표시기는 Stop Loss 및 Take Profit Levels를 포함하여 정확한 BUY 및 SELL 신호를 제공합니다. PUSH 알림을 사용하여 이동 중에도 거래할 수 있습니다. 구매 후 거래 방법 안내 및 유용한 추가 지표를 무료로 받으시려면 저에게 연락주세요! 아마도 Gann 거래 방법에 대해 이미 여러 번 들었을 것입니다. 일반적으로 Gann의 이론은 초보자 거래자뿐만 아니라 이미 거래 경험이 있는 사람들에게도 매우 복잡한 것입니다. Gann의 거래 방식은 이론적으로 적용하기 쉽지 않기 때문입니다. 나는 그 지식을 연마하고 Forex 지표에 최고의 원칙을 적용하기 위해 몇 년을 보냈습니다. 표시기는 적용하기가 매우 쉽습니다. 차트에 첨부하고 간단한 거래 권장 사항을 따르기만 하면 됩니다. 지표는 지속적으로 시장 분석
Super Signal – Skyblade Edition 전문가용 노리페인트 / 노래그 트렌드 신호 시스템, 뛰어난 승률 제공 | MT4 / MT5용 1분, 5분, 15분과 같은 낮은 타임프레임에서 가장 좋은 성능을 보입니다. 핵심 기능: Super Signal – Skyblade Edition은 추세 매매를 위해 설계된 스마트 신호 시스템입니다. 이 시스템은 다중 필터 로직을 활용하여, 명확한 방향성과 실질적인 모멘텀이 수반된 고품질 추세만을 감지합니다. 이 시스템은 고점 또는 저점을 예측하지 않으며 , 다음 세 가지 조건이 모두 충족될 때만 신호를 발생시킵니다: 명확한 추세 방향 강화되는 모멘텀 건전한 변동성 구조 또한, 시장 세션 기반의 유동성 분석을 통해 신호의 신뢰성과 타이밍을 더욱 향상시킵니다. 신호 특성: 모든 화살표 신호는 100% 리페인트 없음 / 지연 없음 신호가 한 번 발생하면 고정되며, 깜빡이거나 사라지지 않음 차트 상의 시각적 화살표, 정보 패널, 팝업 알
Neuro Poseidon MT4
Daria Rezueva
4.8 (45)
Neuro Poseidon is a new indicator by Daria Rezueva. It combines precise trading signals with adaptive TP/SL levels - creating best possible trades as a result! Message me and get  Neuro Poseidon Assistant  as a gift to automize your trading process! What makes it stand out? 1. Proven profitability on all assets and timeframes 2. Only confirmed BUY and SELL signals present on the chart 3. Adaptive TP & SL levels generated by the software for each trade 4. Easy to understand - suitable for all
Prop Firm Sniper
Mohamed Hassan
5 (5)
Prop Firm Sniper MT4  is a professional market structure indicator that automatically identifies high-probability BUY and SELL opportunities using BOS and CHoCH analysis. Recommended Timeframes: For backtesting, use the indicator on   M5 or M15   for Gold (XAUUSD), and   M15 or H1   for more volatile Forex pairs such as   GBPUSD, USDJPY, EURGBP , and similar markets. CONTACT ME AFTER PURCHASE TO CLAIM YOUR FREE BONUSES! Prop Firm Sniper  is a professional market structure indicator designed t
Zoryk Gold mt4
Reda El Koutbane
ZORYK — MetaTrader 4용 XAUUSD 전문 신호 및 트레이드 플래닝 시스템 이런 경험이 있을 것입니다. 골드를 분석하고 진입을 기다린 뒤 마침내 포지션을 열었지만 가격이 곧바로 반대 방향으로 움직입니다. 너무 일찍 청산하거나 Stop Loss를 옮기거나 몇 초 동안 망설입니다. 그 후 시장은 내가 없이도 처음 예상했던 목표까지 정확히 움직입니다. 문제는 항상 방향이 아니었습니다. 진짜 문제는 불확실성이었습니다. 정확한 진입 위치를 몰랐습니다. 어느 지점에서 원래의 트레이드 아이디어가 무효가 되는지 몰랐습니다. 가까운 수익을 확보해야 할지 더 큰 움직임을 기다려야 할지 판단하기 어려웠습니다. 현재 setup이 정말 강한지 아니면 단지 새로운 거래를 억지로 찾고 있는지도 확신하기 어려웠습니다. 골드는 매우 빠르게 움직입니다. 명확한 계획이 없다면 좋은 분석도 몇 초 만에 나쁜 결정으로 바뀔 수 있습니다. ZORYK는 이 문제를 해결하기 위해 개발되었습니다.
M1 Sniper
Oleg Rodin
5 (26)
M1 SNIPER 는 사용하기 쉬운 거래 지표 시스템입니다. M1 시간대에 맞춰 설계된 화살표 지표입니다. 이 지표는 M1 시간대 스캘핑을 위한 단독 시스템으로 사용할 수 있으며, 기존 거래 시스템의 일부로도 사용할 수 있습니다. 이 거래 시스템은 M1 시간대 거래용으로 특별히 설계되었지만, 다른 시간대에도 사용할 수 있습니다. 원래는 XAUUSD와 BTCUSD 거래를 위해 이 방법을 설계했지만, 다른 시장 거래에도 유용하다는 것을 알게 되었습니다. 이 지표의 신호는 추세 방향과 반대로 거래될 수 있습니다. 저는 지표의 신호를 활용하여 양방향으로 거래할 수 있도록 돕는 특별한 거래 기법을 알려드립니다. 이 방법은 특별한 동적 지지선과 저항선 가격 영역을 활용하는 것을 기반으로 합니다. 구매하시면 M1 SNIPER 화살표 지표를 바로 다운로드하실 수 있습니다. 또한, 아래 스크린샷에 표시된 Apollo Dynamic SR 지표는 M1 SNIPER 도구를 사용하는 모든 사용자에게 무료로
SR Liquidity 는 시장 유동성이 집중되고 가격이 가장 강력하게 반응하는 숨겨진 구간을 포착하도록 설계된 트레이딩 지표입니다. 이러한 특수 유동성 구간은 강력한 지지 및 저항선 역할을 하며, 시장 반전 가능성이 가장 높은 지점을 명확하게 보여주는 지도가 되어 줍니다. SR Liquidity는 일반적인 지지 및 저항선을 단순히 그리는 대신, 실제 가격 움직임을 분석하여 매수 및 매도 압력이 집중되는 구간을 포착합니다. 이러한 구간은 실질적인 시장의 흐름을 주도하는 유동성 풀(liquidity pools)에 해당합니다. 이 지표는 해당 구간을 차트에 직접 시각화하여, 가격 반응이 실제로 나타나기 전에 이를 미리 예측할 수 있도록 돕습니다. 즉, 가격 추세가 전환될 가능성을 사전에 파악하게 해주는 것입니다. 결과적으로 이 지표는 가공되지 않은 가격 움직임(price action)을 시장의 핵심 가격대, 다시 말해 추세 전환점이 될 수 있는 지점들을 보여주는 명확하고 실용적인 로드맵
Scalper Inside PRO
Alexey Minkov
4.74 (68)
Scalper Inside PRO helps you read the intraday trend and plan your trade before you enter. It uses exclusive built-in algorithms to evaluate market direction and calculate key target levels the moment a signal appears, so you always see the potential entry, stop-loss and profit targets ahead of time. The indicator also shows detailed performance statistics on historical data, so you can see how different instruments and strategies behaved and choose what fits current market conditions. You can e
Currency Strength Wizard
Oleg Rodin
4.85 (60)
통화 강도 마법사는 성공적인 거래를 위한 올인원 솔루션을 제공하는 매우 강력한 지표입니다. 표시기는 여러 시간 프레임의 모든 통화 데이터를 사용하여 이 또는 해당 외환 쌍의 힘을 계산합니다. 이 데이터는 특정 통화의 힘을 확인하는 데 사용할 수 있는 사용하기 쉬운 통화 지수 및 통화 전력선의 형태로 표시됩니다. 필요한 것은 거래하려는 차트에 표시기를 부착하는 것뿐입니다. 표시기는 거래하는 통화의 실제 강세를 보여줍니다. 지표는 또한 추세와 거래할 때 유리하게 사용할 수 있는 구매 및 판매 거래량 압력의 극한값을 보여줍니다. 지표는 또한 피보나치에 기반한 가능한 대상을 보여줍니다. 표시기는 PUSH 알림을 포함한 모든 유형의 알림을 제공합니다. 구매 후 연락주세요. 나는 당신과 거래 팁을 공유하고 당신에게 무료로 훌륭한 보너스 지표를 줄 것입니다! 나는 당신에게 행복하고 유익한 거래를 기원합니다!
BTMM State Engine Pro MT4
Garry James Goodchild
BTMM State Engine Pro is a MetaTrader 4 indicator for traders who use the Beat The Market Maker approach: Asian session context, kill zone timing, level progression, peak formation detection, and a multi-pair scanner from a single chart. It combines cycle state logic with a built-in scanner dashboard so you do not need the same tool on many charts at once. What it does Draws the Asian session range; session times can follow broker server offset or be set in inputs. Tracks level progression (L
MTF Supply Demand Zones
Georgios Kalomoiropoulos
4.82 (22)
자동화된 수요 및 공급 구역의 차세대. 모든 차트에서 작동하는 새롭고 혁신적인 알고리즘. 모든 구역은 시장의 가격 움직임에 따라 동적으로 생성됩니다. 두 가지 유형의 경고 --> 1)가격이 영역에 도달할 때 2)새로운 영역이 형성될 때 당신은 더 이상 쓸모없는 지표를 얻을 수 없습니다. 입증된 결과로 완벽한 거래 전략을 얻을 수 있습니다.     새로운 기능:     가격이 공급/수요 영역에 도달하면 경고     새로운 공급/수요 구역이 생성되면 알림     푸시 알림 알림     핍의 영역 너비 레이블     기동특무부대에 한 번 더 시간이 주어집니다. 따라서 현재보다 위의 2개의 시간 프레임 대신 현재보다 높은 3개의 시간 프레임을 볼 수 있습니다.     Alerts/Zones/MTF 기능을 활성화/비활성화하는 버튼 당신이 얻는 이점:     거래에서 감정을 제거하십시오.     거래 항목을 객관화하십시오.     높은 확률 설정을 사용하여 수익
Congestioni
Stefano Frisetti
5 (1)
This indicator is very usefull to TRADE Trading Ranges and helps identify the following TREND. Every Trader knows that any market stay 80% of the time in trading ranges and only 20% of the time in TREND; this indicator has been built to help traders trade trading ranges. Now instead of waiting for the next TREND, You can SWING TRADE on trading ranges with this simple yet very effective indicator. TRADING with CONGESTIONI INDICATOR: The CONGESTIONI Indicator identify a new trading range and ale
Advanced Supply Demand
Bernhard Schweigert
4.91 (302)
현재 30% 할인! 초보자나 전문 트레이더를 위한 최고의 솔루션! 이 보조지표는 우리가 다수의 독창적 기능과 새로운 공식을 통합한 독특하고 고품질이며 저렴한 거래 도구입니다. 이 업데이트를 통해 이중 시간대를 표시할 수 있습니다. 더 높은 TF를 표시할 수 있을 뿐만 아니라 차트 TF와 더 높은 TF 모두를 표시할 수 있습니다: 중첩 영역 표시. 모든 Supply Demand 트레이더들이 좋아할 것입니다. :) 중요한 정보 공개 Advanced Supply Demand의 잠재력을 극대화하려면 다음을 방문하십시오. https://www.mql5.com/ko/blogs/post/720245   진입 또는 목표의 명확한 트리거 포인트를 정확히 찾아냄으로 해서 거래가 어떻게 개선될지 상상해 보십시오. 새로운 알고리즘을 기반으로 매수자와 매도자 간의 잠재적인 불균형을 훨씬 더 쉽게 분간할 수 있습니다. 왜냐하면 가장 강한 공급영역과 가장 강한 수요 영역과 과거에 어떻게 진행 되었는지를(이전
Gold Signal Swing Pro XAUUSD with Auto TP SL (MT4) — XAUUSD 스윙 트레이딩을 위한 7층 필터 + RR 보증 시스템 리페인트 없음. 리드로 없음. 지연 없음. 모든 신호는 확정 후 고정됩니다. 구매자 보너스: 매수 라이선스 구매 시 AI Zone Radar ($59 상당) + PDF 매뉴얼 무료 제공. 구매 후 MQL5에서 메시지를 보내주세요. AI Zone Radar: https://www.mql5.com/en/market/product/175834 MT5 버전도 판매 중: https://www.mql5.com/en/market/product/170916?source=Site +Profile+Seller 활발한 트레이딩 커뮤니티의 골드 트레이더들이 사용하고 신뢰합니다. 정밀성과 사용 편의성을 위해 구축되었습니다. 이런 분에게 추천 업무나 일상으로 바빠 M5/M15 차트를 볼 수 없는 트레이더 엄선된 고품질 신호만으로 거래하고 싶은 분 야
Dynamic Forex28 Navigator
Bernhard Schweigert
4.43 (7)
Dynamic Forex28 Navigator - 차세대 외환 거래 도구. 현재 49% 할인. Dynamic Forex28 Navigator는 오랫동안 인기 있는 지표의 진화형으로, 세 가지의 힘을 하나로 결합했습니다. 고급 통화 Strength28 지표(695개 리뷰) + 고급 통화 IMPULSE with ALERT(520개 리뷰) + CS28 콤보 신호(보너스). 지표에 대한 자세한 정보 https://www.mql5.com/en/blogs/post/758844 차세대 Strength 지표는 무엇을 제공합니까?  원래 지표에서 좋아했던 모든 것이 새로운 기능과 더 높은 정확도로 강화되었습니다. 주요 기능: 독점적인 통화 Strength 공식.  모든 시간대에 걸쳐 부드럽고 정확한 강도선. 추세와 정확한 진입을 식별하는 데 이상적입니다. 역동적인 시장 피보나치 수준(시장 피보나치).  이 지표에만 있는 고유한 기능. 가격 차트가 아닌 통화 강도에 피보나치가 적용됩니다.
DayTrader PRO MT4
Davit Beridze
5 (1)
DayTrader PRO DayTrader PRO는 존 에러스(John Ehlers)의 Laguerre 필터와 강력한 자동 최적화 엔진을 결합한 고급 트레이딩 지표입니다. 고정된 파라미터를 사용하는 대신, 최근 시장 상황을 바탕으로 최적의 설정을 자동으로 검색하므로 지속적인 수동 조정 없이도 변화하는 시장 변동성에 대응할 수 있습니다. 이 지표는 명확한 매수(BUY) 및 매도(SELL) 신호를 생성하며, 현재 시장 변동성을 기준으로 계산된 적응형 손절매(Stop Loss) 및 익절(Take Profit) 레벨을 제공합니다. 내장된 추세, 효율성 지수(Efficiency Ratio), 변동성 및 캔들 필터 기능은 저품질의 진입 신호를 제거하여 신호의 정확도를 높여줍니다. 실시간 성능 대시보드에서는 현재 최적화된 설정값, 수익 요인(Profit Factor), 승률(Win Rate), 최대 낙폭(Drawdown) 및 기타 트레이딩 통계를 확인할 수 있습니다. 또한 DayTrader PR
Hydra Trend Rider
INTRAQUOTES
5 (4)
Hydra Trend Rider is a non-repainting, multi-timeframe trend indicator that delivers precise buy/sell signals and real-time alerts for high-probability trade setups. With its color-coded trend line, customizable dashboard, and mobile notifications, it's perfect for traders seeking clarity, confidence, and consistency in trend trading. Setup & Guide:  Download  MT5 Version here. To learn how to use the Indicator: Indicator Manual & Guide -   Read Here Exclusively for you: It's your chance to st
Finesia Sniper
Robby Suhendrawan
Finesia Scalper - High Probability & Non-Repainting System Discounted   Price   !!     Secure the Lowest Price Today. Next The price will increase to   250 USD . Are you looking for a powerful, high-probability trading indicator that removes the guesswork from your chart? Finesia Scalper is a professional-grade, 100% non-repainting trading tool designed to provide you with ultimate precision. Built on a proven algorithm, this indicator seamlessly combines three highly effective trading methodolo
Atomic Analyst
Issam Kassas
5 (11)
이 제품은 2026년 시장에 맞게 업데이트되었으며 최신 MT5 빌드에 최적화되었습니다. 가격 업데이트 안내: Atomic Analyst는 현재 $99 에 제공됩니다. 다음 30회 구매 후 가격은 $199 로 인상됩니다. 특별 혜택: Atomic Analyst 구매 후 저에게 개인 메시지를 보내시면 Smart Universal EA를 무료 로 받을 수 있으며, Atomic Analyst 신호를 자동 거래로 전환할 수 있습니다. Atomic Analyst는 리페인트 없음, 재그리기 없음, 지연 없음의 Price Action 거래 인디케이터로, 수동 거래, 신호 명확성, EA 자동화를 위해 설계되었습니다. User manual: settings, inputs and strategy.     &   User Manual PDF . 가격 움직임, 강도, 모멘텀, 다중 시간대 방향 및 고급 필터를 분석하여 트레이더가 노이즈를 줄이고 약한 세팅을 피하며 더 체계적인 거래 결정을 내릴 수 있도
Pytrader mt4 Python
Offpista LTD
5 (3)
Documentation for connecting Metatrader 4 with Python with a simple drag and drop EA.   A full end-to-end solution ,fully tested ,fast and efficient! The Pytrader ecosystem consists of a python script and a MT4 EA. (  MT5  version ) Further for the licensing an indicator is used.  The communication between the python script and the EA is based on sockets. EA is the  Server   and the python script the  Client .  It is always query(function / python script) and output(data / server). The EA doe
Smart Trend Trading System
Issam Kassas
4.71 (7)
이 제품은 2026년 시장에 맞게 업데이트되었으며 최신 MT5 빌드에 최적화되었습니다. 가격 업데이트 안내: Smart Trend Trading System은 현재 $99 에 제공됩니다. 다음 30회 구매 후 가격은 $199 로 인상됩니다. 특별 혜택: Smart Trend Trading System 구매 후 저에게 개인 메시지를 보내시면 Smart Universal EA를 무료 로 받을 수 있으며, Smart Trend 신호를 자동 거래로 전환할 수 있습니다. Smart Trend Trading System은 리페인트 없음, 재그리기 없음, 지연 없음의 완전한 트레이딩 시스템으로, 더 깨끗한 신호, 더 나은 추세 방향, 그리고 더 체계적인 시장 거래 방식을 원하는 트레이더를 위해 제작되었습니다. Online course , manual and [download presets] . 이 시스템은 추세 감지, 반전 구간, Smart Cloud, 트레일링 스톱 로직, 지지와 저항, 캔들
Ace Supply Demand Zone MT4
Young Ho Seo
3.75 (4)
Ace Supply Demand Zone Indicator The concept of supply demand relies on the quantity mismatching between buying and selling volumes in the financial market. Supply and demand zone can provide the good entry and exit. A zone is easier to trade than a line. The supply demand zone can provide the detailed trading plan and the risk management. Its ability to predict market direction is high. There are two distinctive points about Ace Supply Demand Zone Indicator. Ace Supply Demand Zone indicator was
Master Volume profile
Israr Hussain Shah
Money Flow Profile MT5 HERE   Here   our more valuable tools SMC Trend Trading   ,  Easy SMC Trading  ,  Institutional SMC Architect Volume Analysis Tools  ,  Volume flow Profile  ,  Market volume profile  , FVG with Volume  , Liquidity Heatmap Profile  ,  Volume Spread Analysis This Master Edition is engineered for clarity and speed, featuring a unique Auto-Theme Sync system that instantly beautifies your chart layout upon loading. Key Features: True Money Flow Calculation: Goes beyond stand
Meravith
Ivan Stefanov
5 (3)
마켓 메이커를 위한 도구. Meravith는 다음과 같은 기능을 제공합니다: 모든 타임프레임을 분석하고 현재 유효한 추세를 표시합니다. 강세와 약세 거래량이 동일한 유동성 구간(거래량 균형 구간)을 강조 표시합니다. 서로 다른 타임프레임의 모든 유동성 레벨을 차트에 직접 표시합니다. 텍스트 기반 시장 분석을 생성하여 참고용으로 제공합니다. 현재 추세를 기반으로 목표가, 지지선 및 손절가를 계산합니다. 거래의 위험 대비 보상 비율(Risk/Reward)을 계산합니다. 계좌 잔고에 따라 포지션 크기를 산출하고 잠재 수익을 추정합니다. 시장에 중대한 변화가 발생할 경우 경고도 제공합니다. 지표의 주요 라인: 강세/약세 거래량 소진 라인 — 목표가로 사용됩니다. 시장 추세를 나타내는 라인. 시장이 강세인지 약세인지에 따라 색상이 변경되며 추세 지지선 역할을 합니다. 색상은 주로 시장 심리를 보여줍니다. 거래량 균형선(Eq). Eq(Volume Equilibrium) 라인은 시스템의 핵심입니
TrendMaestro
Stefano Frisetti
4 (4)
Attention: beware of SCAMS, TRENDMAESTRO is only ditributed throught MQL5.com market place. note: this indicator is for METATRADER4, if you want the version for METATRADER5 this is the link:  https://www.mql5.com/it/market/product/108106 TRENDMAESTRO ver 2.5 TRENDMAESTRO recognizes a new TREND from the start, he never makes mistakes. The certainty of identifying a new TREND is priceless. DESCRIPTION TRENDMAESTRO identifies a new TREND in the bud, this indicator examines the volatility, volumes a
CRT Candle Range Theory HTF MT4.   Ultimate CRT Indicator: Advanced ICT Concepts and Malaysian SnR Trading System Master the Market Maker's Footprints with the Most Advanced Candle Range Theory Indicator Unlock the true power of  Smart Money Concepts (SMC)  and trade precisely like the institutions with the  Ultimate CRT Indicator . Built exclusively for serious traders, this indicator automates the highly effective  Candle Range Theory (CRT) , a core pillar of  ICT Concepts (Inner Circle Trader
TrendDecoder Premium
Christophe Pa Trouillas
5 (8)
범위 및 다음 가능한 움직임 식별   |  추세의 초기 신호와 강도를 확인하세요   |  반전 전 명확한 출구 확보   |  가격이 테스트 할 피보 레벨 파악 비추적, 비지연 지표 - 수동 및 자동 거래에 이상적 - 모든 자산 및 모든 시간 단위에 적합 구매 후, 무료 TrendDECODER_Scanner를 받기 위해 저에게 연락해 주세요. MT5   버전:   여기를 클릭하세요 BladeSCALPER   및   PowerZONES   로 전체 방법을 확인하세요. 어떤 서비스인가요? 트렌드디코더는 추세 모니터링을 간단하고 쉽게 하기 위한 여러 혁신 기술의 집약체입니다. 투영 추세선(투영 추세선) - 다가오는 추세의 속도 기준 실시간 추세선과 투영 추세선 비교 - 시장이 이전과 같은 방향으로 움직이고 있는지, 아니면 둔화되고 있는지? 실시간 추세선 교차 - 추세가 궤도를 이탈하고 있습니다. 그레이박스 - 시장이 더 이상 추세가 아니며 새로운 전환기에 들어섰습니다. 디코더신
M1 Arrow
Oleg Rodin
4.81 (21)
M1 Arrow는 변동성과 거래량 분석을 포함한 시장의 자연스러운 거래 원칙에 기반한 지표입니다. 모든 시간 프레임과 외환 쌍에서 사용할 수 있으며, 지표 내의 간편한 파라미터 설정을 통해 원하는 외환 쌍과 시간 프레임에 맞춰 신호를 조정할 수 있습니다. 매수/매도 신호를 제공하는 기본 알고리즘 외에도, 입력값에 따라 선택할 수 있는 다양한 추가 전략이 내장되어 있습니다. 이러한 전략은 별도의 설정이 필요하지 않으며, 지표가 선택한 전략 모드에 따라 자동으로 설정을 적용합니다. 이 알고리즘은 추가 필터를 사용하여 거래량과 가격 파동을 분석합니다. 지능형 알고리즘을 통해 두 가지 시장 요소가 결합될 때만 신호를 생성합니다. 지표는 특정 범위의 파동을 계산하고, 거래량 분석을 통해 파동을 확인합니다. 구매 후 저에게 연락하시면 거래 팁과 유용한 보너스 지표를 무료로 제공해 드립니다!
추측을 멈추세요. 통계적 우위로 트레이딩을 시작하세요. 주식 지수는 외환과 다르게 거래됩니다. 정해진 세션이 있고, 야간에 갭이 발생하며, 예측 가능한 통계적 패턴을 따릅니다. 이 지표는 DAX, S&P 500, 다우존스와 같은 지수를 자신 있게 거래하는 데 필요한 확률 데이터를 제공합니다. 무엇이 다른가 대부분의 지표는 무엇이 일어났는지 보여줍니다. 이 지표는 다음에 무엇이 일어날 가능성이 있는지 보여줍니다. 매 거래일마다 지표는 100일간의 과거 데이터를 기준으로 현재 설정을 분석합니다. 유사한 갭, 유사한 시가 위치를 가진 날을 찾고, 가격이 주요 레벨에 도달한 빈도를 정확히 계산합니다. 갭이 메워질지, 어제 고점이 테스트될지 더 이상 추측할 필요가 없습니다. 실제 데이터에 기반한 정확한 백분율을 얻게 됩니다. 모든 입력 설명이 포함된 전체 매뉴얼: https://www.mql5.com/en/blogs/post/766370 훌륭한 설정을 찾는 데 도움이 되는 전략 가이드: ht
PZ Day Trading
PZ TRADING SLU
3.67 (3)
Effortless trading: non-repainting indicator for accurate price reversals This indicator detects price reversals in a zig-zag fashion, using only price action analysis and a donchian channel. It has been specifically designed for short-term trading, without repainting or backpainting at all. It is a fantastic tool for shrewd traders aiming to increase the timing of their operations. [ Installation Guide | Update Guide | Troubleshooting | FAQ | All Products ] Amazingly easy to trade It provides
제작자의 제품 더 보기
This indicator determines the average bas size (body, wicks) for the specified range. Input parameters Mode - select the mode of the indicator: HighLow - the indicator calculates the average bar size from High to Low and displays the data in the form of a histogram at the bottom of the terminal OpenClose - the indicator calculates the average bar size from Open to Close and displays the data in the form of a histogram at the bottom of the terminal HLOC - the indicator displays data on the two p
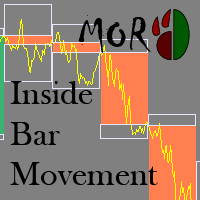
This indicator allows analyzing the movement of prices inside a bar. The indicator draws the contours of the bars of higher timeframes on the current chart. Inputs Value TimeFrame - the timeframe to display bars NumberOfDays - the number of days the indicator calculates Bull_Body - the body color of the bullish bar Bear_Body - the body color of the bearish bar ShadowUp - the color of the upper shadow of the bar ShadowLow - the color of the lower shadow of the bar Selectable - enable/disable the
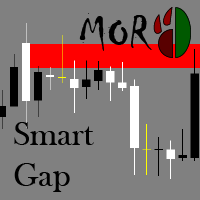
MOR Smart Gap
Vitaliy Sendyaev
The indicator finds and visualizes price gaps, which often can be used as support and resistance levels. It can display levels from different timeframes on one chart. Inputs Value Label - show/hide the timeframe of constructed levels TimeFrame - select timeframe to draw levels from DrawRangeDay - the length of the level in days DrawRangeHour - the length of the level in hours GapSizeForDrawing - a level will be drawn if gap is equal to or larger than this level in points CountDays - the number
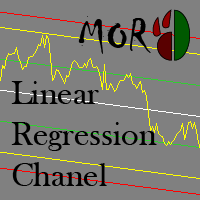
This indicator is designed for plotting the linear regression channel. For convenience, it has multiple operation modes and drawing of data from the selected timeframe. Input parameters Price - the price to be used for calculation and plotting the upper and lower boundaries of the channel PriceHighLow - the value of bar's High and Low PriceOpenClose - the value of bar's Open and Close Mode - indicator operation mode Static - the linear regression channel is always plotted starting from BarStart
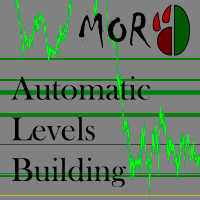
This indicator is designed to automatically build support/resistance levels. The indicator calculates the density of the price distribution in the specified time range and creates a table of volumes for each price. Levels are constructed from the minimum to the maximum volumes specified by the user. Some input parameters can be changed using hot keys without opening the settings window. Inputs StartPoint - start bar number Range - length of the level in bars (time range) VolumeMin - minimum vol
필터:
리뷰 없음
리뷰 답변