EZT MultiTF MACD

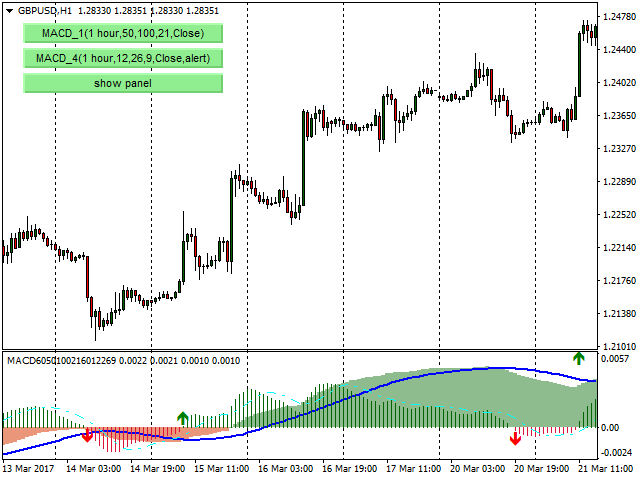
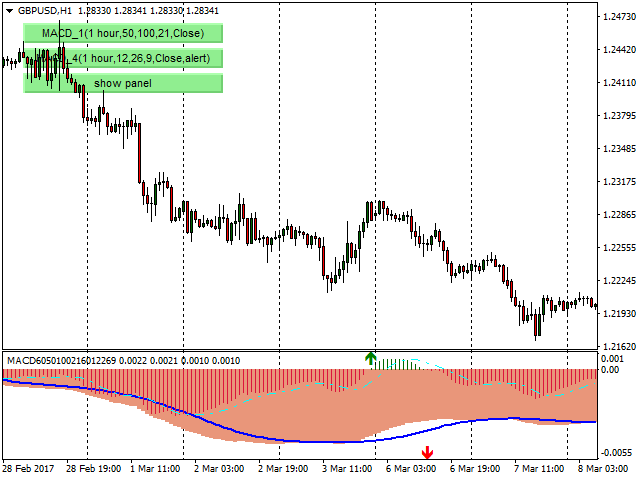
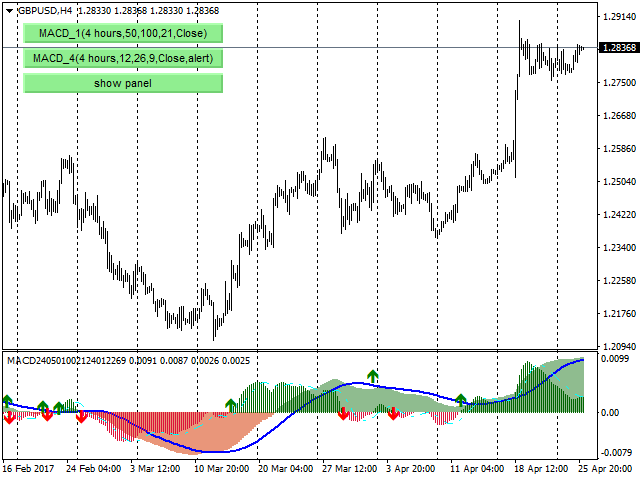
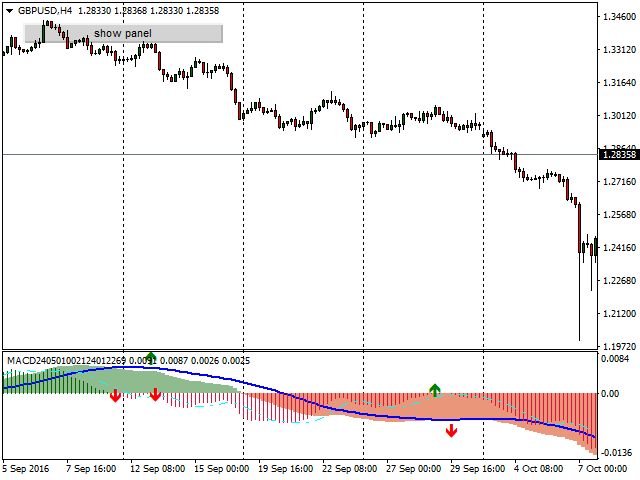
This indicator can display 1 or 2 MACD indicator on different time-frames and settings. Uses EMA for calculation. The active indicators can give visual and sound alert on zero-level-cross if the user choose that option. Alert can be set on one or both active indicator, even if the time-frame, and the period different on each. When alert set to both, the two MACD histogram must be on the same size of the 0 level to get an arrow. There is a display panel with buttons on the main chart, what is show the active indicators and their settings. There is an option to hide this panel. With the buttons temporary you can hide one of the active MACD

Push and email alert added.


Settings description

  • Panel location – The display panel on main chart, which corner you want to see it.
  • Panel size – You can choose normal or large size
  • Panel shift – how far you want the panel from the side
  • Color of active MACD button – active MACD
  • Color of inactive MACD button – active MACD but temporary hidden
  • Use MACD – choose only one or both : true/false
  • MACD time-frame – each MACD can be on a different timeframe
  • Alert – true/false : pop up alert on the arrow.
추천 제품
GGP Wave Trend Oscillator MT4
Mohammadmahmood Pirayeh
The GGP Wave Trend Oscillator MT4   Indicator is a volatility and momentum tool designed to help traders optimize their trading performance and providing traders find the most accurate market reversals. This indicator is MT4 conversion of the Indicator: WaveTrend Oscillator [WT] by “ LazyBear “ in Trading View website and some alert methods are added to provide real-time alerts when a trading signal is generated, in order to allow traders to act quickly and efficiently. When the oscillator is ab
FXC iMACD-DivergencE MT4 Indicator This is an advanced MACD indicator that finds trend-turn divergences on the current symbol. The indicator detects divergence between the MACD and the price movements as a strong trend-turn pattern. Main features: Advanced divergence settings Price based on Close, Open or High/Low prices Give Buy/Sell open signals PUSH notifications E-mail sending Pop-up alert Customizeable Information panel Input parameters: MACD Fast-EMA: The Fast-EMA variable of the MACD indi
MT4용 Crypto_Forex 지표 "FORCE 지수 및 2개 이동 평균". 리페인트 불필요. - 이 지표는 추세 방향의 모멘텀 트레이딩에 매우 유용합니다. - "FORCE 지수 및 2개 이동 평균" 지표를 사용하면 Force 지수의 빠르고 느린 이동 평균을 확인할 수 있습니다. - Force 지수는 가격과 거래량 데이터를 단일 값으로 결합하는 최고의 지표 중 하나입니다. - Force 지수 자체는 가격 변동에 사용된 파워의 양을 측정하는 강력한 오실레이터입니다. - 지표는 추세 변화를 매우 조기에 확인할 수 있는 기회를 제공합니다. - 이 지표는 매개변수를 통해 매우 쉽게 설정할 수 있으며, 모든 시간대에서 사용할 수 있습니다. - 그림에서 매수 및 매도 진입 조건을 확인할 수 있습니다. 여기를 클릭하여 고품질 트레이딩 로봇과 지표를 확인하세요! MQL5 웹사이트에서만 제공되는 오리지널 제품입니다.
Signal trend indicator. Detects the direction of the trend and is coloured accordingly.  Has built in audible and visual alerts when trends change. Can send notifications to your phone or email. Allows Trend and Counter-Trend trading. Works on all timeframes, all currency pairs, metals, indices and cryptocurrencies. Can be used with binary options. Distinctive features No re-drawing; Simple and clear settings; Four types of alerts; Works on all timeframes and all trading tools; Suitable
The Supernatural channel is determined using a special algorithm, marker points are used to determine the movement of the channel. The Supernatural channel consists of two lines, red and blue, that make up the channel. Simple, visual and efficient use. Can be used for intra-channel trading. The indicator does not redraw and does not lag. Works on all currency pairs and on all timeframes.
Skalpex
Andrey Kozak
Skalpex is a system indicator for wave diagnostic analysis of the early phases of a market condition. The indicator lags exactly 1 bar. It shows the exact price reversals, does not redraw its values, but is 1 bar late. This is due to the fact that the last (zero bar) has not yet been formed before closing, which means that no one ever knows where it will go exactly and where it will close. We can assume. In order not to try to play fortune-telling, the Skalpex indicator is late by one candle an
MACD Color
Dmitriy Moshnin
MACD Color ( please see the description and video ) is an indicator for the MetaTrader 4 trading platform that is similar to MACD Message . Unlike the standard indicator, it changes the bar edge color when there is a change in the market situation - a change in the trend strength or a change in the inclination of the main EMA which represents the zero level - it changes the color of the zero level (this parameter can be disabled in the settings). Take a look at how the indicator can be used in a
The Stochastic Oscillator is a momentum indicator that uses support and resistance levels. The term "stochastic" refers to the point of a current price in relation to its price range over a period of time. You can use a New Stochastic in the same way as classical one: Overbought and Oversold areas to make a Buy or Sell orders. This new indicator shows all variety of Fibonacci Levels (from 23.6 to 76.4) which can be used as Overbought and Oversold levels as well as points to close an open positio
DayTradeKing
Thomas Bradley Butler
This indicator is good for small time frames like 1 and 5 minutes and made for day trading. The indicator never repaints or recalculates. The indicator works is for trading swing points in day trading, following bulls or bears.  Its a simple to use, non cluttered indicator with a high success rate.  This indicator works well to capture ranges.  All indicators come with limitations and no indicator or system is always accurate. Use money management for long term trading success.   Place in backte
FW 2WPR MTF
Sergey Zhukov
Indicator based trading according to the price analysis of bars, the most popular among traders. The indicators calculated based on larger periods are used for identification of a stable trend on the market, and the ones calculated based on smaller periods are used for entering the market after a correction. The oscillators with overbought and oversold levels have a special place in indicator-based trading. The values of such indicators are subjected to wave structure - the higher waves (chart t
PipFinite Binary Options PRO
Karlo Wilson Vendiola
4.45 (29)
This LEGIT Indicator Can Accurately Predict the Outcome of One Bar. Imagine adding more filters to further increase your probability! Unlike other products, Binary Options PRO can analyze past signals giving you the statistical edge. How Increase Your Probability Information revealed here www.mql5.com/en/blogs/post/727038 NOTE: The selection of a Good Broker is important for the overall success in trading Binary Options. Benefits You Get Unique algorithm that anticipates price weakness. Gene
Manual Zone Lines Pro는 MT4 차트에서 수동 가격 구간과 오른쪽으로 연장되는 라인을 만들 수 있는 차트 보조 도구입니다. 멀티 타임프레임 표시와 알림 기능도 함께 사용할 수 있습니다. MT4의 기본 수평선과 달리, 이 도구로 만든 라인은 왼쪽으로 무한히 연장되지 않습니다. 라인을 만든 지점에서 시작해 오른쪽의 최신 캔들 부근까지 연장되므로, 차트가 더 깔끔해지고 라인을 어디서부터 그었는지 쉽게 확인할 수 있습니다. 가격 구간도 버튼 한 번으로 만들 수 있습니다. 생성한 구간과 라인은 최신 캔들 부근까지 자동으로 연장되기 때문에, 오른쪽 끝을 반복해서 수동으로 조정할 필요가 없습니다. Pro 버전에서는 최대 2개의 구간과 2개의 라인을 만들 수 있습니다. 또한 멀티 타임프레임 표시를 지원하므로, 한 시간대에서 만든 구간과 라인을 다른 시간대에서도 볼 수 있습니다. 예를 들어 M1에서 만든 구간과 라인을 M5에서 표시할 수 있습니다. Manual Zone Lines P
Infinity Trend Pro
Yaroslav Varankin
1 (1)
This is a trend indicator without redrawing Developed instead of the binary options strategy (by the color of the Martingale candlestick) Also works well in forex trading When to open trades (binary options) A signal will appear in the place with a candle signaling the current candle It is recommended to open a deal for one candle of the current timeframe M1 and M5 When a blue dot appears, open a deal up When a red dot appears, open a trade down. How to open trades on Forex. When a signal is rec
EZZ Zig Zag MT4
Paulo Rocha
5 (1)
EZZ Elite Zig Zag is an indicator for the MetaTrader 4 terminal. This indicator traces the peak of the trend based on the market reversal, thus showing various opportunities in the financial market. EZZ Elite Zig Zag is a visual tool, intuitive, and easy to understand and use.  Test it Yourself by Downloading it for Free. Author Paulo Rocha all rights reserved
You can avoid constant monitoring of computer screen waiting for the DeMarker signal while receiving push notifications to a mobile terminal or a sound alert on the screen about all required events, by using this indicator - DeMarker Alerts. In fact, it is the replacement of the standard indicator with which you will never miss the oscillator signals. If you don't know the benefits of DeMarker or how to use it, please read here . If you need signals of a more popular RSI indicator, use RSI Alert
Trade with Gann on your side!! MASTER CIRCLE 360 CIRCLE CHART, originally created by Gann admitted that this is “The Mother of all charts”. It is one of the last studies that this great trader left for us. The numeric tab le is apparently quite simple like all the tables and is based on square numbers, the SQUARE OF 12 and is by evolution, one of the most important square numbers. Here we can find CYCLE, PRICE AND TIME thanks to angles and grades, to show past and future support and resistance.
Smart trends
Yvan Musatov
Smart indicator Smart trend allows you to find the most likely trend reversal points. You will not find this indicator anywhere else. A simple but effective system for determining the forex trend. From the screenshots you can see for yourself the accuracy of this tool. Works on all currency pairs, stocks, raw materials, cryptocurrencies. This is a trend indicator for the MetaTrader 4 trading platform. The alert system (alert, email notifications) will help you monitor several trading instrumen
Signal Finding
Maryna Shulzhenko
Signal Finding is a trend indicator, a technical analysis tool that helps to determine the exact direction of a trend: either an upward or a downward movement of the price of a trading instrument. Although these indicators are a little late, they are still the most reliable signal that a trader can safely rely on. Determining the market trend is an important task for traders. With this indicator, you can predict future values. But the main application of the indicator is to generate buy and sel
FXC iDeM-DivergencE MT4 Indicator This is an advanced DeMarker indicator that finds trend-turn divergences on the current symbol. The indicator detects divergence between the DeMarker and the price movements as a strong trend-turn pattern. Main features: Advanced divergence settings Price based on Close, Open or High/Low prices Give Buy/Sell open signals PUSH notifications E-mail sending Pop-up alert Customizeable Information panel Input parameters: DeM Period: The Period size of the DeMarker in
This indicator is based on the MACD on one or more timeframes and on any Currency Cross Pair. The indicator generates an alert message when it detects a buy or sell signal. It also draws a vertical bar on the price chart: green for buy or red for sell, yellow if flat. Alert messages and Vertical bars for BUY or SELL, are generated when the MACD is consistent for all chosen timeframes else a FLAT signal is generated. Features Easy flexible settings: Detection of the MACD signal for one or more t
Forex Gump
Andrey Kozak
2.4 (5)
Forex Gump is a fully finished semi-automatic trading system. In the form of arrows, signals are displayed on the screen for opening and closing deals. All you need is to follow the instructions of the indicator. When the indicator shows a blue arrow, you need to open a buy order. When the indicator shows a red arrow, you need to open a sell order. Close orders when the indicator draws a yellow cross. In order to get the most effective result, we recommend using the timeframes H1, H4, D1. There
Portfolio X Ray Pro
Alexandru Craciun
Portfolio X-Ray Pro: Stop Trading Blind. See Your True Risk. Do you know exactly how much exposure you have on USD right now? Or Gold? If you have 10 different trades open, calculating your total risk per symbol is a nightmare. A mental mistake here can blow an account. Portfolio X-Ray Pro solves this instantly. It aggregates every single open order, sorts them by volume, and presents your true net exposure in a stunning, professional dashboard that now collapses into a sleek, minimalist arro
PABT Pattern Indicator - it's classical system one of the signal patterns. Indicator logic - the Hi & Lo of the bar is fully within the range of the preceding bar, look to trade them as pullback in trend. In the way if indicator found PABT pattern it's drawing two lines and arrow what showing trend way.  - First line - it's entry point and drawing at: 1. On the high of signal bar or on middle of the signal bar (depending from indicator mode) for buy; 2. On the low of signal bar or on middle of t
The Candlestick Pattern Detector is an advanced MetaTrader 4 indicator designed to identify and highlight candlestick patterns on your charts. Currently, the indicator detects one specific candlestick pattern - the pinbar, known for its significance in technical analysis and trading strategies. This tool provides traders with visual cues, making it easier to spot potential market reversals or continuations. Features: Customizable Colors: Users can customize the colors of the bullish and bearish
Heiken Ashi Smoothed Strategy is a very simple but powerful system to get forex market trend direction. This indicator is actually 2 indicators in 1 pack, Heiken Ashi and Heiken Ashi Smoothed Moving Average both included. Because HA (Heiken Ashi) and HAS (Heiken Ashi Smoothed) are calculated in the same one system event with necessary buffers and loop only, so it is the FAST, OPTIMIZED and EFFICIENT HA having the combined indicator of MetaTrader 4. You can choose to display HA and HAS in the sam
The Th3Eng PipFinite indicator is based on a very excellent analysis of the right trend direction with perfect custom algorithms. It show the true direction and the best point to start trading. With StopLoss point and Three Take Profit points. Also it show the right pivot of the price and small points to order to replace the dynamic support and resistance channel, Which surrounds the price. And Finally it draws a very helpful Box on the left side on the chart includes (take profits and Stop loss
Trend Oscillator mw
DMITRII GRIDASOV
Trend Oscillator - 고급 맞춤형 Crypto_Forex 지표, 효율적인 거래 도구입니다! .......................................................................................... - 고급 새로운 계산 방법 사용 - 매개변수 "계산 가격"에 대한 20가지 옵션. - 지금까지 개발된 가장 매끄러운 오실레이터. - 상승 추세는 녹색, 하락 추세는 빨간색. - 과매도 값: 5 미만, 과매도 값: 95 이상. - 이 지표로 표준 전략도 업그레이드할 수 있는 기회가 많습니다. - PC 및 모바일 알림. .................................................................... 여기를 클릭하여 고품질 트레이딩 로봇과 지표를 확인하세요! 이 MQL5 웹사이트에서만 제공되는 오리지널 제품입니다.
Supply and Demand zones
Makarii Gubaydullin
공급/수요 구역: 과거에 가격이 여러 번 접근한 관찰 가능한 영역. 다기능 유틸리티:  66+ 기능, 이 인디케이터 포함  |   문의 사항이 있으면 저에게 연락   |  MT5 버전 이 인디케이터는 가격이 다시 반전될 가능성이 있는 곳을 보여줍니다. 일반적으로 가격이 해당 수준에서 거부된 횟수가 많을수록 그 수준은 더 중요합니다. 입력 설정에서   조정할 수 있습니다: 약한 구역 을 활성화 또는 비활성화합니다; 구역 설명 을 표시하거나 숨깁니다; 폰트 크기; 기본 색상 을 설정: 지원과 저항에 대해 별도로: 선택한 색상은 약한 구역에서 덜 강렬하여 차트를 시각적으로 분석하는 데 도움이 됩니다; 수요와 공급 지대 는 가격 차트에서 이전에 상당한 매수(수요) 또는 매도(공급)가 발생한 주요 영역입니다. 이러한 지대는 트레이더가 가격 움직임의 잠재적 반전 또는 지속 을 예측하는 데 도움이 됩니다. 수요와 공급 트레이딩은 추세선, 이동 평균 또는 오더 플로우 분석과 같은 다른 도구와 결
Осциллятор   Чайкина   ( Chaikin   Oscillator ) — это индикатор импульса, созданный Марком   Чайкиным , и, очевидно, индикатор назван в честь своего создателя. Он измеряет импульс линии распределения и накопления, используя формулу схождения-расхождения скользящих средних (MACD). На основе данных об этом импульсе мы можем получить представление о направленных изменениях в линии распределения и накопления.
The indicator displays the data of the Stochastic oscillator from a higher timeframe on the chart. The main and signal lines are displayed in a separate window. The stepped response is not smoothed. The indicator is useful for practicing "manual" forex trading strategies, which use the data from several screens with different timeframes of a single symbol. The indicator uses the settings that are identical to the standard ones, and a drop-down list for selecting the timeframe. Indicator Paramet
이 제품의 구매자들이 또한 구매함
Neuro Poseidon MT4
Daria Rezueva
4.95 (37)
Neuro Poseidon is a new indicator by Daria Rezueva. It combines precise trading signals with adaptive TP/SL levels - creating best possible trades as a result! Message me and get  Neuro Poseidon Assistant  as a gift to automize your trading process! What makes it stand out? 1. Proven profitability on all assets and timeframes 2. Only confirmed BUY and SELL signals present on the chart 3. Adaptive TP & SL levels generated by the software for each trade 4. Easy to understand - suitable for all
Gann Made Easy
Oleg Rodin
4.84 (165)
Gann Made Easy 는 mr.의 이론을 사용하여 최고의 거래 원칙을 기반으로 하는 전문적이고 사용하기 쉬운 Forex 거래 시스템입니다. W.D. 간. 이 표시기는 Stop Loss 및 Take Profit Levels를 포함하여 정확한 BUY 및 SELL 신호를 제공합니다. PUSH 알림을 사용하여 이동 중에도 거래할 수 있습니다. 구매 후 거래 방법 안내 및 유용한 추가 지표를 무료로 받으시려면 저에게 연락주세요! 아마도 Gann 거래 방법에 대해 이미 여러 번 들었을 것입니다. 일반적으로 Gann의 이론은 초보자 거래자뿐만 아니라 이미 거래 경험이 있는 사람들에게도 매우 복잡한 것입니다. Gann의 거래 방식은 이론적으로 적용하기 쉽지 않기 때문입니다. 나는 그 지식을 연마하고 Forex 지표에 최고의 원칙을 적용하기 위해 몇 년을 보냈습니다. 표시기는 적용하기가 매우 쉽습니다. 차트에 첨부하고 간단한 거래 권장 사항을 따르기만 하면 됩니다. 지표는 지속적으로 시장 분석
Trend Catcher ind
Ramil Minniakhmetov
5 (3)
트렌드 캐처 인디케이터 트렌드 캐처 인디케이터는 개발자가 자체 개발한 맞춤형 적응형 트렌드 분석 지표들을 조합하여 시장 가격 움직임을 분석합니다. 단기적인 노이즈를 제거하고 근본적인 모멘텀 강도, 변동성 확대, 가격 구조 움직임에 집중하여 진정한 시장 방향을 파악합니다. 또한 이동 평균, RSI, 변동성 필터와 같은 맞춤형 지표들을 활용하여 가격을 평활화하고 트렌드를 필터링합니다. 실제 운영 모니터링 및 기타 제품은 다음 링크에서 확인하실 수 있습니다: https://www.mql5.com/en/users/mechanic/seller 텔레그램에서는 EA나 설정 파일을 판매하지 않습니다. 사기이니 주의하세요. 모든 설정 파일은 블로그에서 무료로 제공됩니다. 중요! 구매 후 즉시 연락 주시면 사용 방법 및 보너스를 드립니다!
Dynamic Forex28 Navigator
Bernhard Schweigert
4.43 (7)
Dynamic Forex28 Navigator - 차세대 외환 거래 도구. 현재 49% 할인. Dynamic Forex28 Navigator는 오랫동안 인기 있는 지표의 진화형으로, 세 가지의 힘을 하나로 결합했습니다. 고급 통화 Strength28 지표(695개 리뷰) + 고급 통화 IMPULSE with ALERT(520개 리뷰) + CS28 콤보 신호(보너스). 지표에 대한 자세한 정보 https://www.mql5.com/en/blogs/post/758844 차세대 Strength 지표는 무엇을 제공합니까?  원래 지표에서 좋아했던 모든 것이 새로운 기능과 더 높은 정확도로 강화되었습니다. 주요 기능: 독점적인 통화 Strength 공식.  모든 시간대에 걸쳐 부드럽고 정확한 강도선. 추세와 정확한 진입을 식별하는 데 이상적입니다. 역동적인 시장 피보나치 수준(시장 피보나치).  이 지표에만 있는 고유한 기능. 가격 차트가 아닌 통화 강도에 피보나치가 적용됩니다.
M1 Sniper
Oleg Rodin
5 (24)
M1 SNIPER 는 사용하기 쉬운 거래 지표 시스템입니다. M1 시간대에 맞춰 설계된 화살표 지표입니다. 이 지표는 M1 시간대 스캘핑을 위한 단독 시스템으로 사용할 수 있으며, 기존 거래 시스템의 일부로도 사용할 수 있습니다. 이 거래 시스템은 M1 시간대 거래용으로 특별히 설계되었지만, 다른 시간대에도 사용할 수 있습니다. 원래는 XAUUSD와 BTCUSD 거래를 위해 이 방법을 설계했지만, 다른 시장 거래에도 유용하다는 것을 알게 되었습니다. 이 지표의 신호는 추세 방향과 반대로 거래될 수 있습니다. 저는 지표의 신호를 활용하여 양방향으로 거래할 수 있도록 돕는 특별한 거래 기법을 알려드립니다. 이 방법은 특별한 동적 지지선과 저항선 가격 영역을 활용하는 것을 기반으로 합니다. 구매하시면 M1 SNIPER 화살표 지표를 바로 다운로드하실 수 있습니다. 또한, 아래 스크린샷에 표시된 Apollo Dynamic SR 지표는 M1 SNIPER 도구를 사용하는 모든 사용자에게 무료로
MetaBands M4
Vahidreza Heidar Gholami
3.5 (6)
MetaBands uses powerful and unique algorithms to draw channels and detect trends so that it can provide traders with potential points for entering and exiting trades. It’s a channel indicator plus a powerful trend indicator. It includes different types of channels which can be merged to create new channels simply by using the input parameters. MetaBands uses all types of alerts to notify users about market events. Features Supports most of the channel algorithms Powerful trend detection algorith
이 제품은 2026년 시장에 맞게 업데이트되었으며 최신 MT5 빌드에 최적화되었습니다. 가격 업데이트 안내: Smart Trend Trading System은 현재 $99 에 제공됩니다. 다음 30회 구매 후 가격은 $199 로 인상됩니다. 특별 혜택: Smart Trend Trading System 구매 후 저에게 개인 메시지를 보내시면 Smart Universal EA를 무료 로 받을 수 있으며, Smart Trend 신호를 자동 거래로 전환할 수 있습니다. Smart Trend Trading System은 리페인트 없음, 재그리기 없음, 지연 없음의 완전한 트레이딩 시스템으로, 더 깨끗한 신호, 더 나은 추세 방향, 그리고 더 체계적인 시장 거래 방식을 원하는 트레이더를 위해 제작되었습니다. Online course , manual and download presets . 이 시스템은 추세 감지, 반전 구간, Smart Cloud, 트레일링 스톱 로직, 지지와 저항, 캔들 색
Advanced Supply Demand
Bernhard Schweigert
4.91 (300)
현재 30% 할인! 초보자나 전문 트레이더를 위한 최고의 솔루션! 이 보조지표는 우리가 다수의 독창적 기능과 새로운 공식을 통합한 독특하고 고품질이며 저렴한 거래 도구입니다. 이 업데이트를 통해 이중 시간대를 표시할 수 있습니다. 더 높은 TF를 표시할 수 있을 뿐만 아니라 차트 TF와 더 높은 TF 모두를 표시할 수 있습니다: 중첩 영역 표시. 모든 Supply Demand 트레이더들이 좋아할 것입니다. :) 중요한 정보 공개 Advanced Supply Demand의 잠재력을 극대화하려면 다음을 방문하십시오. https://www.mql5.com/ko/blogs/post/720245   진입 또는 목표의 명확한 트리거 포인트를 정확히 찾아냄으로 해서 거래가 어떻게 개선될지 상상해 보십시오. 새로운 알고리즘을 기반으로 매수자와 매도자 간의 잠재적인 불균형을 훨씬 더 쉽게 분간할 수 있습니다. 왜냐하면 가장 강한 공급영역과 가장 강한 수요 영역과 과거에 어떻게 진행 되었는지를(이전
Scalper Inside PRO
Alexey Minkov
4.68 (69)
Scalper Inside PRO Scalper Inside PRO is an intraday trend and scalping indicator that uses exclusive built-in algorithms to evaluate market direction and key target levels. The indicator automatically calculates entry and exit points and several profit target levels, and it shows detailed performance statistics, so you can see how different instruments and strategies behaved on historical data. This helps you select instruments that fit current market conditions. You can also connect your own a
Genesis Matrix Pro is a professional multi-timeframe trend detection indicator designed to help traders identify high-quality market alignment with clarity and structure. It combines 12 different technical indicators into one visual alignment matrix, allowing traders to quickly see when market conditions are bullish, bearish, or neutral. A signal is generated only when the selected strategies are aligned, helping reduce noise and improve decision-making. PLEASE CONTACT ME AFTER PURCHASE TO GET
간 스퀘어 지표는 W.D. 간이 쓴 "시장 예측을 위한 수학적 공식" 기사에 기반한 강력한 시장 분석 도구입니다. 이 도구는 수학적 개념과 간 이론을 사용하여 정확한 시장 분석을 수행합니다. 144, 90, 52의 제곱과 9의 제곱을 사용합니다. 또한 의 9의 제곱근 및 해당 제곱의 채널 및 스타 패턴과의 관련성을 통합합니다. 사용자 메뉴얼 및 적용: 이 지표를 사용하기 전에 사용자 메뉴얼을 읽고 질문이 있을 경우 문의하시기 바랍니다. 전체 메뉴얼은 웹사이트에서 제공됩니다. MT5의 전체 버전을 구매하거나 MT4의 무료 버전을 테스트할 수 있습니다. 두 버전 모두 링크에서 확인하실 수 있습니다. 주요 기능 및 기능: 간 스퀘어 지표는 정확한 결정을 위해 기하학적 개념과 간 이론을 활용하는 시장 분석을 위한 포괄적인 도구 집합을 제공합니다. 주요 기능은 다음과 같습니다. 9의 제곱 분석: 이 지표는 9의 제곱에 대한 수평 선, 스타 패턴, 그리드 및 간 팬을 그릴 수 있습니다. 간 이
Breakout Arrows Mt4
Michael Oko Oboh
5 (1)
Trend Breakout Arrows Indicator The Trend Breakout Arrows Indicator is a momentum-based signal tool designed to identify potential bullish and bearish breakout opportunities. It displays clear arrow signals directly on the price chart, helping traders quickly recognize possible trend changes and continuation setups. Up Arrow (Buy Signal) A magenta up arrow appears below a candle when bullish momentum begins to strengthen. This signal indicates that buying pressure may be overtaking selling press
Neo Wave PRO
Nikolay Raykov
5 (1)
Price & Time Market Structure Indicator A professional market structure tool that analyzes waves through both price and time — not price alone. Main Description NeoWave PRO is a professional market structure indicator for MetaTrader 4 designed for traders who want to move beyond traditional one-dimensional wave tools such as ZigZag, swing indicators, and basic high/low systems. Most wave indicators analyze only one thing: Price. But a real market wave is not only a price movement. A true wave de
BTMM State Engine Pro MT4
Garry James Goodchild
BTMM State Engine Pro is a MetaTrader 4 indicator for traders who use the Beat The Market Maker approach: Asian session context, kill zone timing, level progression, peak formation detection, and a multi-pair scanner from a single chart. It combines cycle state logic with a built-in scanner dashboard so you do not need the same tool on many charts at once. What it does Draws the Asian session range; session times can follow broker server offset or be set in inputs. Tracks level progression (L
GOLD Impulse with Alert
Bernhard Schweigert
4.67 (12)
이 지표는 Advanced Currency IMPULSE with ALERT  +   Currency Strength Exotics  의 2가지 제품의 슈퍼 조합입니다. 그것은 모든 시간 프레임에 대해 작동하며 8개의 주요 통화와 하나의 기호에 대한 강약의 충동을 그래픽으로 보여줍니다! 이 표시기는 금, 이국적인 쌍, 상품, 지수 또는 선물과 같은 기호에 대한 통화 강도 가속을 표시하는 데 특화되어 있습니다. 금, 은, 오일, DAX, US30, MXN, TRY, CNH 등의 진정한 통화 강도 가속(충동 또는 속도)을 표시하기 위해 9번째 줄에 모든 기호를 추가할 수 있습니다. 새로운 기본 알고리즘을 기반으로 구축되어 잠재적인 거래를 훨씬 더 쉽게 식별하고 확인할 수 있습니다. 이는 통화의 강세 또는 약세가 가속되는지 여부를 그래픽으로 표시하고 가속 속도를 측정하기 때문입니다. 자동차의 속도계처럼 생각하면 됩니다. 가속화할 때 Forex 시장에서 동일한 일이 분명히 더 빠르
PRO Renko System
Oleg Rodin
5 (30)
PRO Renko System 은 RENKO 차트 거래를 위해 특별히 고안된 매우 정확한 거래 시스템입니다. 이것은 다양한 거래 상품에 적용될 수있는 보편적 인 시스템입니다. 체계는 효과적으로 당신에게 정확한 반전 신호에 접근을 주는 소위 시장 소음을 중화합니다. 이 표시기는 사용하기가 매우 쉽고 신호 생성을 담당하는 매개 변수가 하나만 있습니다. 당신은 쉽게 당신의 선택의 어떤 무역 계기에 공구를 적응시킬 수 있고 renko 막대기의 크기. 나는 항상 당신이 내 소프트웨어로 수익성있게 거래 할 수 있도록 추가 지원을 제공 할 준비가되어 있습니다! 나는 당신에게 행복하고 수익성있는 거래를 기원합니다! 구매 후 저에게 연락하십시오! 내 렌코 차트 생성기를 보내드립니다. 또한 내 개인 권장 사항 및 시스템의 다른 모듈을 무료로 공유 할 것입니다!
Advanced Currency Strength28 Indicator
Bernhard Schweigert
4.91 (657)
현재 40% 할인 초보자 또는 전문가 트레이더를 위한 최고의 솔루션! 이 지표는 우리가 독점 기능과 새로운 공식을 통합했기 때문에 독특하고 고품질이며 저렴한 거래 도구입니다. 단 하나의 차트로 28 Forex 쌍의 통화 강도를 읽을 수 있습니다! 새로운 추세 또는 스캘핑 기회의 정확한 트리거 포인트를 정확히 찾아낼 수 있기 때문에 거래가 어떻게 개선될지 상상해 보십시오. 사용 설명서: 여기를 클릭  https://www.mql5.com/en/blogs/post/697384 그것이 첫 번째, 원본입니다! 쓸모없는 지망생 클론을 사지 마십시오. 더 스페셜  강력한 통화 모멘텀을 보여주는 하위 창의 화살표 GAP가 거래를 안내합니다! 기본 또는 호가 통화가 과매도/과매도 영역(외부 시장 피보나치 수준)에 있을 때 개별 차트의 기본 창에 경고 표시가 나타납니다. 통화 강도가 외부 범위에서 떨어질 때 풀백/반전 경고. 교차 패턴의 특별 경고 추세를 빠르게 볼 수 있는 다중 시간
The indicator scans for Dinapoli thrust pattern in multiple timeframes for the all markets filtered and shows the results on Dashboard. Key Features Dashboard can be used for all markets It can scan for thrust pattern on MN1, W1, D1, H4, H1, M30, M15 ,M5, M1 timeframes Ability to choose number of bars required above/below displaced moving average to define thrust Parameters UseMarketWatch: Set true to copy all symbols available in market watch MarketWatchCount : Set the number of symbols that
이 지표는 실제 거래에 완벽한 자동 파동 분석 지표입니다! 사례... 참고:   웨이브 그레이딩에 서양식 이름을 사용하는 데 익숙하지 않습니다. Tang Lun(Tang Zhong Shuo Zen)의 명명 규칙의 영향으로 기본 웨이브를   펜   으로 명명하고 2차 웨이브 밴드를   세그먼트   로 명명했습니다. 동시에, 세그먼트에는 추세 방향이 있습니다.   주요 추세 세그먼트에는   이름이 지정되지만(이 이름 지정 방법은 향후 노트에서 사용됩니다. 먼저 말씀드리겠습니다.) 알고리즘은 굴곡 이론과 거의 관련이 없으므로 그렇게 해서는 안 됩니다. 이는 나의 시장 분석을   통해 요약된 끊임없이 변화하고 복잡한 운영 규칙을   반영합니다. 밴드는 더 이상 사람마다 다르지 않도록 표준화되고 정의되었습니다. 인위적인 간섭의 드로잉 방법은 시장 진입을 엄격하게 분석하는 데 핵심적인 역할을 합니다. 이 지표를 사용하는 것은 거래 인터페이스의 미학을 개선하고 원래의 K-line 거래를
Harmonic Pattern Plus MT4
Young Ho Seo
4.44 (18)
Introduction Harmonic Patterns are best used to predict potential turning point. Traditionally, Harmonic Pattern was identified manually connecting peaks and troughs points in the chart. Manual harmonic pattern detection is painfully tedious and not suitable for everyone. You are often exposed under subjective pattern identification with manual pattern detection. To avoid these limitations, Harmonic Pattern Plus was designed to automate your harmonic pattern detection process. The functionality
Current event:  https://c.mql5.com/1/326/A2SR2025_NoMusic.gif A. A2SR이란 무엇입니까 ?   * 선행 기술 지표입니다(재도장 없음, 지연 없음). -- 안내 : https://www.mql5.com/en/blogs/post/734748/page4#comment_16532516 -- 및 https://www.mql5.com/en/users/yohana/blog A2SR에는 지원(수요) 및 저항(공급) 수준을 결정하는 특별한 기술이 있습니다. 우리가 인터넷에서 본 일반적인 방식과 달리 A2SR은 실제 SR 수준을 결정하는 독창적인 개념을 가지고 있습니다. 원래 기술은 인터넷에서 가져온 것이 아니며 인터넷에 게시된 적도 없습니다. A2SR은 거래 스타일에 따라 SR 수준을 자동으로 선택합니다. 시간 프레임을 변경해도 SR 레벨은 그대로 유지됩니다. 사용하는 시간 프레임에서 실제 SR을 얻지 못하기 때문입니다. A2SR은 거래를
KT Alpha Hunter Arrows MT4
KEENBASE SOFTWARE SOLUTIONS
대부분의 화살표 지표는 신호만 보여주고, 나머지 판단은 모두 트레이더에게 맡깁니다. KT Alpha Hunter Arrows는 완성된 트레이딩 플랜을 함께 제공합니다. 각 신호 화살표가 표시될 때마다 차트에는 진입 라인, 손절선, 네 개의 익절 목표, 그리고 현재 종목과 시간대가 지금 거래할 만한 가치가 있는지 알려주는 실시간 엣지 판정이 함께 그려집니다. 포함된 Trade Manager EA는 사용자가 수동으로 진입한 이후의 실행 관리를 맡아, 시장이 흔들리고 감정이 개입되기 쉬운 순간에도 거래 원칙을 유지할 수 있도록 돕습니다. 리페인트 없음. 확정된 캔들 기준 신호만 표시. Forex, 골드, 지수, 그리고 사용자가 거래하는 모든 상품을 위해 설계되었습니다. 주요 기능 캔들이 마감된 후에만 표시되는 비리페인트 매수 및 매도 화살표. 각 신호마다 진입 라인, 구조적 손절선, 네 개의 익절 목표 제공. Edge Dashboard가 현재 차트의 매수와 매도 셋업을 별도로 평가. 판
Market Structure Patterns MT4
Samuel Manoel De Souza
5 (18)
Market Structure Patterns   is an indicator based on   smart money concepts   that displays   SMC/ICT   elements that can take your trading decisions to the next level. Take advantage of the   alerts ,   push notifications   and   email messages   to keep informed from when an element is formed on the chart, the price crosses a level and/or enters in a box/zone. Developers can access the values of the elements of the indicator using the   global variables  what allows the automation of trading d
PZ ABCD Retracement
PZ TRADING SLU
4 (5)
Identify precise entry and exit points with AB=CD patterns This indicator finds AB=CD retracement patterns. The AB=CD Retracement pattern is a 4-point price structure where the initial price segment is partially retraced and followed by an equidistant move from the completion of the pullback, and is the basic foundation for all harmonic patterns. [ Installation Guide | Update Guide | Troubleshooting | FAQ | All Products   ] Customizable pattern sizes Customizable AC and BD ratios Customizable b
Trend Lines PRO
Roman Podpora
5 (1)
트렌드 라인즈 프로       이 지표는 시장이 실제로 어떤 방향으로 전환되는지 파악하는 데 도움이 됩니다. 실제 추세 반전 지점과 주요 시장 참여자들이 다시 진입하는 지점을 보여줍니다. 보시다시피       BOS 라인       복잡한 설정이나 불필요한 노이즈 없이 더 높은 시간대의 추세 변화와 주요 레벨을 확인할 수 있습니다. 신호는 차트에 다시 그려지지 않고 캔들이 마감된 후에도 계속 표시됩니다. VERSION MT 5   -   RFI LEVELS PRO   표시기   와 결합할 때 최대 잠재력을 발휘합니다. 지표가 보여주는 내용: 실제 변화       추세(BOS 라인) 한 번 신호가 나타나면 그 신호는 계속 유효합니다! 이는 신호를 발생시킨 후 변경될 수 있는 리페인팅 방식의 지표와 중요한 차이점입니다. 리페인팅 방식의 지표는 잠재적으로 자금 손실로 이어질 수 있습니다. 이제 더욱 높은 확률과 정확도로 시장에 진입할 수 있습니다. 또한 화살표가 나타난 후 목표가(익절)
Legacy of Gann
Pavel Zamoshnikov
4.83 (12)
The indicator very accurately determines the levels of the possible end of the trend and profit fixing. The method of determining levels is based on the ideas of W.D.Gann, using an algorithm developed by his follower Kirill Borovsky. Extremely high reliability of reaching levels (according to K. Borovsky  - 80-90%) Indispensable for any trading strategy – every trader needs to determine the exit point from the market! Precisely determines targets on any timeframes and any instruments (forex, met
RFI levels PRO
Roman Podpora
5 (1)
이 지표는 추세 반전 지점과 가격 반등 영역을 정확하게 보여줍니다.       주요 투자자들   . 새로운 트렌드가 형성되는 곳을 파악하고 최대한 정확하게 의사결정을 내리며 모든 거래를 완벽하게 통제합니다. TREND LINES PRO   지표와 함께 사용할 때 최대의 잠재력을 발휘합니다.  VERSION MT5 지표가 보여주는 내용: 새로운 추세의 시작 시 활성화되는 반전 구조 및 반전 수준. 최소한의 위험 대비 수익률을 갖는 이익 실현   (TAKE PROFIT)   및   손절매(STOP LOSS)   레벨 표시       RR 1:2   . 지능형 손실 감소 로직이 적용된 손절매 기능. 지정된 지표에서 두 가지 추세 유형에 대한 반전 패턴을 표시합니다. 지표: 트렌드를 따라   트렌드 라인 프로   (글로벌 트렌드 변화) 트렌드 프로   (빠른 트렌드 변화) 간단하고 효과적입니다       스캐너       실시간 추세 (신규). 다중 시간 프레임 도구 필터링. 표시하다  
Advanced Currency IMPULSE with ALERT
Bernhard Schweigert
4.9 (490)
현재 40% 할인!! 초보자 또는 전문가 트레이더를 위한 최고의 솔루션! 이 지표는 우리가 독점 기능과 비밀 공식을 통합했기 때문에 독특하고 고품질이며 저렴한 거래 도구입니다. 단 하나의 차트로 28개 통화 쌍 모두에 대한 경고를 제공합니다. 새로운 추세 또는 스캘핑 기회의 정확한 트리거 포인트를 정확히 찾아낼 수 있기 때문에 거래가 어떻게 개선될지 상상해 보십시오! 새로운 기본 알고리즘을 기반으로 구축되어 잠재적인 거래를 훨씬 더 쉽게 식별하고 확인할 수 있습니다. 이는 통화의 강세 또는 약세가 가속되는지 여부를 그래픽으로 표시하고 가속 속도를 측정하기 때문입니다. 자동차의 속도계처럼 생각하면 됩니다. 가속화할 때 Forex 시장에서 동일한 일이 분명히 더 빠르게 발생합니다. 즉, 반대 방향으로 가속화되는 통화를 페어링하면 잠재적으로 수익성 있는 거래를 식별한 것입니다. 통화 모멘텀의 수직선과 화살표가 거래를 안내합니다! 역동적인 Market Fibonacci 23 레벨은
Day Trader Master
Oleg Rodin
5 (15)
Day Trader Master 는 데이 트레이더를 위한 완벽한 거래 시스템입니다. 시스템은 두 개의 지표로 구성됩니다. 하나의 지표는 매수 및 매도를 위한 화살표 신호입니다. 얻을 수 있는 화살표 표시기입니다. 2차 지표를 무료로 드립니다. 두 번째 지표는 이러한 화살표와 함께 사용하도록 특별히 설계된 추세 지표입니다. 표시기는 반복하지 않고 늦지 않습니다! 이 시스템을 사용하는 것은 매우 간단합니다. 2색 선으로 표시되는 현재 추세 방향의 화살표 신호를 따라가기만 하면 됩니다. 파란색은 구매 추세입니다. 빨간색은 판매 추세입니다. 파란색 화살표는 매수 신호입니다. 빨간색 화살표는 매도 신호입니다. 추세선의 색상과 일치하려면 화살표의 색상과 신호의 방향이 필요합니다. 화살표 표시기는 주로 시간 간격 M5 및 M15에서 일중 거래를 위해 만들어졌습니다. 그러나 기술적으로 시스템은 다른 시간 간격으로 사용할 수 있습니다. 표시기에는 PUSH 메시지 기능이 있는 팝업 경고가 장착되어 있
IQ FX Strength  answers the single most important question in trading: "Who is truly driving the market right now?" Designed with a stunning Hybrid UI, this tool separates true trend moves from market noise, allowing you to catch "Explosive" moves before the crowd sees them. System Requirement: For higher accurate signal and optimal, smoother performance of this indicator without any lag, a good CPU (with   RAM of  atleast 8GB or above) and fast internet connection is highly recommended. IQ FX
제작자의 제품 더 보기
The FREE version works on Demo account and only CADCHF and NZDCHF pairs. The indicator predict the future candles direction, by scanning past candle movement. Based on the principal: “ The history repeat itself”. Programmed according to Kendall Correlation. In the settings menu, different scanning options are available. When the indicator find a match, start painting future candles from the current candle to the right, also from the current candle to the left as well, showing you the candle pa
FREE
This is a free version of our Great tool with limited functions. The ChartChanger is a great utility tool to reduce the number of open charts on your terminal. There is three section to it: Symbols, Time frames and Templates. You need only one chart to be open and still you can scroll up to multiple ones. Symbols: With the push of a button you can change from one symbol to another, and your applied indicators will stay on the next chart. For the symbols there is an auto detection mode, or you ca
FREE
This indicator can display 1-6 RSI indicator on different timeframes and settings. The active indicators can give visual and sound alert on oversold/overbought level if the user choose that option. Alert can be set on one or all active indicator, even if the timeframe, the period and the oversold/overbought level different on each.There is a display panel with buttons on the main chart, what is show the active indicators and their settings.There is an option to hide this panel. With the buttons
This indicator can display 1-3 CCI indicator on different time frames and settings. The active indicators can give visual and sound alert on oversold/overbought level if the user choose that option. Alert can be set on one or all active indicator, even if the time frame, the period and the oversold/overbought level different on each. There is a display panel with buttons on the main chart, what is show the active indicators and their settings. There is an option to hide this panel. With the butt
EZT Macd Pro
Tibor Rituper
5 (4)
소프트웨어 설명 이 지표는 다양한 시간대와 설정에 따라 1개 또는 2개의 MACD 지표를 표시할 수 있습니다. 계산을 위해 EMA를 사용하는 무료 버전이 있습니다. 이 Pro 버전은 단순, 지수, 평활 및 선형 가중 등 4가지 이동 평균 유형을 모두 사용하여 계산합니다. 활성 표시기는 팝업, 소리, 푸시 또는 이메일 경고를 제공할 수 있습니다. 제로 레벨 교차에 대한 무료 버전 경고인 이 Pro 버전 경고는 사용자가 해당 옵션을 선택한 경우 제로 레벨 교차 또는 히스토그램 신호선 교차로 설정할 수 있습니다. 시간 프레임과 기간이 각각 다르더라도 하나 또는 두 활성 표시기에 경고를 설정할 수 있습니다. 2개의 MACD 지표를 사용하는 경우 각 지표에 대해 경고가 별도로 작동할 수 있습니다. 메인 차트에는 활성 지표와 해당 설정을 표시하는 버튼이 있는 디스플레이 패널이 있습니다. 이 패널을 숨기는 옵션이 있습니다. 임시 버튼을 사용하면 활성 MACD 중 하나를 숨길 수 있습니다.
ChartChanger는 터미널에 열려 있는 차트 수를 줄이는 훌륭한 유틸리티 도구입니다. 여기에는 기호, 시간 프레임 및 템플릿의 세 가지 섹션이 있습니다. 차트를 하나만 열면 여러 차트로 스크롤할 수 있습니다. 기호: 버튼을 누르면 한 기호에서 다른 기호로 변경할 수 있으며 적용된 지표는 다음 차트에 유지됩니다. 기호에는 자동 감지 모드가 있거나 원하는 기호를 수동으로 입력할 수 있습니다. 28개를 모두 사용하거나 그 이하의 숫자를 사용할 수 있습니다. 통화 쌍, 에너지, 지수, 상품 등 MetaTrader에 있는 모든 기호를 사용할 수 있습니다. 시간 프레임: 패널 중앙에 시간 프레임 변경 기능이 추가되었습니다. 버튼을 누르면 1분부터 월간 차트까지 원하는 기간으로 변경할 수 있습니다. 템플릿: 이 패널의 세 번째 기능은 템플릿 변경자입니다. 9개의 내장 템플릿이 있으며 모두 사용하거나 사용하지 않습니다. 모든 버튼은 자유 부동 패널 내부에 있습니다. 패널 상단에 커서를 놓고
이것은 다중 시간 프레임 핀 바 경고 표시기입니다. 현재 시간대만 사용하거나 1분부터 월간까지 전체 시간대를 사용할 수 있습니다. 모든 기간을 선택하면 차트가 열려 있는 현재 기간과 위의 기간에 대한 알림을 받게 됩니다. 선택한 각 시간대에 대해 팝업, 이메일, 푸시 알림 알림이 별도로 있습니다. 표시기는 가격 차트에 화살표를 배치합니다. 강세/롱 핀 바의 경우 가격선 아래에 있고, 약세/단기 핀 바의 경우 가격선 위에 있습니다. 알림만 받고 차트가 화살표로 가득 차는 것을 원하지 않는 경우 화살표 색상을 선택하면 됩니다. 없음 설정 확인해야 할 왼쪽 캔들 수: 약세 핀 바가 가장 높아야 하며 강세는 가장 낮아야 유효합니다. 왼쪽에 있는 캔들 수를 선택합니다. 약세 핀 바를 찾는 경우 더 낮아야 하고, 강세 핀 바를 찾는 경우 더 높아야 합니다. 최소 본문/전체 크기 백분율: 핀 막대의 최소 본문 크기입니다. 최대 본문/전체 크기 백분율: 핀 막대의 최대 본문 크기입니
EZT Trend
Tibor Rituper
4.75 (4)
EZT 추세 표시기는 추세, 하락세 및 진입 기회를 보여줍니다. 선택적 필터링과 모든 유형의 경고를 사용할 수 있습니다. 이메일 및 푸시 알림 알림이 추가됩니다. 우리는 또한 이 지표를 기반으로 EA를 개발 중이며 곧 제공될 예정입니다. 두 개의 컬러 히스토그램과 하나의 선으로 구성된 다기능 표시기입니다. 이는 추세 방향과 강도를 시각적으로 표현한 것이며, 선이나 히스토그램에서 여러 번 차이를 발견할 수 있습니다. 표시기는 자동 매개변수 설정과 잘 작동합니다. 이는 주어진 기간에 대해 미리 결정되어 있으므로 해당 설정으로 표시기를 사용하는 것이 좋습니다. 수동 모드에서는 자신만의 매개변수를 설정할 수 있습니다. 이는 다중 시간대(mtf) 표시기입니다. 이 지표는 MTF rsi, MTF cci 또는 MACD pro와 같은 다른 지표의 조합과 잘 작동합니다. 거래되는 상품의 변동성이 클수록 최상의 항목을 찾는 데 사용해야 하는 기간이 더 짧아집니다. 항상 더 높은 기간 방향을
EZT Engulfing
Tibor Rituper
이것은 다중 시간대를 뒤덮는 촛불 경고 표시기입니다. 현재 시간대만 사용하거나 1분부터 월간까지 모든 시간대에서 사용할 수 있습니다. 이는 다시 칠하지 않는 MTF 표시기입니다. 선택한 시간대 옵션(다중 시간대 모드)을 사용하면 실제 현재 시간대 이상에서 신호를 볼 수 있습니다. 선택한 기간마다 팝업, 이메일, 푸시 알림 알림이 별도로 제공됩니다. 표시기는 가격 차트에 점을 표시합니다. 강세의 경우 휩싸이는 양초는 가격선 아래에 있고, 약세의 경우 휩싸이는 양초는 가격선 위에 있습니다. 알림만 받고 싶고 차트가 점으로 가득 차는 것을 원하지 않는 경우 화살표 색상을 선택하세요. 없음. 설정: 화살표를 표시하기 위한 캔들 제한: 화살표/점을 표시하기 위해 다시 캔들 수를 표시합니다. 기간 선택 모드: 현재 또는 선택한 기간. Engulfing 필터 모드: "강력한 공식", "공식" 및 "비공식" 중에서 선택할 수 있는 세 가지 옵션입니다. 세 가지 옵션 모두 마지막 2
This is a great utility tool to see valuable information on your chart. The panel is free-floating, grab with your mouse and move around on the chart with ease. Also the panel is collapsible so you can save space, and you can see only the information you wish. There is three section to the panel, when is closed you can see the top section only. Here the list of information you can see on the panel, from the top to bottom: The first part of the panel: Price : The color is changing according to d
EZT Stochastic
Tibor Rituper
5 (2)
EZT_Stochastic   This is a Multi Timeframe stochastic indicator, with colored background. The colored background can be set to different colors based on the K and D line, (moving up, or down), and also about the position of the lines. In the oversold or overbought zones you can choose different colors.   Settings: You can choose the time-frame you want to see the stochastic. Set the regular parameters in a same way like in the original stochastic. Histogram style: The style. Histogram width: The
EZT_Ichimoku_MTF Multitimeframe Ichimoku indicator. Display up to 4 different Ichimoku on the chart. Every line of every ichimoku is customizable, you can turn off/on or choose different thickness or color. You can choose to see only the cloud in multiple ichimokus. Optional info panel to identify the different Ichimokus. Works the same way like the original Ichimoku indicator.
EZT Trade History This is a great tool to analyze past trades or follow current ongoing trades, especially when you using an EA to manage your transactions. You will see the exact candle where the trade was opened and closed. Collapsible floating panel on the chart, free to move anywhere with your mouse. When you using multiple EA’s with different magic numbers, you have 5 options to separate those trades, so you will know which EA opened specific transactions. You can set the day limits how fa
EZT Bollinger Trendline Indicator based on multiple settings of Bollinger Band. In the menu you can choose the similar settings than bollinger band indicator. Trend period and trend deviations. Also paint and arrow on chart when direction change. Three different kind of alert , such as pop up, e-mail and push notification. Try different settings on different timeframes. Please help my work and rate and comment my products!
The indicator predict the future candles direction, by scanning past candle movement. Based on the principal: “ The history repeat itself”. Programmed according to Kendall Correlation. In the settings menu, different scanning options are available. When the indicator find a match, start painting future candles from the current candle to the right, also from the current candle to the left as well, showing you the candle pattern what the actual signal is based on. The left side candle are optiona
필터:
shinsuke-mt4-down
14
shinsuke-mt4-down 2023.03.21 04:36 
 

사용자가 평가에 대한 코멘트를 남기지 않았습니다

Tibor Rituper
6392
개발자의 답변 Tibor Rituper 2023.03.21 14:02
ありがとう、私の他のソフトウェアをチェックアウトすることを忘れないでください
John Winsome Munar
3471
John Winsome Munar 2022.06.21 03:50 
 

사용자가 평가에 대한 코멘트를 남기지 않았습니다

Artialberta
730
Artialberta 2022.03.02 03:33 
 

사용자가 평가에 대한 코멘트를 남기지 않았습니다

Mohamamd Rajaur Rahman
111
Mohamamd Rajaur Rahman 2018.05.20 11:38 
 

사용자가 평가에 대한 코멘트를 남기지 않았습니다

Tim Eubanks
5763
Tim Eubanks 2018.03.19 08:35 
 

사용자가 평가에 대한 코멘트를 남기지 않았습니다

Imiimi
134
Imiimi 2017.06.08 10:07 
 

사용자가 평가에 대한 코멘트를 남기지 않았습니다

Imperial
46
Imperial 2017.06.07 16:44 
 

사용자가 평가에 대한 코멘트를 남기지 않았습니다

Gennadiy Voltornist
11909
Gennadiy Voltornist 2017.06.02 13:59 
 

사용자가 평가에 대한 코멘트를 남기지 않았습니다

리뷰 답변