Pivot points vision
- 지표
- 버전: 1.0
- 활성화: 20

Pivot Point Vision is a MetaTrader 5 analysis tool designed to bring clarity to price action. By combining automated historical pivot level plotting with dynamic candlestick coloring, it provides an immediate overview of market structure.
Key Features
-
Period-Segmented Pivots
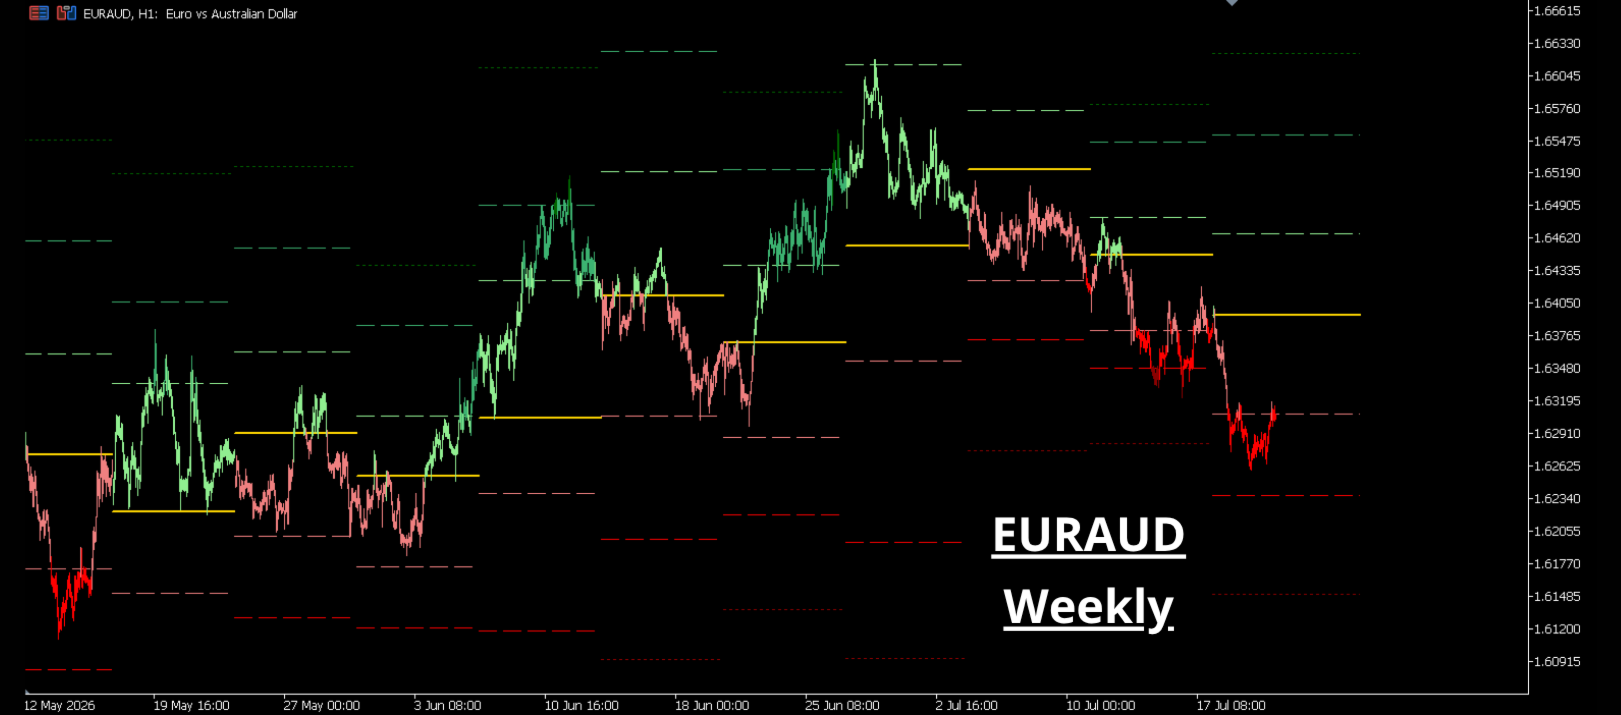
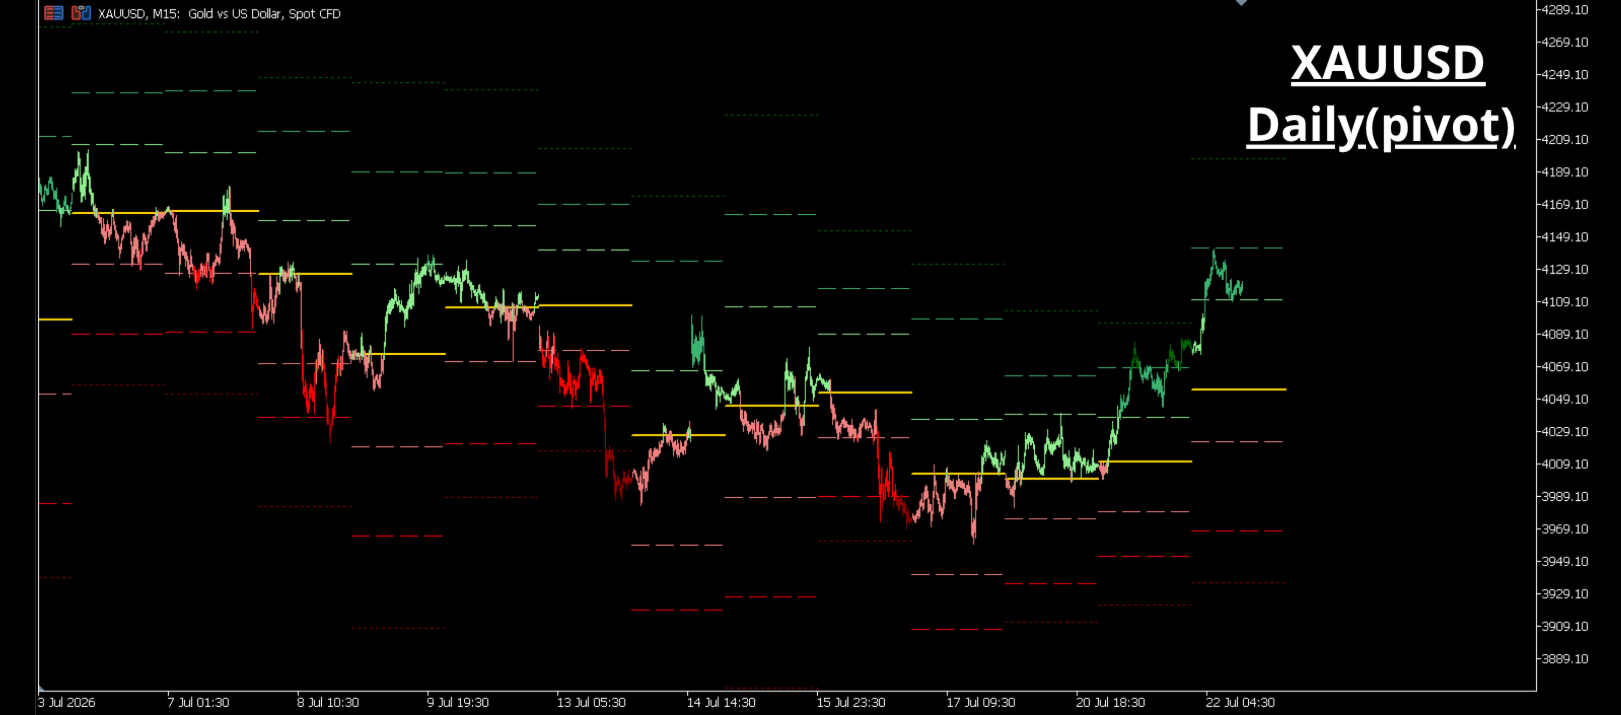
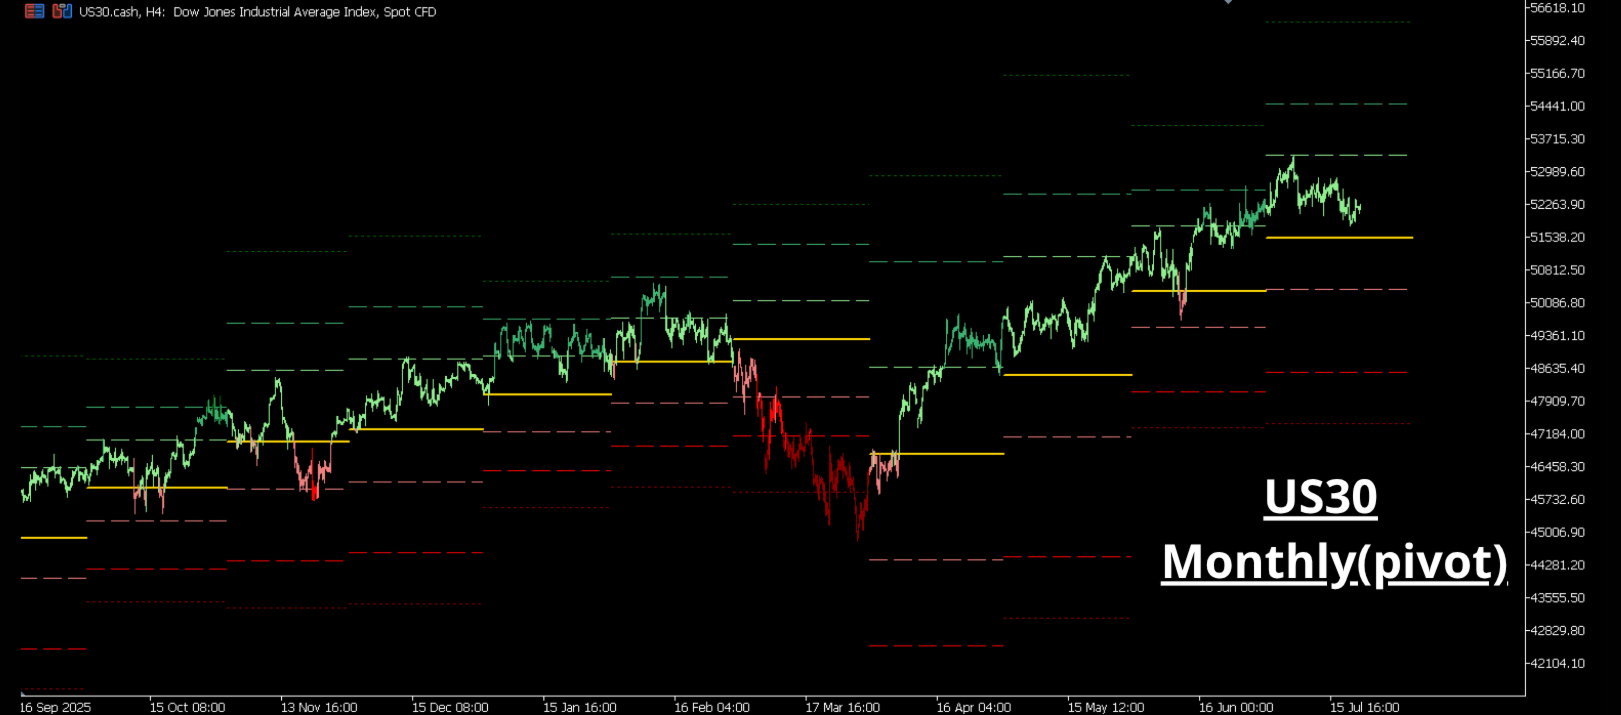
Pivot levels (Daily, Weekly, or Monthly) are cleanly bounded within each respective timeframe period. Your chart history remains organized and legible, avoiding infinite horizontal lines stretching across the screen.
-
Dynamic Candlestick Coloring
Candle bodies update in real time based on their position relative to the central pivot. Three shades of green highlight upward progression into upper zones, while three shades of red categorize moves below the baseline.
-
Flexible Calculation Modes
Offers two methods to fit your workflow: standard pivot formulas (adjusting level spacing based on the prior period's volatility) or a custom fixed-pip offset mode around the central pivot.
-
Instant Contextual Analysis
Quickly identify price consolidation or extension relative to higher timeframe benchmarks, directly from your active trading chart.
A Visual Assistant for Your Analysis
This indicator does not generate automated trading signals. It is a visual mapping tool engineered to eliminate manual drawing, streamline chart layout, and help you locate price action relative to key historical reference levels.