PivotMeridian MT4
- 지표
-
Farhad Kia
 I have extensive experience as an algo-trader and a skilled MT4/5 tool developer. I have created over 1000 EAs, indicators, and scripts for MT4/5, and have won several Forex contests. Apart from programming, I also possess valuable expertise as a successful algo-trader, which allows me to provide
 - 버전: 1.0
- 활성화: 5
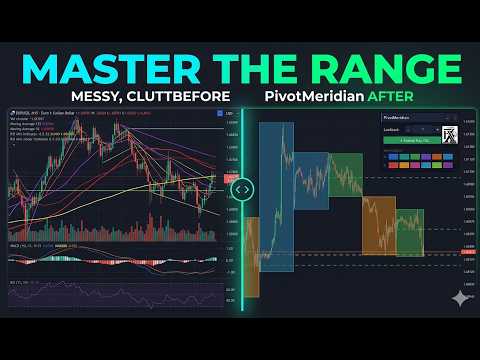
PivotMeridian is an advanced, visually optimized daily range and pivot mapping tool designed for professional manual traders. Instead of relying on static, intrusive chart overlays, it features a native, fully draggable dashboard that puts total control over historical analysis directly on your chart.
Core Features
- Smart Daily Zones: Highlights the exact High-to-Low range of previous trading days using semi-transparent, color-faded blocks. Zones are intelligently inset to prevent them from visually merging over weekends or session gaps.
- Dynamic Pivots: Calculates a volume-weighted "center of gravity" pivot for each day, plotted as a distinct dashed line inside the zone.
- Zero Chart Interference: The indicator actively prevents accidental chart panning while you are dragging the dashboard or clicking its buttons, ensuring a seamless user experience.
- Persistent State: Your settings (dashboard position, color theme, lookback period, and minimized state) are automatically saved per-chart and survive timeframe or symbol changes.
Dashboard Controls
The dashboard is designed to be completely independent and interactive:
- Draggable Header: Click and hold anywhere on the top header (next to the title) to smoothly drag the dashboard anywhere on your chart.
- Minimize [-] / Close [x]: Use the header buttons to minimize the panel to save screen space, or completely remove the indicator and its objects from the chart with a single click.
- Lookback [-] [ Days ] [+]: Instantly adjust how many historical days are drawn on the chart. Updates occur in real-time without reloading the indicator.
- Extend Ray: Toggles whether the pivot line of the most recent day projects into the future (acting as a forward-looking support/resistance magnet for current price action).
- Zone Colours (A / B): Customize the alternating day colors using two rows of 6 professional, hand-picked color swatches. The indicator automatically calculates an aesthetic 40% fade blend based on your selection so the chart never looks cluttered.
How to Use in Trading
- Range Breakouts: The colored zones clearly define the extremes of the previous days. A strong candle close outside of a recent day's zone often signals momentum continuation.
- Mean Reversion: The dashed pivot line acts as the daily mean. In ranging markets, price will frequently gravitate back toward this center line after touching the upper or lower boundary of the zone.
- Future Projections: Turn on the Extend Ray feature to project yesterday's pivot into today's price action. This is highly effective as an intraday target for take-profits or a bounce-zone for entries.