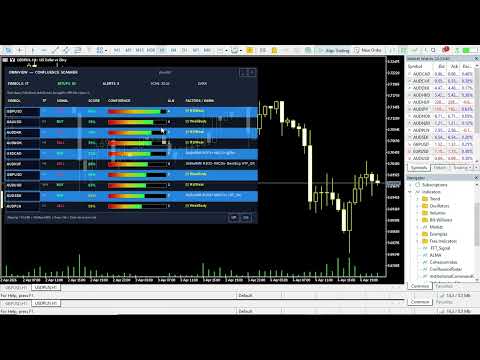
OmniView Confluence Scanner

전문가용 멀티 타임프레임(Multi-TF) 및 멀티 커런시 대시보드

Omniview Confluence Scanner를 통해 시장의 절대적인 명확성을 경험하십시오. 기관 수준의 이 HUD는 성능을 위해 구축되었으며, 커스텀 코딩된 CCanvas 엔진을 사용하여 차트 위에 완벽하게 배치되는 플리커 프리(flicker-free) "글래스" 인터페이스를 제공합니다.

핵심 기능:

  • 핸들 풀(Handle Pool) 기술: 속도를 위해 설계되었습니다. 메모리 누수나 플랫폼 지연 없이 M15, H1, H4, D1에 걸쳐 수십 개의 심볼을 동시에 스캔합니다.

  • Shadow-Sharp 가독성: 특수 고대비 음영 처리를 통해 모든 신호, 요인 및 경고가 어떤 차트 배경에서도 100% 명확하게 보입니다.

  • 스마트 스코어링 (0–100%): 모든 셋업을 자동으로 평가합니다. 확률이 높은 컨플루언스(중첩 근거)만 리스트 상단으로 정렬됩니다.

  • 3중 레이어 정렬: EMA 트렌드, RSI 모멘텀, 일봉 HTF 방향을 동기화하여 견고한 매매 확인을 제공합니다.

  • 즉각적인 차트 동기화: 대시보드의 행을 클릭 한 번만 하면 터미널이 해당 심볼과 타임프레임으로 즉시 전환됩니다.

기술 사양:

  • 지표 유형: 트렌드, 멀티 타임프레임, 멀티 커런시.

  • 플랫폼: MetaTrader 5.

  • 신호: 논-리페인팅 (Non-Repainting).

셋업을 찾아 헤매는 것을 멈추십시오. Omniview가 시장의 최적의 기회를 여러분에게 직접 가져다 드립니다.

추천 제품
"수동 채널 그리기? 더 이상은 아닙니다. 시장 구조가 자동으로 드러나게 하세요." "장기 가격대를 연중무휴 24시간 실시간으로 추적하세요." 실제 트레이더의 고충 피벗 포인트를 수동으로 식별하려면   시간과 노력이 많이 듭니다 . 적응하기 어려움   높은 변동성   및 정확한   신뢰할 수 있는 채널 아이디어 복사 "시장은 잠들지 않습니다. 왜 분석을 멈춰야 할까요?" "하루에 수십 개의 자산을 어떻게 관리하고 계신가요?" 핵심 주장 오토채널   시장 구조를 자동으로 읽어 수작업을 줄여줍니다. "기계의 정밀성과 인간의 직관으로 분석" 기술 분석 주요 기능 설명 자동 피벗 감지 지그재그 기반 실시간 분석 멀티 타임프레임 분석 강력한 신호를 위해 더 높은 시간대를 활용 채널 채점 시스템 볼륨, 각도, 길이, 중요도 등을 평가합니다. 유사성 필터링 깔끔한 UI를 위해 중복 채널 제거 동적 지그재그 감도 시장 범위 및 기간에 맞게 조정 시각적 하이라이트 중요도에
Smart Money Structure & Precision Trading Indicator (MT5) Smart Money Structure & Precision Trading Indicator  is a powerful Smart Money Concepts (SMC) indicator for MetaTrader 5, designed to help traders identify high-probability entries with institutional logic . This indicator automatically detects market structure in real time , highlights key liquidity levels , and provides clear, non-repainting signals so you can trade with confidence and precision. Whether you are a scalper, day trader, o
MasterCharts
Alexander Berger
You can think of these indicators as moving pivot points. MasterChartsTrading Price Action Indicators show good price levels to enter or exit a trade. The Blue indicator line serves as a Bullish Trend setter. If your instrument closes above the Blue line, we think about going Long (buying). When your trading instrument closes below the Red line, we think about Shorting (selling). It is very easy to read price action if you have a reference point. These support/resistance lines are there to help
N/B: All our product purchase comes with our free ‘’DAILY   SCALPER EA’’ -   bit.ly/4qlFLNh Whatsapp Developer for yours after successful purchase HolyGrail Premium System: The Ultimate Supply & Demand Trading Solution   Finally Discover the "Unfair Advantage" That Professional Traders Have Been Using For Years "I went from inconsistent guessing to precision trading with 83% accuracy once I started combining multi-timeframe confirmation with institutional order flow zones" Note: After pur
TMA Centered Bands Indicator
Irina Cherkashina
5 (1)
The TMA Centered Bands Indicator for MT5 draws bands on the chart and shows the overall price trend. It displays three bands - the lower and upper boundaries of the channel and the median.   The bands are made up of moving averages, and each of them has an MA period. The name TMA comes from triangular moving averages, as the indicator draws triangular bands.   The price will fluctuate between these ranges whenever the trend changes direction, thus creating entry and exit points.   How to trade
FREE
Frontier Pivots
Nestor Jose Mendez Boza
FRONTIER PIVOTS - Geometric Levels Indicator This indicator plots support and resistance levels/ranges on the chart using mathematical calculations. It helps traders identify potential price reaction zones based on geometric patterns. Main Features: Automatically calculates and displays key price levels Plots both support and resistance lines Uses daily price data for level calculation Clean visual presentation with different colors for different level types No repainting - levels remain static
First Dawn MT5
Innovicient Limited
The First Dawn indicator uses a unique mechanism to search and plot signals. This keeps searching for signals, making it a great indicator for scaping and identification of changes in direction, swing trading and trend trading. The    First Dawn     helps you get early signals. The backtest gives the true picture of how the indicator works with real/demo accounts. Although this is a tiny indicator it is packed with advantageous settings that will help you whether you desire to: Snap the Peaks a
Precision Entry v3
Olurotimi Olugbenga Awolade
Precision Entry v3 is a complete entry system that combines swing-based entry logic with automatic DiNapoli Fibonacci take profit levels. When a valid setup is detected, the indicator plots the entry arrow on the chart and instantly draws TP1 (1.0 extension), TP2 (1.272 extension), and TP3 (1.618 extension) levels — plus a calculated stop loss — giving you a full trade plan with one glance.   Why This Indicator? Most entry indicators tell you when to enter but leave you guessing where to exit. P
Wall of worry MT5
Illia Zhavarankau
Description: The Wall of Worry indicator allows you to assess market sentiment and possible reversals. The indicator represents three lines that are displayed in a separate window. Black line (trend) - the amount of volumes in the candle body. Red line (bears) - the amount of volumes in the upper shadow of the candlestick. Blue line (bulls) - the amount of volumes in the lower shadow of the candle. The idea is based on "Wall of Worry" - this is the periodic tendency of financial markets to
Stochastic Dashboard PRO – Multi-Timeframe Trend & Signal Analyzer Short Description: A professional Stochastic Dashboard that displays %K and %D values across multiple timeframes, highlighting overbought/oversold conditions for quick trend analysis. Perfect for traders seeking clarity and speed. Full Description: The Stochastic Dashboard PRO is a powerful tool designed for traders who want instant access to multi-timeframe stochastic signals without switching charts. It displays %K and %D val
SWing3
AHMED ABULFATEH
5 (5)
98% 정확도의 거래 신호 정확한 진입, 명확한 청산 | 다중 시간대 | 모든 시장 간단한 3단계로 작동 방식 1️⃣ 거래 진입 (매수/매도 규칙) 신호 트리거: 두 개의 선(X)이 색상 영역(빨간색: 매수, 파란색: 매도)을 벗어나 교차합니다. 확인: 가격 캔들이 교차점에 닿아야 합니다(1~5개 캔들 사이 또는 교차 후). 대체 진입 (터치 없음): 매도 신호(파란색 영역): 가격이 교차점 위에 유지됩니다(터치 필요 없음). 매수 신호(빨간색 영역): 가격이 교차점 아래에 유지됩니다(터치 필요 없음). 2️⃣ 청산 거래 (이익실현) 청산 신호: 노란색 선이 현재 영역 밖으로 곡선을 그리며 진입 → 거래 청산. 3️⃣ 위험 관리 랏 크기: $1,000 계좌 잔액당 0.01랏 거래 다각화: 주요 통화(예: USDJPY, EURGBP, GOLD)에 분산 투자하세요. 트레이더들이 이 지표를 선호하는 이유 98% 정확도 - 유동성 및 이동평균 교차 기반 신뢰할 수 있는
The indicator ‘Probability Range Bands’ gives a prediction of the amount, how much the asset is moving from its current price. The range bands give probabilities, that the candle close will not exceed this certain price level. It is also called the expected move for the current candle close.   This Indicator is based on statistical methods, probabilities and volatility. Asset price is assumed to follow a log-normal distribution. Therefore, log returns are used in this indicator to determine the
Smash fx system
Ntando Mtshali
Smash FX System — Inside-Bar Breakouts, Reversals & Continuations (Indicator) Tagline: Smash the noise, catch the clear moves — high-clarity inside-bar breakout, reversal and continuation arrows designed for clean entries and professional journaling. Short promo  Smash FX System pinpoints high-probability inside-bar breakouts, smart reversals and continuation setups with on-chart arrows and exact levels — built for traders who want clear, repeatable setups and perfect order-management handoffs f
Market Scoring System
Vincent Jose Proenca
마켓 스코어링 시스템 – 고급 멀티타임프레임 트레이딩 지표 전문 기술 지표, 머신러닝 패턴 분석, 멀티타임프레임 확인을 결합한 고급 시장 분석 시스템으로, 매우 정확한 매매 신호를 제공합니다. 주요 기능 멀티타임프레임 분석: M5, H1 등 여러 시간대에서 신호를 확인하여 성공 확률 증가 스마트 스코어링 엔진: 최근 25개 캔들을 가중 분석하여 트렌드, 레인지, 불확실성 점수 계산 시장 의도 분석: 최근 6개 캔들과 거래량을 바탕으로 실시간 매수/매도 압력 분석 글로벌 스코어 (0–100): 종합 신호 강도 지표, 색상 기반 프로그레스 바 제공 ATR 기반 리스크 관리: 동적 스탑로스, 테이크프로핏, 트레일링 스탑 계산 ADX 추세 강도 필터: DI+/DI- 로 강한 추세와 횡보 시장 구분 거래량 컨텍스트 분석: 폭발적 변동성과 조용한 축적 단계를 구분 머신러닝 시스템: 패턴 인식 및 결과 추적을 통한 적응형 신호 생성 엄격 모드: ADX, 불확실성, 트렌드 강도 기
Sniper Pro Trio Signals
Shadi Bin Shahradin Bin Juma Balqaid
Sniper Pro Trio Signals is a robust signal indicator designed to help you identify cleaner trade opportunities using a 3-confirmation system : RSI (momentum / overbought-oversold) MACD (trend momentum) Bollinger Bands (price extremes / levels) To reduce low-quality entries, it also includes an EMA trend filter and an on-chart dashboard that displays the current market status and calculates Stop Loss / Take Profit levels synchronized to the live Bid/Ask price . Main Advantages  Clear signals ba
A top and bottom indicator that can intuitively identify the trend of the band. It is the best choice for manual trading, without redrawing or drifting. Price increase of $20 every 3 days, price increase process: 79-->   99 --> 119...... Up to a target price of $1000. For any novice and programming trading friend, you can write the signal into the EA to play freely. Array 3 and array 4, for example, 3>4 turns green, 3<4 turns red. If you don't understand, please contact me. ====================P
Bid Price Timer Indicator — 정밀한 타이밍과 스마트한 가격 추적! Bid Price Timer Indicator 는 시간, 정확도, 명확성 을 중요시하는 트레이더를 위해 설계된 강력한 도구입니다. 주요 기능: 고정 타이머 표시 – 타이머는 항상 차트의 오른쪽 에 표시되며, X_Offset 으로 위치를 조정할 수 있습니다. 실시간 가격 추적 – 타이머는 매수 호가 (Bid 가격) 에 따라 위아래로 부드럽게 이동 합니다. 자동 위치 조정 – 가격이 변경되면 타이머가 자동으로 새로운 가격 수준에 맞게 이동 합니다. 선택 가능한 수평선 표시 – 정확한 Bid 가격 수준 을 시각적으로 보여줍니다. ️ 1초 단위 실시간 업데이트 – 타이머는 매초 갱신되며 , 다음 캔들까지의 카운트다운 을 실시간으로 보여줍니다. 트레이더들이 좋아하는 이유: 정확한 캔들 마감 타이밍 을 예측할 수 있습니다 차트를 깔끔하고 현대적이며 직관적 으로
Triplet Cloud MTF is an indicator for trend-following strategy. It presents the trend in HTF from the LTF Chart that allows traders focus on looking for trade entry in the right direction and increase striking rate. It comes with simple input setup. You will only need to choose HTF you want to follow its trend and set the alert setup, then all is set. Here are the mostly selected HTF setup for each of entry timeframe: M1 Entry   : M15 Trend M5 Entry   : H1 Trend M15 Entry   : H4 Trend H1 Entry  
FIBO Trend PRO mt5
Evgenii Aksenov
4.5 (2)
The indicator allows you to instantly determine the current trend by color and FIBO levels. Higher Timeframe the panel shows the current trend of higher periods, helping to determine the strength of the trend. Trade according to the trend when changing the color of candles or trade against the trend when the price hit the extreme levels of the FIBO Trend PRO  indicator   Advantages of the FIBO Trend PRO Indicator never repaint and does not change their values Very easy to use and intuitive Appl
Pure Diamond Trend Exhaustion Pure Diamond Trend Exhaustion 지표는 시장의 추세 소진 구간과 잠재적 가격 반전 지점을 식별하기 위해 설계되었습니다. 핵심 알고리즘은 가격의 극점과 캔들 꼬리 구조 분석을 기반으로 하며, 기존의 지연성 보조지표를 사용하지 않고도 유의미한 과매수 및 과매도 수준을 포착합니다. 기술적 특징: 신호 재분석 없음 (No Repaint): 지표 신호(다이아몬드)는 현재 캔들이 마감되는 즉시 고정됩니다. 한 번 생성된 신호는 이후의 가격 변동에 따라 사라지거나 위치가 바뀌지 않습니다. 노이즈 필터링 알고리즘: 본 프로그램은 캔들의 몸통과 꼬리 비율을 분석하여 설정된 가격 범위 내의 거짓 파동을 필터링합니다. 범용성: 외환(Forex), 암호화폐, 지수, 원자재를 포함한 모든 자산군에 최적화되어 있으며, 모든 타임프레임에서 사용 가능합니다. 미니멀한 인터페이스: 시각화가 그래픽 심볼로 구현되어 트레이더의 작업 공간을 방
Market Pulse Scanner
Olurotimi Olugbenga Awolade
DESCRIPTION: Market Pulse Scanner — 6-Factor Directional Analysis Dashboard Know the market direction in 2 seconds. This indicator scans 6 independent technical factors simultaneously and delivers one clear signal with confidence rating. THE 6 FACTORS: EMA Trend — Fast/slow crossover direction ADX Strength — Trending vs ranging detection RSI Momentum — Overbought/oversold filter MACD Direction — Histogram sign and crossover Volume — Current bar vs 10-bar average Price Action — Bullish/bearish ca
Signal Eskiya mt5
Vitalii Zakharuk
Signal Eskiya, in addition to channel lines, reflects entry signals in the form of arrows. Trading strategies using the channel indicator belong to the classic methods of technical analysis, are easy to execute, and therefore available even to beginners. Price ranges work equally well on any trading assets and timeframes, they can be used both independently and with additional confirmation from oscillators and market volumes. American traders say: “Trend is your friend”, which means “Trend is
Rejection Block
Usiola Oluwadamilol Olagundoye
5 (1)
The "Rejection Block" MetaTrader 5 Indicator offers traders a comprehensive tool for identifying and visualizing rejection candlestick patterns, commonly known as rejection blocks. These patterns are pivotal in discerning potential market reversals or continuations, making them invaluable for traders seeking to enhance their analysis. Key Features: Rejection Block Detection: The indicator diligently scans price data, pinpointing instances of rejection candlestick patterns. These patterns typical
FREE
High And Low MT5
Dmitriy Parfenovich
On the current chart, this indicator displays candlestick highs and lows of another time frame. Input Parameters: TimeFrame - chart time frame whose data will be displayed on the current price chart (by default, H12). Time Zone - shift of the indicator by time zone relative to the broker's time (by default, Broker-1). If the broker's time zone is UTC+1 and the Time Zone parameter is set to Broker-1, the bends of the indicator will be plotted in multiples of Greenwich Time. Indicator buffer value
FiboChampion
Marius Ovidiu Sunzuiana
The Next Evolution in Fibonacci Intelligence FiboChampion  isn’t just another Fibonacci tool—it’s a paradigm shift in how traders interpret price action. Engineered for precision and adaptability, this advanced indicator fuses quantum-inspired logic , machine-learned pattern recognition , and non-linear Fibonacci geometry to uncover market turning points with uncanny accuracy. What Sets FiboChampion Apart: Non-Linear Fibonacci Mapping : Goes beyond static retracements by adapting to fractal m
Title: Volatility Expansion POI PRO Escape the Chop. Trade Institutional Expansion with Dawe Trading! The biggest enemy of any retail trader is "The Chop"—those low-volatility, sideways periods where standard indicators generate endless false signals.   Volatility Expansion POI PRO , engineered by   Dawe Trading , was developed with a single mission: to identify market compression in real-time and keep you on the sidelines until a high-probability institutional expansion occurs. The   Dawe Trad
Glider
Vitalii Zakharuk
The Glider indicator gives accurate and timely signals to enter and exit the transaction that appear on the current candle. Using the indicator is very simple. When a dot and a blue line appear, open a buy deal. When a dot and a red line appear, open a sell deal. The main purpose of this indicator is to determine the moments of entry and exit from transactions, therefore the Glider indicator will display only the trend line and entry points, i.e. displays displays the entry points to the marke
TrendFusionXplorer consists of three powerful trend-analyzing indicators — TRP , PMax and OTT — developed by Kivanc Ozbilgic. Each indicator displays the trend's support and resistance levels based on its unique properties and methodology. TrendFusionXplorer assists in determining entry and exit points for markets and can also be used for setting trailing stop-loss (SL) and take-profit (TP) levels on open positions. Specifications 1. Trend Reversal Predictor (TRP): TRP follows Thomas R. DeMar
Summary Signal Line
Evgeniy Kornilov
SummarySignalLine   is an intelligent multi-indicator for MetaTrader 5 that combines signals from five classical technical indicators into a single smoothed signal line. The indicator visualizes overall market sentiment in a simple, intuitive format with color coding. Key Features Composite Analysis   — combines MA, RSI, Bollinger Bands, Stochastic, and ATR Smoothed Signal   — reduces market noise with configurable smoothing Visual Clarity   — color gradient from green (bullish) to red (bearish)
FREE
Rectangle Detector Alert
KATE CHIDINMA SNOGBA
Rectangle Detector Alert About Rectangle Detector Alert Indicator Rectangle detector alert detects manually drawn rectangle shapes on charts and sends out push notifications also auto extending the rectangles at the same time as new candles form. The concept behind this indicator is based on the manual trading of supply and demand zones. Most  traders prefer  to draw their supply (resistance) and demand (support) zones manually instead of  depending on indicators to auto draw  the zones.
이 제품의 구매자들이 또한 구매함
Azimuth Pro
Ottaviano De Cicco
5 (6)
LAUNCH PROMO Azimuth Pro price is initially set at 299$ for the first 100 buyers. Final price will be 499$ . THE DIFFERENCE BETWEEN RETAIL AND INSTITUTIONAL ENTRIES ISN'T THE INDICATOR — IT'S THE LOCATION. Most traders enter at arbitrary price levels, chasing momentum or reacting to lagging signals. Institutions wait for price to reach structured levels where supply and demand actually shift. Azimuth Pro maps these levels automatically: swing-anchored VWAP, multi-timeframe structure lines, an
Divergence Bomber
Ihor Otkydach
4.9 (86)
이 지표를 구매하신 분께는 다음과 같은 혜택이 무료로 제공됩니다: 각 거래를 자동으로 관리하고, 손절/익절 수준을 설정하며, 전략 규칙에 따라 거래를 종료하는 전용 도우미 툴 "Bomber Utility" 다양한 자산에 맞게 지표를 설정할 수 있는 셋업 파일(Set Files) "최소 위험", "균형 잡힌 위험", "관망 전략" 모드로 설정 가능한 Bomber Utility의 셋업 파일 이 전략을 빠르게 설치, 설정, 시작할 수 있도록 돕는 단계별 영상 매뉴얼 주의: 위의 모든 보너스를 받기 위해서는 MQL5 개인 메시지 시스템을 통해 판매자에게 연락해 주세요. 독창적인 커스텀 지표인 “Divergence Bomber(다이버전스 봄버)”를 소개합니다. 이 지표는 MACD 다이버전스(괴리) 전략을 기반으로 한 올인원(All-in-One) 거래 시스템입니다. 이 기술 지표의 주요 목적은 가격과 MACD 지표 간의 다이버전스를 감지하고, **향후 가격이 어느 방향으로 움직일지를 알려주는
OmniSync Projection
Antonio-alin Teculescu
5 (1)
Chronos Fractal Engine is an innovative price projection indicator for MetaTrader 5, designed to transform your technical analysis by intelligently identifying and projecting historical price patterns. Built upon an advanced correlation algorithm and the fractal principles of the market, this powerful tool visualizes potential future price movements, giving you a unique edge in your trading decisions. What is Chronos Fractal Engine? At its core, the Chronos Fractal Engine employs a sophisticat
Btmm state engine pro
Garry James Goodchild
5 (3)
BTMM State Engine Pro is a MetaTrader 5 indicator for traders who use the Beat The Market Maker approach: Asian session context, kill zone timing, level progression, peak formation detection, and a multi-pair scanner from a single chart. It combines cycle state logic with a built-in scanner dashboard so you do not need the same tool on many charts at once. What it does Draws the Asian session range; session times can follow broker server offset or be set in inputs. Tracks level progression (L
Bill Williams Advanced
Siarhei Vashchylka
5 (11)
Bill Williams Advanced is designed for automatic chart analysis using Bill Williams' "Profitunity" system. The indicator analyzes four timeframes at once. Manual (Be sure to read before purchasing) Advantages 1. Analyzes the chart using Bill Williams' "Profitunity" system. Signals are displayed in a table in the corner of the screen and on the price chart. 2. Finds all known AO and AC signals, as well as zone signals. Equipped with a trend filter based on the Alligator. 3. Finds "Divergence Bar
Quantum TrendPulse
Bogdan Ion Puscasu
5 (22)
SuperTrend   ,   RSI   ,   Stochastic   의 힘을 하나의 포괄적인 지표로 결합하여 트레이딩 잠재력을 극대화하는 궁극의 트레이딩 도구   인 Quantum TrendPulse를   소개합니다. 정밀성과 효율성을 추구하는 트레이더를 위해 설계된 이 지표는 시장 추세, 모멘텀 변화, 최적의 진입 및 종료 지점을 자신 있게 식별하는 데 도움이 됩니다. 주요 특징: SuperTrend 통합:   주요 시장 추세를 쉽게 따라가고 수익성의 물결을 타세요. RSI 정밀도:   매수 과다 및 매도 과다 수준을 감지하여 시장 반전 시점을 파악하는 데 적합하며 SuperTrend 필터로 사용 가능 확률적 정확도:   변동성이 큰 시장에서 숨겨진 기회를 찾기 위해 확률적 진동   을 활용하고 SuperTrend의 필터로 사용 다중 시간대 분석:   M5부터 H1 또는 H4까지 다양한 시간대에 걸쳐 시장을 최신 상태로 유지하세요. 맞춤형 알림:   맞춤형 거래 조건이 충족되면
RelicusRoad Pro MT5
Relicus LLC
5 (24)
RelicusRoad Pro: 퀀트 시장 운영 체제 70% 할인 평생 이용권 (한정 시간) - 2,000명 이상의 트레이더와 함께하세요 왜 대부분의 트레이더는 "완벽한" 지표를 가지고도 실패할까요? 진공 상태에서 단일 개념 만으로 거래하기 때문입니다. 문맥 없는 신호는 도박입니다. 지속적인 승리를 위해서는 컨플루언스(중첩) 가 필요합니다. RelicusRoad Pro는 단순한 화살표 지표가 아닙니다. 완전한 퀀트 시장 생태계 입니다. 독점적인 변동성 모델링을 사용하여 가격이 이동하는 "공정 가치 로드"를 매핑하고, 단순 노이즈와 실제 구조적 돌파를 구분합니다. 추측은 그만두세요. 기관급 로드 로직으로 거래를 시작하세요. 핵심 엔진: "Road" 알고리즘 시스템의 중심에는 시장 상황에 실시간으로 적응하는 동적 변동성 채널인 Road Algo 가 있습니다. 세이프 라인(평형) 과 가격이 수학적으로 반전될 가능성이 높은 확장 레벨 을 투영합니다. Simple Road: 일반적인 시장을 위
CGE Trading Suite
Carl Gustav Johan Ekstrom
5 (1)
CGE Trading Suite delivers the analytical edge typically reserved for professional trading desks. The platform integrates a full suite of analytical tools into one seamless workflow: dynamic grid mapping, liquidity behavior analysis, ECM, trend lines, MIDAS, trade cycles, and directional channel projections. Together, these provide a unified view of market structure and momentum. Directional clarity is further enhanced by the capital flow index, which measures currency basket strength to identif
ARIPoint
Temirlan Kdyrkhan
ARIPoint is a powerful trading companion designed to generate high-probability entry signals with dynamic TP/SL/DP levels based on volatility. Built-in performance tracking shows win/loss stats, PP1/PP2 hits, and success rates all updated live. Key Features: Buy/Sell signals with adaptive volatility bands Real-time TP/SL/DP levels based on ATR Built-in MA Filter with optional ATR/StdDev volatility Performance stats panel (Success, Profit/Loss, PP1/PP2) Alerts via popup, sound, push, or email Cu
Berma Bands
Muhammad Elbermawi
5 (8)
Berma Bands(BBs) 지표는 시장 동향을 파악하고 이를 활용하려는 트레이더에게 귀중한 도구입니다. 가격과 BBs 간의 관계를 분석함으로써 트레이더는 시장이 추세 단계인지 범위 단계인지를 분별할 수 있습니다. 자세한 내용을 알아보려면 [ Berma Home Blog ]를 방문하세요. 버마 밴드는 세 개의 뚜렷한 선으로 구성되어 있습니다. 어퍼 버마 밴드, 미들 버마 밴드, 로어 버마 밴드입니다. 이 선들은 가격 주위에 그려져 전체 추세에 대한 가격 움직임을 시각적으로 표현합니다. 이 밴드들 사이의 거리는 변동성과 잠재적인 추세 반전에 대한 통찰력을 제공할 수 있습니다. 버마 밴드 라인이 각각에서 분리될 때, 그것은 종종 시장이 횡보 또는 범위 이동 기간에 접어들고 있음을 시사합니다. 이는 명확한 방향 편향이 없음을 나타냅니다. 트레이더는 이러한 기간 동안 추세를 파악하기 어려울 수 있으며 더 명확한 추세가 나타날 때까지 기다릴 수 있습니다. 버마 밴드 라인이 단일 라인으로
Advanced Supply Demand MT5
Bernhard Schweigert
4.53 (15)
현재 33% 할인! 초보자나 전문 트레이더를 위한 최고의 솔루션! 이 보조지표는 우리가 다수의 독창적 기능과 새로운 공식을 통합한 독특하고 고품질이며 저렴한 거래 도구입니다. 이 업데이트를 통해 이중 시간대를 표시할 수 있습니다. 더 높은 TF를 표시할 수 있을 뿐만 아니라 차트 TF와 더 높은 TF 모두를 표시할 수 있습니다: 중첩 영역 표시. 모든 Supply Demand 트레이더들이 좋아할 것입니다. :) 중요한 정보 공개 Advanced Supply Demand의 잠재력을 극대화하려면 다음을 방문하십시오. https://www.mql5.com/ko/blogs/post/720245   진입 또는 목표의 명확한 트리거 포인트를 정확히 찾아냄으로 해서 거래가 어떻게 개선될지 상상해 보십시오. 새로운 알고리즘을 기반으로 매수자와 매도자 간의 잠재적인 불균형을 훨씬 더 쉽게 분간할 수 있습니다. 왜냐하면 가장 강한 공급영역과 가장 강한 수요 영역과 과거에 어떻게 진행 되었는지를(이전
Ultimate SMC Indicator
Hicham Mahmoud Almoustafa
1 (1)
Ultimate SMC PRO – Smart Money Concepts Indicator (Order Blocks, FVG, Liquidity, BOS) for MetaTrader 5  Ultimate SMC PRO is a professional trading indicator designed to visualize Smart Money Concepts directly on the chart. The indicator combines several institutional trading tools in one system to help traders identify potential high-probability trading zones. ULTIMATE SMC INDICATOR — COMPLETE TRADING GUIDE +   SMC Bridge The indicator analyzes market structure, liquidity behavior an
Grabber System MT5
Ihor Otkydach
4.83 (23)
탁월한 기술적 지표인 Grabber를 소개합니다. 이 도구는 즉시 사용 가능한 “올인원(All-Inclusive)” 트레이딩 전략으로 작동합니다. 하나의 코드 안에 강력한 시장 기술 분석 도구, 매매 신호(화살표), 알림 기능, 푸시 알림이 통합되어 있습니다. 이 인디케이터를 구매하신 모든 분들께는 다음의 항목이 무료로 제공됩니다: Grabber 유틸리티: 오픈 포지션을 자동으로 관리하는 도구 단계별 영상 매뉴얼: 설치, 설정, 그리고 실제 거래 방법을 안내 맞춤형 세트 파일: 인디케이터를 빠르게 자동 설정하여 최고의 성과를 낼 수 있도록 도와줍니다 다른 전략은 이제 잊어버리세요! Grabber만이 여러분을 새로운 트레이딩의 정점으로 이끌어 줄 수 있습니다. Grabber 전략의 주요 특징: 거래 시간 프레임: M5부터 H4까지 거래 가능한 자산: 어떤 자산이든 사용 가능하지만, 제가 직접 테스트한 종목들을 추천드립니다 (GBPUSD, GBPCAD, GBPCHF, AUDCAD, AU
AriX
Temirlan Kdyrkhan
1 (4)
AriX Indicator for MT5 A powerful trend-following and signal-evaluation tool AriX is a custom MT5 indicator that combines Moving Averages and ATR-based risk/reward logic to generate clear buy/sell signals. It visualizes dynamic SL/TP levels, evaluates past trade outcomes, and displays win/loss statistics in a clean on-chart panel. Key features include: Buy/Sell signals based on MA crossovers ATR-based SL/TP1/TP2/TP3 levels with visual lines and labels Signal outcome tracking with real-time stat
Meravith MT5
Ivan Stefanov
5 (1)
마켓 메이커를 위한 도구. Meravith는 다음과 같은 기능을 제공합니다: 모든 타임프레임을 분석하고 현재 유효한 추세를 표시합니다. 강세와 약세 거래량이 동일한 유동성 구간(거래량 균형 구간)을 강조 표시합니다. 서로 다른 타임프레임의 모든 유동성 레벨을 차트에 직접 표시합니다. 텍스트 기반 시장 분석을 생성하여 참고용으로 제공합니다. 현재 추세를 기반으로 목표가, 지지선 및 손절가를 계산합니다. 거래의 위험 대비 보상 비율(Risk/Reward)을 계산합니다. 계좌 잔고에 따라 포지션 크기를 산출하고 잠재 수익을 추정합니다. 시장에 중대한 변화가 발생할 경우 경고도 제공합니다. 지표의 주요 라인: 강세/약세 거래량 소진 라인 — 목표가로 사용됩니다. 시장 추세를 나타내는 라인. 시장이 강세인지 약세인지에 따라 색상이 변경되며 추세 지지선 역할을 합니다. 색상은 주로 시장 심리를 보여줍니다. 거래량 균형선(Eq). Eq(Volume Equilibrium) 라인은 시스템의 핵심입니
Shock Pullback
Suleiman Alhawamdah
5 (1)
간단히 말해, 현재 캔들 옆에 흰색 숫자(‘핍’이라고 불림)의 움직임이 나타나기 시작하면 거래를 시작할 수 있습니다. 흰색 ‘핍’은 현재 매수 또는 매도 거래가 활성화되어 있으며 흰색으로 표시된 것처럼 올바른 방향으로 움직이고 있음을 나타냅니다. 흰색 핍의 움직임이 멈추고 정적인 녹색으로 바뀌면 이는 현재 모멘텀의 종료를 의미합니다. 숫자의 녹색은 매수 또는 매도 거래를 통해 얻은 총 수익을 ‘핍’ 단위로 나타냅니다. 또한, 인디케이터 내의 다른 고급 전문 분석 도구를 활용하여 거래를 시작할 수 있습니다. 인디케이터에 표시되는 신호와 색상을 관찰함으로써 높은 정확도로 수많은 스캘핑 기회를 포착할 수 있습니다. 테스트 중이거나 실시간 차트에서 인디케이터를 충분히 이해하는 것이 중요합니다. 대부분의 외환 시장에 적합: 금 거래 및 인기 있는 지수 시장(Dow Jones, S&P 500, Nasdaq, DAX 등), 그리고 EUR/USD, GBP/USD, USD/JPY 등 강력한 통화쌍
우선적으로, 이 거래 도구는 전문적인 거래에 이상적인 비-다시 그리기 및 지연되지 않는 지표입니다.  온라인 강좌, 사용자 매뉴얼 및 데모. 스마트 가격 액션 컨셉트 인디케이터는 신규 및 경험 많은 트레이더 모두에게 매우 강력한 도구입니다. Inner Circle Trader Analysis 및 Smart Money Concepts Trading Strategies와 같은 고급 거래 아이디어를 결합하여 20가지 이상의 유용한 지표를 하나로 결합합니다. 이 인디케이터는 스마트 머니 컨셉트에 중점을 두어 대형 기관의 거래 방식을 제공하고 이동을 예측하는 데 도움을 줍니다.  특히 유동성 분석에 뛰어나 기관이 어떻게 거래하는지 이해하는 데 도움을 줍니다. 시장 트렌드를 예측하고 가격 변동을 신중하게 분석하는 데 탁월합니다. 귀하의 거래를 기관 전략에 맞추어 시장의 동향에 대해 더 정확한 예측을 할 수 있습니다. 이 인디케이터는 시장 구조를 분석하고 중요한 주문 블록을 식별하고 다양
Trend Forecaster
Alexey Minkov
5 (7)
The Trend Forecaster indicator utilizes a unique proprietary algorithm to determine entry points for a breakout trading strategy. The indicator identifies price clusters, analyzes price movement near levels, and provides a signal when the price breaks through a level. The Trend Forecaster indicator is suitable for all financial assets, including currencies (Forex), metals, stocks, indices, and cryptocurrencies. You can also adjust the indicator to work on any time frames, although it is recommen
소개       Quantum Breakout PRO   , 브레이크아웃 존 거래 방식을 변화시키는 획기적인 MQL5 지표! 13년 이상의 거래 경험을 가진 숙련된 트레이더 팀이 개발한       퀀텀 브레이크아웃 PRO       혁신적이고 역동적인 브레이크아웃 존 전략으로 거래 여정을 새로운 차원으로 끌어올리도록 설계되었습니다. Quantum Breakout Indicator는 5개의 이익 목표 영역이 있는 브레이크아웃 영역의 신호 화살표와 브레이크아웃 상자를 기반으로 한 손절 제안을 제공합니다. 초보자 거래자와 전문 거래자 모두에게 적합합니다. Quantum EA 채널:       여기를 클릭하세요 중요한! 구매 후 설치 매뉴얼을 받으려면 개인 메시지를 보내주십시오. 추천: 기간: M15 통화쌍: GBPJPY, EURJPY, USDJPY,NZDUSD, XAUUSD 계정 유형: 스프레드가 매우 낮은 ECN, Raw 또는 Razor 브로커 시간: GMT +3 중개인 :
ZIVA Signal Intelligence
Hassan Abdullah Hassan Al Balushi
ZIVA Signal Intelligence An Adaptive, Modular Market Intelligence System ZIVA Signal Intelligence is not positioned as a conventional trading indicator. It is a fully integrated, proprietary market intelligence system engineered to deliver structured, high-precision interpretation of price behavior within a controlled analytical environment. Developed through an independent architectural approach, ZIVA does not rely on, derive from, or replicate existing indicators. It represents a standalone
Ace Trend
Mikhail Sergeev
5 (3)
우리는 당신에게 트렌드 거래의 세계에서 게임의 규칙을 변경하는 혁신적인 지표를 제시한다. 이 표시기는 성능을 재고하고 거래 경험을 전례없는 높이로 높이도록 설계되었습니다. 우리의 표시기는 경쟁 업체와 차별화 된 고급 기능의 고유 한 조합을 자랑합니다. "실제 가격 요인"의 첨단 기술은 가장 어렵고 휘발성 시장 상황에서도 탁월한 안정성을 보장합니다. 불안정한 패턴,깨진 지표 및 의식적이고 통제 된 거래에 작별 인사를하십시오. 표시기는 단지 아름다운 그림이 아닙니다! 지표는 거래자의 편으로 확률을 이동시켜 이익을 얻어야 합니다. 표시 신호(완전 자동 모드)에 따라 거래 결과에 익숙해: https://www.mql5.com/ko/signals/2339244 표시기는 형성된 막대에 다시 그리지 않습니다. 막대가 형성된 경우 표시기 판독 값은 변경되지 않습니다. 이 표시기는 모든 시간대에 작동합니다. 표준은 시간대입니다. 귀하의 의견은 매우 중요합니다! 당신은 어떤 질문,제안이,또는 당신의
" Dynamic Scalper System MT5 " 지표는 추세 파동 내에서 스캘핑 방식으로 거래하도록 설계되었습니다. 주요 통화쌍 및 금에서 테스트되었으며, 다른 거래 상품과의 호환성이 가능합니다. 추가적인 가격 변동 지원을 통해 추세에 따라 단기 포지션 진입 신호를 제공합니다. 지표의 원리 큰 화살표는 추세 방향을 결정합니다. 작은 화살표 형태의 스캘핑 신호를 생성하는 알고리즘은 추세 파동 내에서 작동합니다. 빨간색 화살표는 상승 방향을, 파란색 화살표는 하락 방향을 나타냅니다. 민감한 가격 변동선은 추세 방향으로 그려지며, 작은 화살표의 신호와 함께 작용합니다. 신호는 다음과 같이 작동합니다. 적절한 시점에 선이 나타나면 진입 신호가 형성되고, 선이 있는 동안 미결제 포지션을 유지하며, 완료되면 거래를 종료합니다. 권장되는 작업 시간대는 M1~H4입니다. 화살표는 현재 캔들에 형성되며, 다음 캔들이 이미 시작되었더라도 이전 캔들의 화살표는 다시 그려지지 않습니다. 입
Entry Points Pro for MT5
Yury Orlov
4.48 (138)
다시 색을 칠하지 않고 거래에 진입할 수 있는 정확한 신호를 제공하는 MT5용 지표입니다. 외환, 암호화폐, 금속, 주식, 지수 등 모든 금융 자산에 적용할 수 있습니다. 매우 정확한 추정값을 제공하고 매수와 매도의 가장 좋은 시점을 알려줍니다. 하나의 시그널로 수익을 내는 지표의 예와 함께 비디오 (6:22)시청하십시오! 대부분의 거래자는 Entry Points Pro 지표의 도움으로 첫 거래 주 동안 트레이딩 결과를 개선합니다. 저희의   Telegram Group 을 구독하세요! Entry Points Pro 지표의 좋은점. 재도색이 없는 진입 신호 신호가 나타나고 확인되면(시그널 캔들이 완성된 경우) 신호는 더 이상 사라지지 않습니다. 여타 보조지표의 경우 신호를 표시한 다음 제거되기 때문에 큰 재정적 손실로 이어집니다. 오류 없는 거래 게시 알고리즘을 통해 트레이드(진입 또는 청산)를 할 이상적인 순간을 찾을 수 있으며, 이를 통해 이를 사용하는 모든 거래자의 성공률이
Introduction to X3 Chart Pattern Scanner X3 Cherart Pattern Scanner is the non-repainting and non-lagging indicator detecting X3 chart patterns including Harmonic pattern, Elliott Wave pattern, X3 patterns, and Japanese Candlestick patterns. Historical patterns match with signal patterns. Hence, you can readily develop the solid trading strategy in your chart. More importantly, this superb pattern scanner can detect the optimal pattern of its kind. In addition, you can switch on and off individu
이 지표는 실제 거래에 완벽한 자동 파동 분석 지표입니다! 사례... 참고:   웨이브 그레이딩에 서양식 이름을 사용하는 데 익숙하지 않습니다. Tang Lun(Tang Zhong Shuo Zen)의 명명 규칙의 영향으로 기본 웨이브를   펜   으로 명명하고 2차 웨이브 밴드를   세그먼트   로 명명했습니다. 동시에, 세그먼트에는 추세 방향이 있습니다.   주요 추세 세그먼트에는   이름이 지정되지만(이 이름 지정 방법은 향후 노트에서 사용됩니다. 먼저 말씀드리겠습니다.) 알고리즘은 굴곡 이론과 거의 관련이 없으므로 그렇게 해서는 안 됩니다. 이는 나의 시장 분석을   통해 요약된 끊임없이 변화하고 복잡한 운영 규칙을   반영합니다. 밴드는 더 이상 사람마다 다르지 않도록 표준화되고 정의되었습니다. 인위적인 간섭의 드로잉 방법은 시장 진입을 엄격하게 분석하는 데 핵심적인 역할을 합니다. 이 지표를 사용하는 것은 거래 인터페이스의 미학을 개선하고 원래의 K-line 거래를
Trade smarter, not harder: Empower your trading with Harmonacci Patterns This is arguably the most complete harmonic price formation auto-recognition indicator you can find for the MetaTrader Platform. It detects 19 different patterns, takes fibonacci projections as seriously as you do, displays the Potential Reversal Zone (PRZ) and finds suitable stop-loss and take-profit levels. [ Installation Guide | Update Guide | Troubleshooting | FAQ | All Products ] It detects 19 different harmonic pri
이 위치가 매수에 적합한지 판단하는 데 도움을 줍니다. 이 위치가 매도에 적합한지 판단하는 데 도움을 줍니다. 네 개의 지표가 동시에 바닥에 도달하면 반등 기회를 중점적으로 살펴보시기 바랍니다. 네 개의 지표가 동시에 상단에 위치하면 하락 기회를 중점적으로 살펴보시기 바랍니다. 이 시스템은 중국의 첨단 알고리즘 기술과 고급 수학 모델링 체계를 기반으로 구축되었습니다. 저는 주로 XAUUSD M5 주기에서 이 지표를 사용하며, 이 주기가 가장 좋은 결과를 보여줍니다. 이 지표의 알고리즘과 수학 공식은 매우 복잡하기 때문에 테스트 시 진행 속도가 느릴 수 있습니다. 테스트할 때는 지표가 리페인트되는지, 지연되는지만 확인하시면 됩니다. 정식 버전은 실제 사용 시 더 안정적입니다. 이 지표 시스템은 절대 리페인트하지 않으며 미래 데이터를 사용하지 않습니다. 구매 전에 직접 테스트하고 확인하실 수 있습니다. 이 지표에는 완전히 개인화된 알림 시스템이 포함되어 있으며, 아래 링크를 통해 확인하
ACB Breakout Arrows MT5
KEENBASE SOFTWARE SOLUTIONS
3.5 (2)
ACB Breakout Arrows 지표는 특별한 돌파 패턴을 감지하여 시장에서 중요한 진입 신호를 제공합니다. 이 지표는 차트를 지속적으로 스캔하면서 한 방향으로 움직임이 자리 잡을 때를 포착하여 큰 움직임 직전에 정확한 진입 신호를 제공합니다. 다중 종목 및 다중 시간대 스캐너는 여기에서 확인하세요 - ACB Breakout Arrows MT5용 스캐너 핵심 기능 지표가 자동으로 손절(Stop Loss) 및 익절(Take Profit) 수준을 제공합니다. 모든 시간대의 돌파 신호를 추적하는 MTF 스캐너 대시보드 포함. 데이 트레이더, 스윙 트레이더 및 스캘퍼에게 적합합니다. 신호 정확도를 높이기 위해 최적화된 알고리즘 사용. 손익분기점 또는 빠른 수익 목표를 위한 특별한 라인 (Quick Profit Line) 제공. 승률, 성공 비율, 평균 수익 등의 성과 분석 지표 제공. 재도색 없음. 신호는 고정되어 신뢰할 수 있습니다. 거래 확인 - ACB Trade Filter 지
OrderFlow Absorption – MT5용 전문 델타 & 흡수 신호 인디케이터 OrderFlow Absorption으로 진정한 오더플로우 분석의 힘을 경험하세요. MetaTrader 5를 위한 궁극의 델타 히스토그램 및 흡수 신호 인디케이터입니다. 가격 움직임의 이면에서 실제로 무슨 일이 일어나는지 알고 싶은 트레이더를 위해 설계된 이 도구는, 시장을 움직이는 숨겨진 매수/매도 압력과 흡수 이벤트를 드러냅니다. 주요 기능 델타 히스토그램 시각화:   매수와 매도 압력을 색상별 히스토그램으로 즉시 확인할 수 있습니다. 흡수 신호 감지:   고급 로직으로 강세 및 약세 흡수 이벤트를 식별하여 반전 신호를 미리 알려줍니다. 차트 마커:   흡수 신호가 차트에 직접 표시되어 시각적으로 쉽게 확인할 수 있습니다. 팝업 알림:   새로운 흡수 신호가 발생하면 실시간으로 알림을 받을 수 있습니다. 사용자 지정 임계값:   약한 신호는 필터링하고, 확률이 높은 기회에 집중할 수 있습니다.
Gold Xausd Hunter
Metin Erkamoglu
MATADOR GOLD — XAUUSD M5 ( TimeFrame M5 ) Scalp Signals for MT5 Strategy Tester Visualization Video https://youtu.be/_cWbbyg2RSs Not every move deserves a signal. MATADOR GOLD was built for traders who prefer selective, structured, high-quality decision support over noisy, hyperactive signal tools. Designed specifically for Gold (XAUUSD / GOLD) on M5 , MATADOR helps you read short-term momentum with more discipline by combining trend logic, market-condition filters, momentum timing, spread pro
필터:
리뷰 없음
리뷰 답변