Ppr PA MT5

"PPR PA" is a technical indicator for the MetaTrader 5 platform, designed to automatically identify the PPR (Push-Pull-Rejection) pattern on the chart. This is a three-candle reversal pattern that can signal the end of a correction and resumption of the trend, providing traders with entry signals.

What is the PPR Pattern:

PPR is a three-candle reversal formation:

• Bullish PPR: two consecutive bearish candles (the second with a lower high and low), then a bullish candle that closes above the high of the second candle
• Bearish PPR: two consecutive bullish candles (the second with a higher high and low), then a bearish candle that closes below the low of the second candle

Features:

• Automatic detection of PPR patterns on the chart
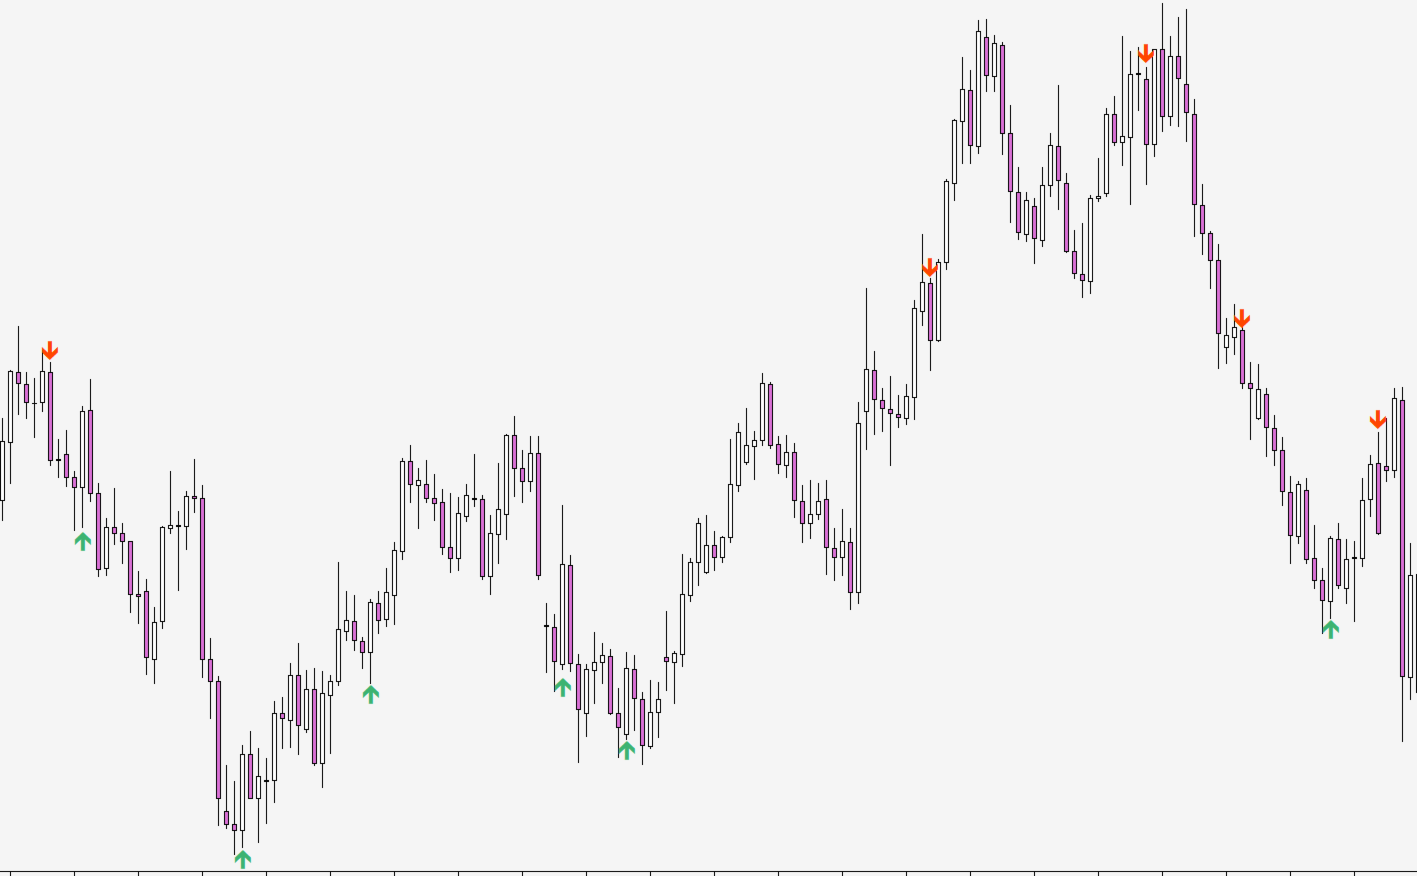
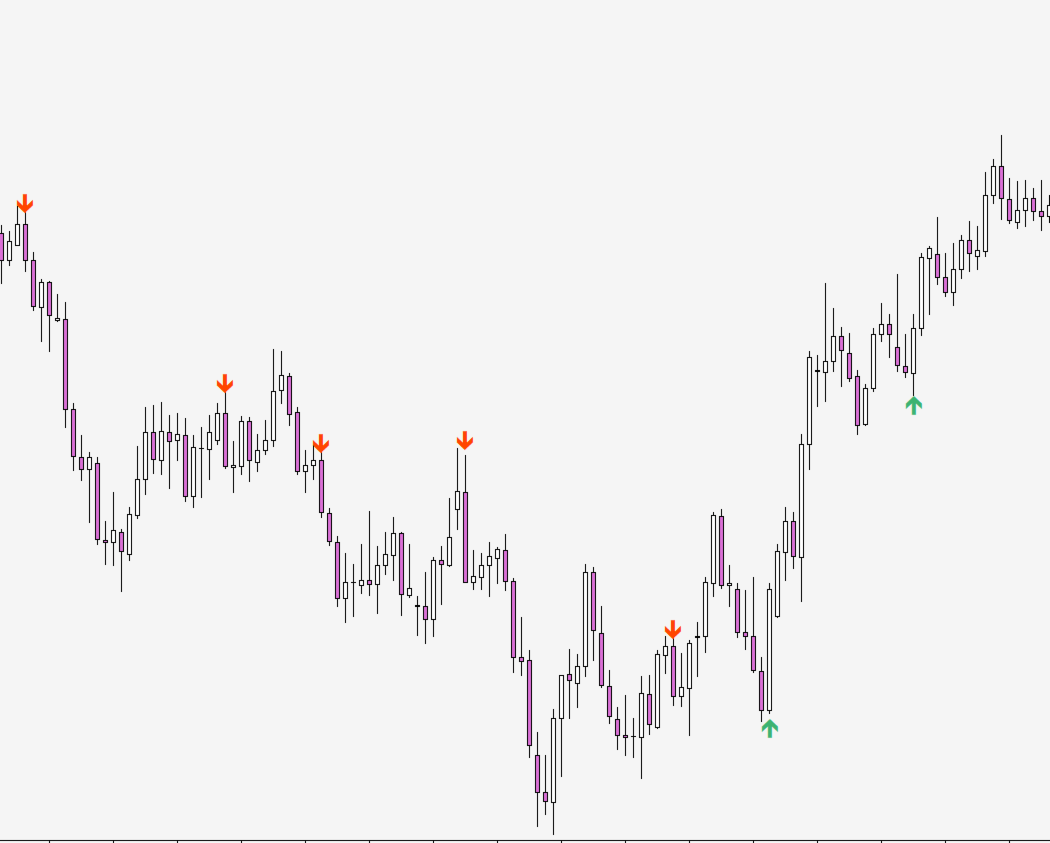
• Visual marking with green up arrows for bullish PPR and red down arrows for bearish PPR
• Dynamic arrow positioning relative to bars
• Customizable arrow colors

Indicator Parameters:

• UpArrowColor - color of arrows for bullish patterns (green by default)
• DownArrowColor - color of arrows for bearish patterns (red by default)

How to Use:

1. Attach the indicator to the chart in MetaTrader 5
2. Adjust arrow colors according to your preferences
3. Green up arrow indicates a bullish PPR reversal pattern
4. Red down arrow indicates a bearish PPR reversal pattern
5. Use signals as part of your trading strategy

Trading Strategy:

The PPR pattern is often used to enter in the direction of the main trend after a correction. A bullish PPR signals a potential buy after a downward correction, while a bearish PPR signals a potential sell after an upward correction. It is recommended to combine the indicator with trend analysis, support/resistance levels, and other technical tools to improve signal accuracy.


Disclaimer:

• It is recommended to test the indicator on a demo account before using it on a live trading account
• The indicator is provided "as is" without any warranties regarding its effectiveness or suitability for specific trading purposes
• Not financial advice
추천 제품
Renko Chart
Marcin Konieczny
3.56 (9)
This indicator allows to display Renko charts in the indicator window. Renko charts show only price movements that are bigger than the specified box size. It helps to eliminate noise and allows to focus on main trends. Time is not a factor here. Only price movements are taken into account. That's why Renko chart is not synchronized with the main chart it is attached to. Indicator works in two modes: CLOSE - only close prices are taken into account while building the chart HIGH_LOW - only high/l
FREE
Haven FVG Indicator
Maksim Tarutin
5 (8)
인디케이터   Haven FVG   는 시장을 분석하는 도구로, 차트에서 비효율성 영역(Fair Value Gaps, FVG)을 식별하여 트레이더에게 가격 분석 및 거래 결정을 위한 주요 수준을 제공합니다. 다른 제품 ->  여기 주요 특징: 개별 색상 설정: 상승 FVG 색상   (Bullish FVG Color). 하락 FVG 색상   (Bearish FVG Color). 유연한 FVG 시각화: FVG를 검색할 최대 캔들 수. FVG 영역을 특정 바 수만큼 추가로 연장. FVG에 대한 채우기를 활성화할 수 있습니다. 중앙선(Middle Line): 색상 및 선 스타일 선택(예: 점선). 더 정확한 선 두께 조정. 일반 설정: FVG를 현재 바까지 확장. 채우기가 있는 역사적 FVG 제외하여 최신 데이터에 집중. 차트에서 비효율성 영역을 분석하고 근거 있는 거래 결정을 내리는 간단하고 효과적인 방법.
FREE
VWAP Wave
Rizwan Akram
VWAP WAVE [Riz] - MT5 Indicator               Advanced VWAP Divergence Detection System VWAP Wave is a professional-grade Volume Weighted Average Price indicator with built-in divergence detection system. It identifies high-probability reversal and continuation signals by analyzing price-VWAP relationships across multiple timeframes.
FREE
Trendline mt5 indicator
David Muriithi
4 (2)
Are you tired of drawing trendlines every time you're analyzing charts? Or perhaps you would like more consistency in your technical analysis. Then this is for you. This indicator will draw trend lines automatically when dropped on a chart. How it works Works similar to standard deviation channel found on mt4 and mt5. It has 2 parameters: 1. Starting Bar 2. Number of bars for calculation The   starting bar   is the bar which drawing of the trend lines will begin, while the   number of bars for c
FREE
Pin Bars MT5
Yury Emeliyanov
Main purpose:   "Pin Bars"   is designed to automatically detect pin bars on financial market charts. A pin bar is a candle with a characteristic body and a long tail, which can signal a trend reversal or correction. How it works:   The indicator analyzes each candle on the chart, determining the size of the body, tail and nose of the candle. When a pin bar corresponding to predefined parameters is detected, the indicator marks it on the chart with an up or down arrow, depending on the directi
FREE
Donchian Breakout And Rsi
Mattia Impicciatore
5 (1)
개요 이 지표는 클래식 돈치안 채널(Donchian Channel) 의 향상된 버전으로, 실전 트레이딩을 위한 다양한 기능이 추가되었습니다. 표준 세 개의 선(상단, 하단, 중앙선) 외에도 브레이크아웃 을 감지하여 차트에 화살표로 시각적으로 표시하며, 차트를 깔끔하게 보기 위해 현재 추세 방향의 반대 라인만 표시 합니다. 지표 기능: 시각적 신호 : 브레이크아웃 시 컬러 화살표 표시 자동 알림 : 팝업, 푸시 알림, 이메일 RSI 필터 : 시장의 상대 강도를 기반으로 신호 검증 사용자 맞춤 설정 : 색상, 선 두께, 화살표 코드, RSI 임계값 등 동작 원리 돈치안 채널은 다음을 계산합니다: 상단선 : 최근 N개의 종가 완료 캔들에서 가장 높은 고가 하단선 : 최근 N개의 종가 완료 캔들에서 가장 낮은 저가 중앙선 : 고가와 저가의 평균값 상방 브레이크아웃 은 종가가 상단선을 돌파할 때 발생하며, 하방 브레이크아웃 은 종가가 하단선 아래로 내려갈 때 발생합니다. 이 지표는: 세 개의
FREE
Swing Point BoS CHoCH Con Exp Alerts
Usiola Oluwadamilol Olagundoye
NOTE: Turn Pattern Scan ON This indicator identifies Swing Points, Break of Structure (BoS), Change of Character (CHoCH), Contraction and Expansion patterns which are plotted on the charts It also comes with Alerts & Mobile notifications so that you do not miss any trades. It can be used on all trading instruments and on all timeframes. The non-repaint feature makes it particularly useful in backtesting and developing profitable trading models. The depth can be adjusted to filter swing points.
FREE
XbigCandleFibo
Alex Sandro Aparecido
This indicator marks the 50% mark of each candle. It will help you make profitable scalping trades. If the next candle opens above the 50% mark of the previous candle, you should open a BUY position, and if the next candle opens below the 50% mark of the previous candle, you should open a SELL position. This strategy is very profitable. To make the most of it, keep an eye on the candle contexts on the left. Good luck!
FREE
Divergence Force
Alessandro Riggi
4.5 (2)
Divergence Force 다이버전스 지표 1.0 설명 Divergence Force 은 자산의 가격과 MACD(이동 평균 수렴 발산) 간의 다이버전스를 식별하기 위해 설계된 지표입니다. 이 지표는 가격과 MACD의 고점 및 저점에 자동으로 추세선을 그려 잠재적인 거래 기회를 강조합니다. 주요 기능 자동 다이버전스 식별 : 지표는 가격과 MACD 간의 강세 및 약세 다이버전스를 자동으로 감지합니다. 추세선 추적 : 가격의 연속적인 고점과 저점에 자동으로 추세선을 그리며, 이를 MACD의 고점 및 저점과 비교합니다. 매수 및 매도 신호 : 다이버전스가 식별되면 차트에 명확하게 매수("Buy") 및 매도("Sell") 신호를 표시합니다. 다이버전스가 감지되지 않으면 "Neutral"을 표시합니다. 표준 MACD 매개변수 : 표준 MACD 매개변수(12, 26, 9)를 사용하여 계산하여 신뢰할 수 있고 인식된 결과를 보장합니다. 다양한 시간대와의 호환성 : 1시간 시간대에서 작동하도록
FREE
RenkoExpert
Andrey Goida
3.8 (5)
Renko Expert Advisor based on Renko bar simulation.    The EA has two options for building Renko bars. Classic and ATR. In the classic version, renko bars are marked with areas on the main chart; in the ATR version, renko bars are modeled and drawn in the indicator window. Modeling renko bars inside the EA allows you to optimize the robot better than drawing renko bars offline.   Our new product based on artificial intelligence   https://www.mql5.com/ru/market/product/127820   Telegramm channel
FREE
멀티 타임프레임 지원, 사용자 정의 시각적 신호 및 구성 가능한 알림 시스템을 갖춘 Average True Range(ATR) 지표. 프리랜서 프로그래밍 서비스, 업데이트 및 기타 TrueTL 제품은 제 MQL5 프로필 에서 확인하실 수 있습니다. 피드백과 리뷰는 매우 감사하게 받겠습니다! ATR이란 무엇인가요? J. Welles Wilder가 개발한 Average True Range(ATR)는 시장 변동성을 측정하는 기술 지표입니다. 지정된 기간 동안의 True Range 평균을 계산합니다. True Range는 다음 중 가장 큰 값입니다: 현재 고가에서 현재 저가까지의 거리, 이전 종가에서 현재 고가까지의 거리, 또는 이전 종가에서 현재 저가까지의 거리. ATR은 가격 방향을 나타내지 않습니다 — 오직 변동성만 측정합니다. ATR이 상승하면 변동성 증가를 나타내고, ATR이 하락하면 변동성 감소를 신호합니다. 트레이더들은 ATR을 사용하여 시장 상황을 평가하고, 동적 손절매
FREE
Five Minute Drive
Kenan Ozkarakas
5 (2)
"Five Minute Drive" indicator that is designed to be used in the 5 minute timeframe only. One of its most important advantages is that it shows the general trend in the upper time frames when looking at the 5-minute timeframe. Therefore, when opening positions in the 5 minute timeframe, when it is in line with the trends in the upper timeframes, you are less likely to be upside down. If you can interpret the curvilinear and linear lines drawn by this indicator on the graphic screen with your geo
FREE
Dual WMA Entry System
Donovan Tjin-a-tak
차트에 두 개의 가중 이동평균선(WMA)을 표시하고 저모멘텀 및 횡보 구간을 자동으로 감지하는 전문 트레이딩 지표입니다. WMA1은 시가 기준으로 계산되며 약간의 오프셋이 적용되어 추세 방향을 나타냅니다. WMA2는 종가 기준으로 계산되어 모멘텀을 확인합니다. 두 WMA 사이의 간격이 좁아지면 캔들이 자동으로 회색으로 표시되어 시장이 횡보 또는 조정 구간에 있음을 알려줍니다. 이를 통해 신뢰도 낮은 구간에서의 진입을 줄일 수 있습니다. 외환, 지수, 원자재 등 모든 종목과 모든 타임프레임에서 사용 가능합니다. SuperSmooth WMA Trading System Pro 업그레이드 Pro 버전은 진입 및 청산 신호, 롱/숏 캔들 색상 표시, 상위 타임프레임 EMA 추세 필터, MACD 모멘텀 확인, SMA 방향 필터, 실시간 알림, 타임프레임 필터 기능을 제공합니다. 모든 필터 조건이 일치할 때만 신호를 생성하여 오신호를 크게 줄입니다. 이 지표가 유용하다고 생각하신다면 리뷰를
FREE
Auto Fibonacci
Ali Gokay Duman
5 (3)
This indicator calculates fibonacci levels via moving averages trend and draw these lines. You can change fast and slow Moving Averages settings for customization. Inputs: Fast MA Time Period :  64 Fast MA Shift: 0 Fast MA Method: Smoothed Fast MA Apply To: Median Price Slow MA Time Period: 32 Slow MA Shift: 0 Slow MA Method: Smoothed Slow MA Apply To: Median Price ZigZag: False ZigZag Color: Red ZigZag Type: DashDot ZigZag Width: VeryThin Fibo Settings TrendFibonacci: True FiboTrendColor: Black
FREE
Candle Countdown — MT5용 정확한 캔들 종료 시간 카운트다운 Candle Countdown은 차트 위에 현재 캔들이 종료될 때까지 남은 시간 을 표시하는 간단하고 정확한 도구입니다. 진입 시점이 캔들 마감에 의존하는 경우, 몇 초의 차이도 중요합니다. 이 인디케이터는 정확한 시간을 보여주어 서두르거나 추측하지 않고 결정을 내릴 수 있도록 도와줍니다. 캔들 종료 시간을 정확하게 제어하기 위한 인디케이터입니다. 표시 내용: 캔들 종료까지 남은 시간 현재 서버 시간 스프레드 Stop Level 타이머는 틱에 의존하지 않고 플랫폼의 내부 타이머를 통해 업데이트되므로, 시장 움직임이 적은 상황에서도 안정적으로 동작합니다. 이로 인해 낮은 변동성 구간에서도 부드럽고 안정적인 카운트다운을 제공합니다. 모든 정보는 배경 블록에 표시되어 어떤 차트 색상에서도 잘 보이며, 차트 분석을 방해하지 않습니다. 캔들 종료 시점이 가까워질수록 타이머 색상이 변경되어 빠르게 상황을 파악할 수
FREE
FlatBreakout MT5
Aleksei Vorontsov
FlatBreakout MT5 (Free Version) Flat Range Detector and Breakout Panel for MT5 — GBPUSD Only FlatBreakout MT5   is the free version of the professional FlatBreakoutPro MT5 indicator, specially designed for flat (range) detection and breakout signals on the   GBPUSD   pair only. Perfect for traders who want to experience the unique fractal logic of FlatBreakout MT5 and test breakout signals on a live market without limitations. Who Is This Product For? For traders who prefer to trade breakout of
FREE
RSI Divergence F
Andrey Dik
5 (3)
A professional tool for trading - the divergence indicator between the RSI and the price, which allows you to receive a signal about a trend reversal in a timely manner or catch price pullback movements (depending on the settings). The indicator settings allow you to adjust the strength of the divergence due to the angle of the RSI peaks and the percentage change in price, which makes it possible to fine-tune the signal strength. The indicator code is optimized and is tested very quickly as par
FREE
BerelzBox Darvas based
Barend Willem Van Den Berg
5 (1)
개요 BerelzBox Darvas는 MetaTrader 5용 Darvas Box 지표입니다. 현재 캔들에 실시간으로 업데이트되는 박스를 그리고 참조용으로 이전에 완성된 박스를 표시합니다. 박스는 색상으로 구분된 구역으로 나뉘어 잠재적 진입 영역과 돌파 조건을 식별하는 데 도움을 줍니다. 이 지표는 Nicolas Darvas의 고전적인 박스 이론을 기반으로 하며 현대적인 멀티 타임프레임 사용에 맞게 적용되었습니다. 작동 방식 지표는 선택한 타임프레임(기본값 H4)에서 캔들당 하나의 박스를 생성합니다. 현재 박스는 bar 0이 형성되는 동안 매 틱마다 업데이트됩니다. 이전 박스는 비교를 위해 고정된 상태로 유지됩니다. 각 박스는 6개의 그라데이션 구역으로 나뉩니다: 녹색 구역(하단 절반)은 매수 엣지 영역을 표시하며 박스 저점 근처에서 색상이 더 진합니다 빨간색 구역(상단 절반)은 매도 엣지 영역을 표시하며 박스 고점 근처에서 색상이 더 진합니다 점선 중간선이 두 절반을 구분합니다 설
FREE
ChartPan
Leandro Rodrigo Giron
Hey Trader! Boring with the Meta chart? Do you want to move it as you do in Profit? Your problems are over! Now available   Chart Panoramic   or   ChartPan   for closer friends, a utility that allows you to move the chart to better visualize the most relevant points for your trade. Recommend you to add a keyboard shortcut for quick access (Ctrl + Q - for example), because you will need to run   ChartPan   after symbol changing to "release" the chart again. To add a hotkey: after downloading
FREE
TrailingFusion
Christos Iakovou
FusionTrailing EA – Your Ultimate Weapon for Market Domination! Transform your trading and crush every market move with the most advanced trailing stop system available. FusionTrailing EA delivers unstoppable power with its dual-mode setup: • Fusion Mode: Automatically sets a bulletproof stop loss using a maximum loss threshold and activates smart trailing
FREE
FX Clock
Abderrahmane Benali
FXClock – Professional Clock Indicator for Traders Please leave a 5 star rating if you like this free tool! Thank you so much :) The FXClock indicator is a practical and simple tool that displays time directly on your trading platform, allowing you to track multiple key pieces of information at the same time. It is specially designed to help traders synchronize their trading with market hours and global sessions. Key Features: Displays the broker server time with precision. Displays your local c
FREE
Tenet Support and Resistance Pro
Lucas De Melo Carvalho Cruz
Ideal for scalpers, day traders and swing trades. Automatically identifies key support and resistance levels based on historical price data. It displays real-time trading zones and a precise countdown timer for each candle, helping traders make faster and more confident decisions. Fully customizable for multiple timeframes and instruments. The indicator analyzes historical price data to draw horizontal levels that represent key trading areas. It also displays, in real time, the current zone whe
FREE
멀티 타임프레임 지원, 커스터마이즈 가능한 시각적 신호, 설정 가능한 알림 시스템을 갖춘 Rate of Change(ROC) 지표입니다. 프리랜서 프로그래밍 서비스, 업데이트 및 기타 TrueTL 제품은 MQL5 프로필 에서 이용하실 수 있습니다. 피드백과 리뷰를 주시면 감사하겠습니다! ROC란 무엇인가요? Rate of Change(ROC)는 지정된 기간 동안 가격의 백분율 변화를 측정하는 모멘텀 오실레이터입니다. 현재 가격을 n기간 전 가격과 비교하여 차이를 백분율로 표현하므로 가격 움직임의 속도를 쉽게 파악할 수 있습니다. 양수 ROC 값은 상승 모멘텀을, 음수 값은 하락 모멘텀을 나타냅니다. ROC가 제로 라인을 크로스하면 잠재적인 추세 반전을 신호합니다. 트레이더들은 ROC를 사용하여 과매수 및 과매도 상태를 식별하고, 추세를 확인하며, 가격과 모멘텀 간의 다이버전스를 발견합니다. 기능: 화살표와 수직선을 통한 시각적 신호 마커 설정 가능한 트리거를 가진 3개의 독립적
FREE
AliPivot Points
Alexandra Voicu
AliPivot Points is a Meta Trader 5 Indicator that draws you the latest pivot points. You can choose from timeframes ranging from 1 Minute to 1 Month. Calculation methods for pivot points includes: Classic Pivot Points Camarilla Pivot Points Fibonacci Pivot Points Woodie Pivot Points You can personalize the line colors, style, and width to suit your preference. The indicator displays values on the right side of the chart. AliPivot Points values can also be utilized by developers for creating Expe
FREE
LongTerm
Edoardo Centorame
LongTerm — 중·장기 추세 방향 분석 지표 LongTerm 는 중·장기 추세의 강도와 질 을 해석하기 위해 설계된 방향성 분석 지표 로, 특히 롱(Long) 중심의 분석 에 초점을 맞추고 있습니다. 이 지표는 진입 신호용 지표가 아니며 , 운용 타이밍을 위한 도구도 아닙니다 . 단기 가격 변동에서 발생하는 노이즈를 줄이면서, 시장이 중·장기 롱 트렌드에 유리한지 불리한지 를 이해하도록 돕는 분석 도구입니다. 목적 LongTerm 의 주요 목적은 다음과 같습니다. 강하고 구조화된 롱 트렌드 식별 트렌드의 확장, 둔화, 소진 단계 구분 지배적인 방향성 컨텍스트 를 명확하게 제공 이는 스윙 트레이딩 과 중·장기 추세 분석 을 지향하는 트레이더에게 이상적인 도구입니다. 색상 해석 및 시장 상태 LongTerm 는 롱 트렌드의 다양한 단계를 직관적으로 읽을 수 있도록 설계된 색상 구조를 사용하여, 시장의 최적·최악의 조건 을 명확히 구분합니다. 녹색 라인 (상승 기울기
FREE
CDV Core
Pierpaolo De Nicolo
CDV Core is a MetaTrader 5 indicator designed to clearly display the structure of Cumulative Delta Volume (CVD) through dedicated candlesticks in a separate window. The indicator reconstructs the cumulative delta from M1 data and tick volume, transforming the flow of bullish and bearish pressure into a series of easy-to-read CVD candlesticks. The goal is to provide a clean and essential basis for analyzing the relationship between price movement and underlying volume pressure. What the indic
FREE
Cybertrade Double Bollinger Bands - MT5  The Bollinger Bands indicator shows the levels of different highs and lows that a security price has reached in a given duration and also their relative strength, where the highs are close to the upper line and the lows are close to the lower line. Our differential is to present this indicator in a double form, with the availability of its values ​​to simplify automation. It works on periods longer than the period visible on the chart. All values ​​are
FREE
VolumeBasedColorsBars
Henrique Magalhaes Lopes
VolumeBasedColorsBars — Free Powerful Volume Analysis for All Traders Unlock the hidden story behind every price bar! VolumeBasedColorsBars is a professional-grade, 100% FREE indicator that colorizes your chart candles based on real, adaptive volume analysis. Instantly spot surges in market activity, identify exhaustion, and catch the moves that matter. This indicator gives you:    • Dynamic color-coded bars for instant volume context    • Adaptive thresholds based on historical, session-awar
FREE
This utility EA will display simple renko, hence the name essential renko. The renko will be shown in a new tab and using custom symbol. Please do note (especially for those who new to Renko), that Renko does not follow timeline as it will follow price movement. That's why it has a lot of potential where you can attach any EA that you want and use any custom indicator in this new custom symbol for renko. Always use M1 timeframe. Most of the time you don't need to change anything. But if you d
FREE
This indicator is an automated version of the Fibonacci retracement (Fib) indicator. Deciding the best areas to use when drawing the fib can be tricky and this  indicator was made with that in mind. When you drop it on the chart it will automatically choose the best points to draw the fib with, but in case you aren't satisfied with those regions, you can adjust it as you wish.
FREE
이 제품의 구매자들이 또한 구매함
SuperScalp Pro
Van Minh Nguyen
5 (14)
SuperScalp Pro – 고급 다중 필터 스캘핑 인디케이터 시스템 SuperScalp Pro는 클래식 Supertrend와 여러 지능형 확인 필터를 결합한 고급 스캘핑 인디케이터 시스템입니다. 해당 인디케이터는 M1부터 H4까지 모든 타임프레임에서 효율적으로 작동하며, 특히 XAUUSD, BTCUSD 및 주요 외환 통화쌍에 적합합니다. 독립형 시스템으로 사용하거나 기존 거래 전략에 유연하게 통합할 수 있습니다. 이 인디케이터는 11개 이상의 필터를 통합하며, 빠른/느린 EMA, 추세 판별용 3개의 EMA, EMA 기울기(EMA slope), RSI, ADX, 거래량(Volume), VWAP, 볼린저 밴드 돌파(Bollinger Bands Breakout) 및 MACD 다이버전스 필터 등을 포함합니다. 스마트 캔들 필터는 캔들 종가를 확인하여 약한 신호를 제거하고, 3 EMA와 MACD 다이버전스 필터를 결합한 추세 인식 메커니즘은 더 높은 승률의 신호를 선별하는 데 도움을 줍니
Azimuth Pro
Ottaviano De Cicco
5 (6)
LAUNCH PROMO Azimuth Pro price is initially set at 299$ for the first 100 buyers. Final price will be 499$ . THE DIFFERENCE BETWEEN RETAIL AND INSTITUTIONAL ENTRIES ISN'T THE INDICATOR — IT'S THE LOCATION. Most traders enter at arbitrary price levels, chasing momentum or reacting to lagging signals. Institutions wait for price to reach structured levels where supply and demand actually shift. Azimuth Pro maps these levels automatically: swing-anchored VWAP, multi-timeframe structure lines, an
Divergence Bomber
Ihor Otkydach
4.89 (85)
이 지표를 구매하신 분께는 다음과 같은 혜택이 무료로 제공됩니다: 각 거래를 자동으로 관리하고, 손절/익절 수준을 설정하며, 전략 규칙에 따라 거래를 종료하는 전용 도우미 툴 "Bomber Utility" 다양한 자산에 맞게 지표를 설정할 수 있는 셋업 파일(Set Files) "최소 위험", "균형 잡힌 위험", "관망 전략" 모드로 설정 가능한 Bomber Utility의 셋업 파일 이 전략을 빠르게 설치, 설정, 시작할 수 있도록 돕는 단계별 영상 매뉴얼 주의: 위의 모든 보너스를 받기 위해서는 MQL5 개인 메시지 시스템을 통해 판매자에게 연락해 주세요. 독창적인 커스텀 지표인 “Divergence Bomber(다이버전스 봄버)”를 소개합니다. 이 지표는 MACD 다이버전스(괴리) 전략을 기반으로 한 올인원(All-in-One) 거래 시스템입니다. 이 기술 지표의 주요 목적은 가격과 MACD 지표 간의 다이버전스를 감지하고, **향후 가격이 어느 방향으로 움직일지를 알려주는
Entry In The Zone and SMC Multi Timeframe is a real-time market analysis tool developed based on Smart Money Concepts (SMC). It is designed to analyze market structure, price direction, reversal points, and key zones across multiple timeframes in a systematic way. The system displays Points of Interest (POI) and real-time No Repaint signals, with instant alerts when price reaches key zones or when signals occur within those zones. It functions as both an Indicator and a Signal System (2-in-1), c
RelicusRoad Pro MT5
Relicus LLC
5 (24)
RelicusRoad Pro: 퀀트 시장 운영 체제 70% 할인 평생 이용권 (한정 시간) - 2,000명 이상의 트레이더와 함께하세요 왜 대부분의 트레이더는 "완벽한" 지표를 가지고도 실패할까요? 진공 상태에서 단일 개념 만으로 거래하기 때문입니다. 문맥 없는 신호는 도박입니다. 지속적인 승리를 위해서는 컨플루언스(중첩) 가 필요합니다. RelicusRoad Pro는 단순한 화살표 지표가 아닙니다. 완전한 퀀트 시장 생태계 입니다. 독점적인 변동성 모델링을 사용하여 가격이 이동하는 "공정 가치 로드"를 매핑하고, 단순 노이즈와 실제 구조적 돌파를 구분합니다. 추측은 그만두세요. 기관급 로드 로직으로 거래를 시작하세요. 핵심 엔진: "Road" 알고리즘 시스템의 중심에는 시장 상황에 실시간으로 적응하는 동적 변동성 채널인 Road Algo 가 있습니다. 세이프 라인(평형) 과 가격이 수학적으로 반전될 가능성이 높은 확장 레벨 을 투영합니다. Simple Road: 일반적인 시장을 위
CGE Trading Suite
Carl Gustav Johan Ekstrom
5 (1)
CGE Trading Suite delivers the analytical edge typically reserved for professional trading desks. The platform integrates a full suite of analytical tools into one seamless workflow: dynamic grid mapping, liquidity behavior analysis, ECM, trend lines, MIDAS, trade cycles, and directional channel projections. Together, these provide a unified view of market structure and momentum. Directional clarity is further enhanced by the capital flow index, which measures currency basket strength to identif
이 지표를 구매하면 제 프로페셔널 트레이드 매니저를 무료로 드립니다. 우선 이 거래 시스템이 리페인팅, 리드로잉 및 레이그 인디케이터가 아니라는 점을 강조하는 것이 중요합니다. 이는 수동 및 로봇 거래 모두에 이상적인 것으로 만듭니다. 온라인 강좌, 설명서 및 프리셋 다운로드. "스마트 트렌드 트레이딩 시스템 MT5"은 새로운 및 경험이 풍부한 트레이더를 위해 맞춤형으로 제작된 종합적인 거래 솔루션입니다. 10개 이상의 프리미엄 인디케이터를 결합하고 7개 이상의 견고한 거래 전략을 특징으로 하여 다양한 시장 조건에 대한 다목적 선택이 가능합니다. 트렌드 추종 전략: 효과적인 트렌드 추이를 타기 위한 정확한 진입 및 손절 관리를 제공합니다. 반전 전략: 잠재적인 트렌드 반전을 식별하여 트레이더가 범위 시장을 활용할 수 있게 합니다. 스캘핑 전략: 빠르고 정확한 데이 트레이딩 및 단기 거래를 위해 설계되었습니다. 안정성: 모든 인디케이터가 리페인팅, 리드로잉 및 레이그가 아니므로 신뢰
Gold Entry Sniper
Tahir Mehmood
5 (6)
Gold Entry Sniper – 골드 스캘핑 & 스윙 트레이딩을 위한 전문 다중 시간 프레임 ATR 대시보드 Gold Entry Sniper 는 XAUUSD 및 기타 종목에 대해 정확한 매수/매도 신호 를 제공하는 고급 MetaTrader 5 지표입니다. ATR 트레일링 스톱 로직 과 다중 시간 프레임 분석 을 기반으로 설계되어 스캘핑과 스윙 트레이딩 모두에 적합합니다. 주요 기능 및 장점 다중 시간 프레임 분석 – M1, M5, M15 추세를 한눈에 확인. ATR 기반 트레일링 스톱 – 변동성에 따라 자동 조정. 전문 차트 대시보드 – 신호 상태, ATR 레벨, 회귀선, 매매 방향 표시. 명확한 매수/매도 마커 – 자동 화살표와 텍스트 라벨. 종료 알림 & 거래 관리 – 수익 보호를 위한 자동 종료 감지. 완전 사용자 설정 가능 – 대시보드 위치, 색상, ATR/회귀선 파라미터 조정. 골드(XAUUSD) 최적화 – M1~M15 스캘핑에 완벽, 외환/지수/암호화폐에도 적용 가능.
FX Trend MT5 NG
Daniel Stein
5 (4)
FX Trend NG: 차세대 멀티 마켓 트렌드 인텔리전스 개요 FX Trend NG 는 다중 시간 프레임 기반의 전문 트렌드 분석 및 시장 모니터링 도구입니다. 몇 초 만에 전체 시장 구조를 파악할 수 있도록 설계되었습니다. 여러 차트를 일일이 전환할 필요 없이, 어떤 종목이 추세에 있는지, 어디에서 모멘텀이 약화되고 있는지, 그리고 어떤 시간 프레임이 서로 정렬되어 있는지 즉시 확인할 수 있습니다. 출시 기념 특별 혜택 – FX Trend NG 를 $30 (6개월) 또는 $80 평생 라이선스 로 이용할 수 있습니다. 이미 Stein Investments 고객이신가요? -> 메시지를 보내 전용 고객 그룹에 참여하세요. 설정이나 사용 방법이 필요하신가요? -> Stein Investments 공식 페이지 를 방문하세요. 1. FX Trend NG가 특별한 이유 3단계 추세 로직 – 단순한 Buy / Sell이 아닙니다 • 대부분의 지표는 Buy 또는 Sell 두 가지 상태만 제
Power Candles MT5
Daniel Stein
5 (6)
Power Candles – 모든 시장을 위한 강도 기반 진입 신호 Power Candles 는 Stein Investments의 검증된 강도 분석을 가격 차트에 직접 제공합니다. 가격 움직임에만 반응하는 대신, 각 캔들은 실제 시장 강도를 기준으로 색상화되어 모멘텀 형성, 강도 가속, 명확한 추세 전환을 즉시 파악할 수 있습니다. 모든 시장을 위한 단일 로직 Power Candles는 모든 거래 심볼 에서 자동으로 작동합니다. 현재 심볼이 Forex인지 비-Forex 시장인지 자동으로 감지하여 내부적으로 적절한 강도 모델을 적용합니다. Forex 및 Gold 는 FX Power Delta 값을 사용합니다 (절대값 범위 최대 100) 지수, 크립토 및 CFD 는 IX Power Strength 값을 사용합니다 (절대값 범위 최대 50) 필요한 강도 계산은 Power Candles에 완전히 내장되어 있습니다. 캔들 색상이나 신호 로직을 위해 추가 인디케이터는 필요하지 않습니다. 가격
Meridian Pro
Ottaviano De Cicco
5 (1)
Meridian Pro: Professional Multi-Timeframe Trend Matrix for MT5 Overview Meridian Pro is a multi-timeframe trend matrix by Merkava Labs that compresses directional state, strength, momentum condition and matrix agreement into one compact panel. One adaptive engine, applied consistently from M1 to W1. No per-symbol tuning. No indicator stacking. One structured readout across every asset and every timeframe. Launch Offer — Get Meridian Pro for USD 99 (introductory). Regular price: USD 149. 1. Why
Trend Screener Pro MT5
STE S.S.COMPANY
4.84 (103)
트렌드 표시기, 트렌드 트레이딩 및 필터링을 위한 획기적인 고유 솔루션, 하나의 도구 안에 내장된 모든 중요한 트렌드 기능! Forex, 상품, 암호 화폐, 지수 및 주식과 같은 모든 기호/도구에 사용할 수 있는 100% 다시 칠하지 않는 다중 시간 프레임 및 다중 통화 표시기입니다. Trend Screener는 차트에 점이 있는 화살표 추세 신호를 제공하는 효율적인 지표 추세 추종 지표입니다. 추세 분석기 표시기에서 사용할 수 있는 기능: 1. 트렌드 스캐너. 2. 최대 이익 분석이 있는 추세선. 3. 추세 통화 강도 측정기. 4. 경고가 있는 추세 반전 점. 5. 경고가 있는 강력한 추세 점. 6. 추세 화살표 Trend Screener Indicator가 있는 일일 분석 예, 일일 신호 성능...등은 여기에서 찾을 수 있습니다. 여기를 클릭하십시오. LIMITED TIME OFFER : Trend Screener Indicator는 50$ 및 평생 동안만 사용할 수 있습니다.
HFT Spike Detector
OMG FZE LLC
5 (2)
[ My Products ] , [ My Channel ]   ,  [ LIVE SIGNAL ] HFT Spike Detector HFT Spike Detector는 HFT로 인해 발생하는 급격한 가격 변동을 실시간으로 분석하고 측정하기 위해 개발된 전문적인 틱 모니터링 도구입니다. 목적은 브로커로 인해 발생하는 비정상적인 슬리피지, 유동성 공백 및 밀리초 단위 가격 스파이크를 수치 데이터로 감지할 수 있도록 하는 것입니다. 실시간 틱 흐름과 체결 조건을 분석하기 때문에 백테스트로는 정확하게 평가할 수 없습니다. 이 EA는 자동화를 위해 준비된 세트 파일과 함께 사용할 수 있도록 구매할 수 있습니다:  VolumeHedger EA 작동 원리 이 Expert Advisor는 들어오는 모든 틱을 실시간으로 분석하고: 가격 변화 속도 초당 틱 밀도 슬리피지 크기 같은 방향의 마이크로 흐름 측정하여 차트의 패널에 표시합니다. 이를 통해 스프레드를 제외한 실제 실행 품질을 확인할 수
Atomic Analyst MT5
Issam Kassas
3.94 (31)
우선적으로 언급할 점은이 거래 지표가 다시 그리지 않고 지연되지 않으며 이를 통해 수동 및 로봇 거래 모두에 이상적이라는 점입니다. 사용자 매뉴얼: 설정, 입력 및 전략. Atomic Analyst는 가격의 강도와 모멘텀을 활용하여 시장에서 더 나은 이점을 찾는 PA Price Action Indicator입니다. 고급 필터를 장착하여 잡음과 거짓 신호를 제거하고 거래 잠재력을 높이는 데 도움이 됩니다. 복잡한 지표의 다중 레이어를 사용하여 Atomic Analyst는 차트를 스캔하고 복잡한 수학적 계산을 간단한 신호와 색상으로 변환하여 초보 트레이더가 이해하고 일관된 거래 결정을 내릴 수 있도록합니다. "Atomic Analyst"는 새로운 및 경험이 풍부한 트레이더를위한 종합적인 거래 솔루션입니다. 프리미엄 지표와 최고 수준의 기능을 하나의 거래 전략에 결합하여 모든 종류의 트레이더에 대한 다재다능한 선택지가되었습니다. 인트라데이 거래 및 스캘핑 전략 : 빠르고 정확한 일일
Meravith MT5
Ivan Stefanov
마켓 메이커를 위한 도구. Meravith는 다음과 같은 기능을 제공합니다: 모든 타임프레임을 분석하고 현재 유효한 추세를 표시합니다. 강세와 약세 거래량이 동일한 유동성 구간(거래량 균형 구간)을 강조 표시합니다. 서로 다른 타임프레임의 모든 유동성 레벨을 차트에 직접 표시합니다. 텍스트 기반 시장 분석을 생성하여 참고용으로 제공합니다. 현재 추세를 기반으로 목표가, 지지선 및 손절가를 계산합니다. 거래의 위험 대비 보상 비율(Risk/Reward)을 계산합니다. 계좌 잔고에 따라 포지션 크기를 산출하고 잠재 수익을 추정합니다. 시장에 중대한 변화가 발생할 경우 경고도 제공합니다. 지표의 주요 라인: 강세/약세 거래량 소진 라인 — 목표가로 사용됩니다. 시장 추세를 나타내는 라인. 시장이 강세인지 약세인지에 따라 색상이 변경되며 추세 지지선 역할을 합니다. 색상은 주로 시장 심리를 보여줍니다. 거래량 균형선(Eq). Eq(Volume Equilibrium) 라인은 시스템의 핵심입니
OmniSync Projection
Antonio-alin Teculescu
5 (1)
Chronos Fractal Engine is an innovative price projection indicator for MetaTrader 5, designed to transform your technical analysis by intelligently identifying and projecting historical price patterns. Built upon an advanced correlation algorithm and the fractal principles of the market, this powerful tool visualizes potential future price movements, giving you a unique edge in your trading decisions. What is Chronos Fractal Engine? At its core, the Chronos Fractal Engine employs a sophisticat
ARICoins
Temirlan Kdyrkhan
ARICoin is a powerful trading companion designed to generate high-probability entry signals with dynamic TP/SL/DP levels based on volatility. Built-in performance tracking shows win/loss stats, PP1/PP2 hits, and success rates all updated live. Key Features: Buy/Sell signals with adaptive volatility bands Real-time TP/SL/DP levels based on ATR Built-in MA Filter with optional ATR/StdDev volatility Performance stats panel (Success, Profit/Loss, PP1/PP2) Alerts via popup, sound, push, or email Cust
Quantum TrendPulse
Bogdan Ion Puscasu
5 (22)
SuperTrend   ,   RSI   ,   Stochastic   의 힘을 하나의 포괄적인 지표로 결합하여 트레이딩 잠재력을 극대화하는 궁극의 트레이딩 도구   인 Quantum TrendPulse를   소개합니다. 정밀성과 효율성을 추구하는 트레이더를 위해 설계된 이 지표는 시장 추세, 모멘텀 변화, 최적의 진입 및 종료 지점을 자신 있게 식별하는 데 도움이 됩니다. 주요 특징: SuperTrend 통합:   주요 시장 추세를 쉽게 따라가고 수익성의 물결을 타세요. RSI 정밀도:   매수 과다 및 매도 과다 수준을 감지하여 시장 반전 시점을 파악하는 데 적합하며 SuperTrend 필터로 사용 가능 확률적 정확도:   변동성이 큰 시장에서 숨겨진 기회를 찾기 위해 확률적 진동   을 활용하고 SuperTrend의 필터로 사용 다중 시간대 분석:   M5부터 H1 또는 H4까지 다양한 시간대에 걸쳐 시장을 최신 상태로 유지하세요. 맞춤형 알림:   맞춤형 거래 조건이 충족되면
Currency Strength Dashboard Pro
Anastasia Danilova
5 (1)
Currency Strength Dashboard Pro MetaTrader 5 를 위한 실시간 통화 강도 분석 전문 대시보드 입니다. 이 지표는 8개의 주요 통화 (EUR, USD, GBP, JPY, CHF, AUD, CAD, NZD)의 강도를 계산하고, 28개의 통화쌍 을 동시에 여러 시간 프레임에서 분석하여 표시합니다. 이 대시보드는 트레이더가 추가 계산이나 여러 차트 간 전환 없이 한눈에 시장 전체 상황을 파악 할 수 있도록 해줍니다. 계산 방법 이 지표는 고급 수학적 통화 강도 분석 방법 을 기반으로 합니다. 이는 유사한 지표에서 널리 사용되는 RSI 기반 방법 보다 더 정확하고 객관적인 결과를 제공합니다. 이 방법은 28개의 모든 통화쌍 간의 관계를 동시에 분석 하여 시장에서 실제로 형성되는 힘의 균형을 보다 명확하고 편향 없이 보여줍니다. 실시간 대시보드 메인 테이블에는 8개의 통화 에 대한 전체 데이터가 표시됩니다. Rank (순위) — 전체 강도 기준 통화 순위, 1
Grabber System MT5
Ihor Otkydach
4.83 (23)
탁월한 기술적 지표인 Grabber를 소개합니다. 이 도구는 즉시 사용 가능한 “올인원(All-Inclusive)” 트레이딩 전략으로 작동합니다. 하나의 코드 안에 강력한 시장 기술 분석 도구, 매매 신호(화살표), 알림 기능, 푸시 알림이 통합되어 있습니다. 이 인디케이터를 구매하신 모든 분들께는 다음의 항목이 무료로 제공됩니다: Grabber 유틸리티: 오픈 포지션을 자동으로 관리하는 도구 단계별 영상 매뉴얼: 설치, 설정, 그리고 실제 거래 방법을 안내 맞춤형 세트 파일: 인디케이터를 빠르게 자동 설정하여 최고의 성과를 낼 수 있도록 도와줍니다 다른 전략은 이제 잊어버리세요! Grabber만이 여러분을 새로운 트레이딩의 정점으로 이끌어 줄 수 있습니다. Grabber 전략의 주요 특징: 거래 시간 프레임: M5부터 H4까지 거래 가능한 자산: 어떤 자산이든 사용 가능하지만, 제가 직접 테스트한 종목들을 추천드립니다 (GBPUSD, GBPCAD, GBPCHF, AUDCAD, AU
소개       Quantum Breakout PRO   , 브레이크아웃 존 거래 방식을 변화시키는 획기적인 MQL5 지표! 13년 이상의 거래 경험을 가진 숙련된 트레이더 팀이 개발한       퀀텀 브레이크아웃 PRO       혁신적이고 역동적인 브레이크아웃 존 전략으로 거래 여정을 새로운 차원으로 끌어올리도록 설계되었습니다. Quantum Breakout Indicator는 5개의 이익 목표 영역이 있는 브레이크아웃 영역의 신호 화살표와 브레이크아웃 상자를 기반으로 한 손절 제안을 제공합니다. 초보자 거래자와 전문 거래자 모두에게 적합합니다. Quantum EA 채널:       여기를 클릭하세요 중요한! 구매 후 설치 매뉴얼을 받으려면 개인 메시지를 보내주십시오. 추천: 기간: M15 통화쌍: GBPJPY, EURJPY, USDJPY,NZDUSD, XAUUSD 계정 유형: 스프레드가 매우 낮은 ECN, Raw 또는 Razor 브로커 시간: GMT +3 중개인 :
FX Power MT5 NG
Daniel Stein
5 (31)
FX Power: 통화 강세 분석으로 더 스마트한 거래 결정을 개요 FX Power 는 어떤 시장 상황에서도 주요 통화와 금의 실제 강세를 이해하기 위한 필수 도구입니다. 강한 통화를 매수하고 약한 통화를 매도함으로써 FX Power 는 거래 결정을 단순화하고 높은 확률의 기회를 발견합니다. 트렌드를 따르거나 극단적인 델타 값을 사용해 반전을 예측하고자 한다면, 이 도구는 귀하의 거래 스타일에 완벽히 적응합니다. 단순히 거래하지 말고, FX Power 로 더 스마트하게 거래하세요. 1. FX Power가 거래자에게 매우 유용한 이유 통화와 금의 실시간 강세 분석 • FX Power 는 주요 통화와 금의 상대적 강세를 계산하고 표시하여 시장 역학에 대한 명확한 통찰력을 제공합니다. • 어떤 자산이 앞서고 있고 어떤 자산이 뒤처지는지 모니터링하여 보다 현명한 거래 결정을 내릴 수 있습니다. 포괄적인 멀티 타임프레임 뷰 • 단기, 중기 및 장기 타임프레임에서 통화와 금의 강세를
Bill Williams Advanced
Siarhei Vashchylka
5 (11)
Bill Williams Advanced is designed for automatic chart analysis using Bill Williams' "Profitunity" system. The indicator analyzes four timeframes at once. Manual (Be sure to read before purchasing) Advantages 1. Analyzes the chart using Bill Williams' "Profitunity" system. Signals are displayed in a table in the corner of the screen and on the price chart. 2. Finds all known AO and AC signals, as well as zone signals. Equipped with a trend filter based on the Alligator. 3. Finds "Divergence Bar
Advanced Supply Demand MT5
Bernhard Schweigert
4.53 (15)
현재 33% 할인! 초보자나 전문 트레이더를 위한 최고의 솔루션! 이 보조지표는 우리가 다수의 독창적 기능과 새로운 공식을 통합한 독특하고 고품질이며 저렴한 거래 도구입니다. 이 업데이트를 통해 이중 시간대를 표시할 수 있습니다. 더 높은 TF를 표시할 수 있을 뿐만 아니라 차트 TF와 더 높은 TF 모두를 표시할 수 있습니다: 중첩 영역 표시. 모든 Supply Demand 트레이더들이 좋아할 것입니다. :) 중요한 정보 공개 Advanced Supply Demand의 잠재력을 극대화하려면 다음을 방문하십시오. https://www.mql5.com/ko/blogs/post/720245   진입 또는 목표의 명확한 트리거 포인트를 정확히 찾아냄으로 해서 거래가 어떻게 개선될지 상상해 보십시오. 새로운 알고리즘을 기반으로 매수자와 매도자 간의 잠재적인 불균형을 훨씬 더 쉽게 분간할 수 있습니다. 왜냐하면 가장 강한 공급영역과 가장 강한 수요 영역과 과거에 어떻게 진행 되었는지를(이전
RFI levels PRO MT5
Roman Podpora
3.67 (3)
이 지표는 추세 반전 지점과 가격 반등 영역을 정확하게 보여줍니다.       주요 투자자들   . 새로운 트렌드가 형성되는 곳을 파악하고 최대한 정확하게 의사결정을 내리며 모든 거래를 완벽하게 통제합니다. TREND LINES PRO   지표와 함께 사용할 때 최대의 잠재력을 발휘합니다.  VERSION MT4 지표가 보여주는 내용: 새로운 추세의 시작 시 활성화되는 반전 구조 및 반전 수준. 최소한의 위험 대비 수익률을 갖는 이익 실현   (TAKE PROFIT)   및   손절매(STOP LOSS)   레벨 표시       RR 1:2   . 지능형 손실 감소 로직이 적용된 손절매 기능. 지정된 지표에서 두 가지 추세 유형에 대한 반전 패턴을 표시합니다. 지표: 트렌드를 따라   트렌드 라인 프로   (글로벌 트렌드 변화) 트렌드 프로   (빠른 트렌드 변화) 간단하고 효과적입니다       스캐너       실시간 추세 (신규). 다중 시간 프레임 도구 필터링. 표시하다  
Market Structure Order Block Dashboard MT5 는 MetaTrader 5용 MT5 인디케이터 로, 시장 구조 및 ICT / Smart Money Concepts에 기반합니다: HH/HL/LH/LL , BOS , ChoCH 뿐 아니라 Order Blocks , Fair Value Gaps (FVG) , 유동성 (EQH/EQL, sweeps), 세션 / Kill Zones , 그리고 Volume Profile 을 통합하여 콤팩트한 컨플루언스 대시보드를 제공합니다. 중요: 본 제품은 분석 도구 입니다. 자동 매매를 실행하지 않습니다( EA가 아님 ). 구매자 보너스 구매 후 제 스토어에서 보너스 인디케이터 2개 를 (선택하여) 무료로 받을 수 있습니다. 보너스 수령 방법: 1) 본 제품에 대한 솔직한 리뷰를 남겨주세요. 2) MQL5 메시지로 BONUS MSOB + 선택한 인디케이터 2개 이름 을 보내주세요. 주요 기능 시장 구조: HH/HL/LH/LL
Market Structure Patterns
Samuel Manoel De Souza
4.47 (19)
Available for   MT4   and   MT5 . Join the Market Structure Patterns channel to download materials available for study and/or additional informations. Related posts: Market Structure Patterns - Introduction Beyond Fancy Order Blocks: Using True Volumetric Analysis with Market Structure Patterns & Timeless Charts Market Structure Patterns   is an indicator based on   smart money concepts   that displays   SMC/ICT   elements that can take your trading decisions to the next level. Take advantage
Crystal Heikin Ashi Signals
Muhammad Jawad Shabir
5 (1)
Crystal Heikin Ashi Signals - Professional Trend & Signal Detection Indicator Advanced Heikin Ashi Visualization with Intelligent Signal System for Manual & Automated Trading Final Price: $149 ---------> Price goes up $10 after every 10 sales . Limited slots available — act fast . Overview Crystal Heikin Ashi Signals is a professional-grade MetaTrader 5 indicator that combines pure Heikin Ashi candle visualization with an advanced momentum-shift detection system. Designed for both manual traders
Power Bar MT5
Daniel Stein
실제 자금을 투입하기 전에 어떤 전략이 내 심볼에서 효과적인지 확인하세요. Power Bar는 모든 심볼과 모든 타임프레임에서 극단적인 가격 바 를 감지한 다음, 3가지 다른 트레이딩 전략을 즉시 백테스트하여 승률, 수익 팩터, 손익을 나란히 비교할 수 있습니다. 모든 것이 하나의 인터랙티브 패널에 담겨 있습니다. 추측 없음. 커브 피팅 없음. 오직 데이터뿐입니다. Power Bar가 특별한 이유 대부분의 인디케이터는 신호를 주고 그것이 효과가 있는지는 추측에 맡깁니다. Power Bar는 한 걸음 더 나아갑니다 - 모든 신호를 세 가지 전략 에 대해 테스트하고 통계를 보여줍니다. FlipFlop, Momentum, Reversal을 원클릭으로 전환하고 숫자가 즉시 변하는 것을 확인하세요. FlipFlop - 항상 포지션 유지. 신호에 진입하고, 반대 신호에 청산. 당사의 연구에 따르면 US30, US500, DAX와 같은 추세가 있는 지수에서 가장 효과적입니다. Momentum
Smart Stop Indicator – 차트 위에서 직접 작동하는 지능형 스톱로스 시스템 개요 Smart Stop Indicator는 감이나 추측이 아닌 명확하고 체계적인 방식으로 스톱로스를 설정하고 싶은 트레이더를 위한 맞춤형 솔루션입니다. 이 도구는 클래식 프라이스 액션 논리(고점, 저점 구조)와 현대적인 브레이크아웃 인식을 결합하여 실제로 가장 논리적인 다음 스톱 레벨을 정확히 식별합니다. 추세, 박스권, 빠른 브레이크아웃 상황 등 어떤 시장에서도 인디케이터는 최적의 SL 구역과 상태(“new”, “broken”, “valid”)를 차트에 직접 표시합니다. 새로운 기능으로 SL 거리의 %ADR 표시가 추가되었습니다. 핵심 기능 자동 시장구조 기반 스톱 설정 • 시장 구조와 실시간 가격 움직임을 기반으로 의미 있는 스톱로스 레벨을 자동으로 탐지합니다. 스마트 브레이크아웃 감지 • 빠른 방향 변화나 돌파 상황에서도 불필요한 조기 스톱 조정을 강요하지 않으며 유연하게 반응합
제작자의 제품 더 보기
Pand0ra EA
Yury Emeliyanov
This expert Advisor is primarily intended for dispersing small deposits. For example, in testing since 2017, the EA increased its balance from 100 $   to 6 514 361 $ The "Pand0ra EA" expert Advisor is perfect for the "EUR/GBP M30" pair. It uses only two indicators "Previous High Low" and "Top Bottom Price". Each trade is protected by a Stop Loss and Take Profit. In the parameters of the expert Advisor, you can change the percentage of the lot from the Deposit(by default, it is 5%) also, the va
Pin Bars
Yury Emeliyanov
5 (4)
주요 목적:"핀 바"는 금융 시장 차트에서 핀 바를 자동으로 감지하도록 설계되었습니다. 핀 바는 특징적인 몸체와 긴 꼬리를 가진 촛불로,추세 반전 또는 교정을 신호 할 수 있습니다. 작동 원리:표시기는 차트의 각 촛불을 분석하여 촛불의 몸,꼬리 및 코의 크기를 결정합니다. 미리 정의 된 매개 변수에 해당하는 핀 막대가 감지되면 표시기는 핀 막대의 방향(강세 또는 약세)에 따라 위 또는 아래 화살표로 차트에 표시합니다. 매개 변수: 꼬리의 길이와 핀 바의 몸체 크기 사이의 최소 비율을 정의합니다. "코"와 핀 바의 꼬리 사이의 최대 허용 비율을 설정합니다. 화살표 크기-표시된 핀 막대와 차트에서 핀 막대를 가리키는 화살표 사이의 거리를 정의합니다. 신청:"핀 바"표시기는 잠재적 인 추세 반전 지점을 식별하고 시장 또는 가까운 위치에 진입하기 위해 신호를 생성하는 데 사용할 수 있습니다. 올바르게 사용하고 다른 기술 지표 및 분석 방법과 결합하면이 지표는 거래 결과를 향상시킬 수
FREE
PPR and Engulfing
Yury Emeliyanov
5 (2)
PPR 및 Engulfing 은 MetaTrader 4 (MT4) 거래 플랫폼의 통화 차트에서 "PPR" 및 "Engulfing" 패턴을 식별하도록 설계된 독특한 기술 지표입니다. 이러한 패턴은 잠재적인 추세 반전 또는 지속을 나타낼 수 있으며, 트레이더에게 시장 진입 및 퇴출을 위한 귀중한 신호를 제공합니다. 주요 특징: 자동 패턴 감지 : 지표는 PPR 및 Engulfing 패턴을 자동으로 식별하고 차트에 화살표로 표시합니다. 시각적 신호 : 녹색 위쪽 화살표는 매수 지점을 나타내고, 빨간색 아래쪽 화살표는 매도 지점을 나타냅니다. 사용자 정의 가능한 화살표 색상 : 사용자는 지표 설정을 통해 강세 및 약세 신호의 화살표 색상을 선택할 수 있습니다. 모드 선택 : 세 가지 작동 모드 – PPR만, Engulfing만, 또는 두 패턴을 동시에 분석합니다. 사용 방법: 차트에 추가 : 지표를 원하는 통화 쌍 또는 금융 상품의 차트에 적용합니다. 신호 분석 : 차트에서 화살표의 출현을
FREE
Ppr PA
Yury Emeliyanov
4.5 (2)
"Ppr PA" is a unique technical indicator created to identify "PPR" patterns on the currency charts of the MT4 trading platform. These patterns can indicate possible reversals or continuation of the trend, providing traders with valuable signals to enter the market. Features: Automatic PPR Detection:   The indicator automatically identifies and marks PPR patterns with arrows on the chart. Visual Signals:   Green and red arrows indicate the optimal points for buying and selling, respectively. Ar
FREE
C3PO for GbpUsd
Yury Emeliyanov
5 (1)
The EA is designed primarily for the GBP / USD pair with the M15 timeframe , but it can also be used on other major pairs with preliminary testing using minimal risks. You can change the lot size in the adviser parameters. The EA is based on several indicators: Percent BB, Steady Bands, and Donchian Channel. The expert Advisor opens a buy transaction at the opening of a new day if all the conditions of the above Indicators are met. Below are screenshots of testing since 2018. Initial balance
"Fakey PA" is a technical indicator for the MetaTrader 5 platform, designed to automatically identify the Fakey pattern (false breakout) on the chart. The Fakey pattern is a combination of an Inside Bar followed by a false breakout, which often precedes a strong price movement in the opposite direction. What is the Fakey Pattern: Fakey is a three-bar false breakout formation: 1. Mother Bar - a wide bar that contains the next bar 2. Inside Bar - a bar completely within the range of the mother ba
FREE
Pin Bars MT5
Yury Emeliyanov
Main purpose:   "Pin Bars"   is designed to automatically detect pin bars on financial market charts. A pin bar is a candle with a characteristic body and a long tail, which can signal a trend reversal or correction. How it works:   The indicator analyzes each candle on the chart, determining the size of the body, tail and nose of the candle. When a pin bar corresponding to predefined parameters is detected, the indicator marks it on the chart with an up or down arrow, depending on the directi
FREE
Inside Bar PA MT5
Yury Emeliyanov
"Inside Bar PA" is a technical indicator for the MetaTrader 5 platform, designed to automatically detect the Inside Bar pattern on the chart. An Inside Bar is a candle whose high and low are completely within the range of the previous candle (mother bar). This pattern often signals market consolidation and can precede a strong price movement. Features: • Automatic detection of all Inside Bars on the chart • Visual marking with arrows: green up arrow for bullish Inside Bars (close >= open), gr
FREE
Fakey Detector
Yury Emeliyanov
Fakey Detector — False Breakout (Fakey) Indicator Fakey Detector is an indicator that automatically detects the classic Fakey pattern (false breakout of an inside bar) from Price Action and displays it on the chart using an arrow and breakout level. How it works: The Fakey pattern consists of three candles: Mother Bar — the largest by range Inside Bar — fully contained within the Mother Bar's range Fakey Candle — breaks out (up or down), but then closes back inside the range The indicator
FREE
Three Bar Reversal
Yury Emeliyanov
3 (2)
Three Bar Reversal (MT4) — free indicator Three Bar Reversal is a simple and effective MetaTrader 4 indicator that detects the classic three-bar reversal candlestick pattern with additional filtering based on ATR and candle body sizes. Arrows are displayed on the last closed candle of the pattern, and push notifications are also sent. An automated trading robot Three Bar Reversal EA has been developed based on this indicator. The indicator works on all currency pairs and timeframes but pe
FREE
Railway Tracks Pattern — Reversal Pattern Indicator Railway Tracks Pattern is an indicator that automatically detects a powerful two-candle reversal pattern on the chart. It looks for two candles with opposite directions (bullish and bearish), similar in size, and with minimal wicks — a clear sign of momentum shift. How it works: The first candle is strong and directional. The second candle moves in the opposite direction and is of similar size. Both candles have small shadows (wicks). The
FREE
Inside Bar PA
Yury Emeliyanov
"Inside Bar PA" is a technical indicator designed to determine the inner bars on the chart. An internal bar is a bar or candle, the maximum and minimum of which are completely contained in the previous bar. This may signal a potential reversal or continuation of the trend, depending on the context. Features: Automatic detection of internal bars. Visual marking of internal bars with arrows on the chart. The ability to adjust the distance of the mark from the bar. How to use: Attach the indicato
FREE
R2d2
Yury Emeliyanov
R2d2 The R2D2 expert Advisor trades based on the Percent BB and Steady Bands indicator. Currency pairs: EURUSD , Timeframe: M15 .(Recommended) GBPUSD, USD/CHF, USD / CAD, EUR/JPY, EUR / GBP, EUR/CHF, AUD/USD, NZD/USD Timeframe M15 (in some cases M30) Test from 14.04.2018 to 14.04.2020 from $ 100 to $ 90,000. See the screenshot below. Opening (input Signal) The R2D2 expert Advisor opens a new long or short position at the beginning of the day, when all the logical conditions of the Percent B
Eur Gbp M15
Yury Emeliyanov
The EA is designed primarily for the EUR/GBP pair M15 timeframe, but it can also be used on other major pairs with preliminary testing using minimal risks. In the adviser parameters, you can change the % of risk per trade. The EA is based on several indicators: Percent BB, Steady Bands, and Ross hook. The expert Advisor opens a buy transaction at the opening of a new day if all the conditions of the above Indicators are met. Below are screenshots of testing for the last  3 years. Initial balan
Imba
Yury Emeliyanov
"IMBA"  is a trading robot for the trading on forex. The EA analyzes the market using several indicators (Persistent BB, Steady Bands). Opens and closes trades on indicators, but sometimes on Stop Loss or Take Profit. It doesn't open many deals, but it compensates for this with the quality of the deals. There is no point in telling too much, just download the Demo version and test it. Others Product:  https://www.mql5.com/ru/users/yura1994ru/seller#products Recommendations: Symbol EURUSD Time
EMYR Stochastics
Yury Emeliyanov
5 (1)
The main advantage of the EA is the percentage of profitable trades that is 99% in testing over the past 2 years. He does not make many transactions, please note this. Designed primarily for the EUR/USD M30 pair . The EA Uses several indicators the main one of which is "Stochastics" Default testing parameters Initial balance = $10,000 Net profit = $27,300 Profitable trades = 99% Drawdown = 38% Other product:   https://www.mql5.com/ru/users/yura1994ru/seller#products Before using it on a real acc
Naboo
Yury Emeliyanov
By default, the expert Advisor parameters allow trading on the GBP/USD M30 pair . Using three indicators (ATR MA Oscillator, Stochastic, Top Bottom Price) to open and close trades, but also uses Stop Loss and Take Profit. Below is a test for the last 6 years. The default lot size is 1 lot and is recommended for a Deposit of 10 000. For a smaller Deposit, it is recommended to reduce the lot size. For 1000 = 0.1 lot, for 100 = 0.01 lot. Other product:   https://www.mql5.com/ru/users/yura1994ru/sel
Mjolnir
Yury Emeliyanov
The "Mjolnir" Expert Advisor is perfect for most Currency Pairs and Timeframes from M15 to H4, but it performs best on the "EUR/GBP M30" pair.   It uses only two indicators "Bollinger Bands" and "Top Bottom Price". Each trade is protected by Stop Loss and Take Profit. In the parameters of the expert Advisor, you can change the percentage of the lot from the Deposit(by default, it is 5%), as well as the values of indicators, Stop Loss and Take Profit, if necessary.  The test statistics for 4 year
Royal Pro
Yury Emeliyanov
By default, the EA parameters allow trading on the   EUR/JPY M30 pair.   For the test from 2017.01.07 - 2021.01.07   from 100   $   to 1 957 164   $   see below. The EA uses three indicators (ATR MA Oscillator,   Donchian Channel , Top Bottom Price) to open and close trades, but also uses Stop Loss and Take Profit. The lot size is specified as a percentage of the account balance (by default, 5% and a limit of 100 lots is specified). Default testing parameters Initial balance = 100  $ Net profit
Ord Mantell
Yury Emeliyanov
5 (1)
Suitable currency pairs:   EUR/JPY H1   (there will be sets with settings for other currency pairs in the discussions) Indicators used:   "ATR MA Oscillator", "Entry Time", "Top Bottom Price" and "Previous High Low" Default lot size =   5% Other Products:  https://www.mql5.com/ru/users/yura1994ru/seller#products Test results since 2017 for the EUR/JPY H1 pair Initial balance = 500  $ Net profit = 2,372,808  $ Profitability = 4.07 Profitable trades = 84% Drawdown = 7% Recommendation: use an ac
Barracuda EA
Yury Emeliyanov
4 (1)
The main advantage of the Expert Advisor is the percentage of profitable trades, which is 70% in testing over the past 5 years. The EA is primarily designed for the EUR/GBP M15 pair, but it can also be used on other currency pairs if the EA is pre-optimized. The EA uses several indicators, the main one of which is the "Donchian Channel". Look at the test results over the past 5 years. Default testing parameters Initial balance = 500 $ Net profit = 8,431 $ Profitable trades = 70% Drawdown = 17%
Temeria
Yury Emeliyanov
"Temeria" -   Forex Expert Advisor for dispersal of small deposits Statistics after testing in MT4 (EURGBP M30, 2018 - 2023) Initial balance: $10,000 Net profit: $240,900 Maximum drawdown: 2.11% Profitability: 3.74 Description: The Temeria Expert Advisor is designed specifically for the rapid acceleration of small deposits, providing a high level of profit. It is based on several indicators that ensure effective trading. The results of testing over the past five years indicate its stable perfo
Sakaar
Yury Emeliyanov
Sakaar Expert Advisor for XAUUSD (M30) Sakaar is an automated trading system specifically designed for trading gold (XAUUSD) on the M30 timeframe. The advisor’s algorithm is based on a combination of three technical indicators: Top Bottom Price ATR MA Oscillator Previous High Low The EA uses a reliable risk management system: every trade includes a stop loss and take profit, and position sizing is based on a percentage lot model , allowing the system to adapt to the current balance and scale tra
Stellaris
Yury Emeliyanov
특별 제안: 첫 10명의 구매자에게는 특별 할인가가 적용되며, 이후 가격이 인상됩니다. 이 기회에 신뢰할 수 있는 어드바이저를 할인된 가격에 구매할 수 있는 좋은 기회입니다. Stellaris 어드바이저는 지난 10년간 테스트에서 70%의 높은 수익률을 보여줍니다. EUR/GBP 통화쌍의 M30 타임프레임에 맞춰 설계되었지만, 매개변수 최적화를 통해 다른 통화쌍에도 적용할 수 있습니다. 이 어드바이저는 Steady Bands 와 Donchian Channel 과 같은 강력한 지표를 기반으로 하여 정확한 진입 및 청산 신호를 제공합니다. 10년간 테스트 결과는 높은 성능을 보여줍니다: 초기 자본 : 100$ 순이익 : 3,013,278$ 수익 거래 비율 : 70% 최대 손실 : 9% 실제 계좌에 적용하기 전에 최소한의 리스크로 테스트를 진행해 브로커와의 호환성을 확인하는 것이 좋습니다. 다른 제품 및 테스트 결과는 여기에서 확인할 수 있습니다: [제품 링크] .
C3PO v2
Yury Emeliyanov
이 어드바이저는 EUR/GBP 통화쌍을 M30 타임프레임에서 거래하도록 설계되었지만, 최소 리스크로 초기 테스트를 거친 후 다른 주요 통화쌍에서도 사용할 수 있습니다. 어드바이저 설정에는 로트 크기를 조정할 수 있는 옵션이 포함되어 있어 사용자의 선호도에 맞게 커스터마이징할 수 있습니다. 주요 특징: Steady Bands 및 Bollinger Bands 지표를 기반으로 작동하며, 다른 거래 시스템 요소와 결합됩니다. 모든 지표 기준이 충족되고 추가적인 거래 전략 조건이 충족될 때만 거래가 열립니다. 테스트 결과 (2020년 – 현재): 초기 예치금: $100 순이익: $624,880 최대 낙폭: 9% (거래당 위험 5%; 설정에서 위험을 줄일 수 있습니다). 승률: 75% 추천 사항: 효율성을 높이기 위해 낮고 고정된 스프레드를 가진 계좌를 사용하세요. 실계좌에서 사용하기 전에, 데모 계좌에서 최소 리스크로 어드바이저를 테스트하여 안정성과 올바른 설정을 확인하세요. 이 어드바이저는
Roobi
Yury Emeliyanov
특별 제안: 최초 10명의 구매자에게는 특별 할인가가 적용되며, 이후 가격이 인상됩니다. 이 기회를 통해 할인된 가격으로 EA를 구매하세요. Roobi EA 는 지난 5년간 의 테스트에서 73% 의 높은 승률을 기록했습니다. EUR/GBP M30 통화쌍에 최적화되어 있지만, 매개변수 최적화를 통해 다른 통화쌍에도 적용할 수 있습니다. 주요 지표로 Steady Bands 와 Moving Average 를 사용하여 정확한 매매 진입 및 종료 신호를 제공합니다. 2020년 이후 테스트 결과는 높은 효율성을 보여줍니다: 초기 자금: $200 순이익: $1,022,383 승률: 73% 실거래 계좌에 적용하기 전에 최소한의 위험으로 테스트하여 귀하의 브로커에서 올바르게 작동하는지 확인하는 것이 좋습니다. 다른 제품 및 테스트 결과는 여기에서 확인할 수 있습니다: [제품 링크]
Pinok
Yury Emeliyanov
Pinok 은 EURGBP (M30)용 거래 어드바이저로, 이전 바의 극단 가격 돌파와 ATR MA 오실레이터 필터링을 기반으로 합니다. 고정된 손절매와 이익실현 설정으로 지정된 거래 시간 내에서 작동합니다. 로직 매수 진입: 시가가 이전 바의 최저가보다 낮고 ATR MA 오실레이터가 0 이하일 때. 매도 진입: 시가가 이전 바의 최고가보다 높고 ATR MA 오실레이터가 0 이하일 때. 청산: 고정 이익실현(+90포인트) 또는 손절매(-400포인트). 거래: 거래량 — 예치금의 2%. 테스트 통계 (2018–2025) 초기 예치금: 500달러 총 수익: +6279달러 수익 계수: 2.36 최대 손실: 30.52% 총 거래 수: 256건 승리 거래 비율: 74% ️ 중요: 실제 계좌에서 사용하기 전에 반드시 데모 계좌 또는 전략 테스터에서 테스트하세요. 과거 결과는 미래 수익을 보장하지 않습니다. 다른 제품 및 테스트 결과는 여기에서 확인할 수 있습니다: [제품 링크]
KazePro
Yury Emeliyanov
KazePro — Japanese Precision in Forex Trading KazePro is a modern Expert Advisor designed for stable growth of small deposits with controlled risk. It combines speed, accuracy, and disciplined money management — bringing the spirit of Japanese precision into Forex trading. The algorithm focuses on clean entry points and time-based logic, opening trades only when the market shows strong reversal or impulse potential. Key Features Works best on pairs with the Japanese Yen ( JPY ) Optimized f
Three Bar Reversal Expert Advisor An automated trading robot based on the classic Three Bar Reversal pattern. Optimized for the D1 timeframe , where signals are more stable and statistically reliable. ️ Features: Strategy based on a 3-bar reversal pattern with impulse strength filtering Customizable risk/reward ratio ( RiskRewardRatio ) Limit on the number of simultaneous trades ( MaxOrders ) Suitable for all instruments with strong volatility Backtest Results (EURUSD, D1, 2010–2025): N
Railway Tracks EA — Automated Trading Based on the "Railway Tracks" Pattern Railway Tracks EA is an expert advisor that trades a powerful candlestick reversal pattern known as “Railway Tracks.” It automatically detects signals from two strong opposite-direction candles and places trades with a customizable risk/reward ratio. Trading Logic: BUY : after a bearish candle followed by a bullish one. SELL : after a bullish candle followed by a bearish one. SL : placed beyond the extreme of the
필터:
리뷰 없음
리뷰 답변