Autowolfe
- 지표
-
Vladimir Chamin
 Здравствуйте!
Представлюсь — Владимир Чамин, алгоритмический трейдер, финансовый коуч, организатор онлайн-конференции «Взлом трейдинга», музыкант.
Моя миссия — помочь успешным предпринимателям создать новый инвестиционный бизнес на основе торговых роботов и управлять им из любой точки мира. - 버전: 13.58
- 활성화: 20
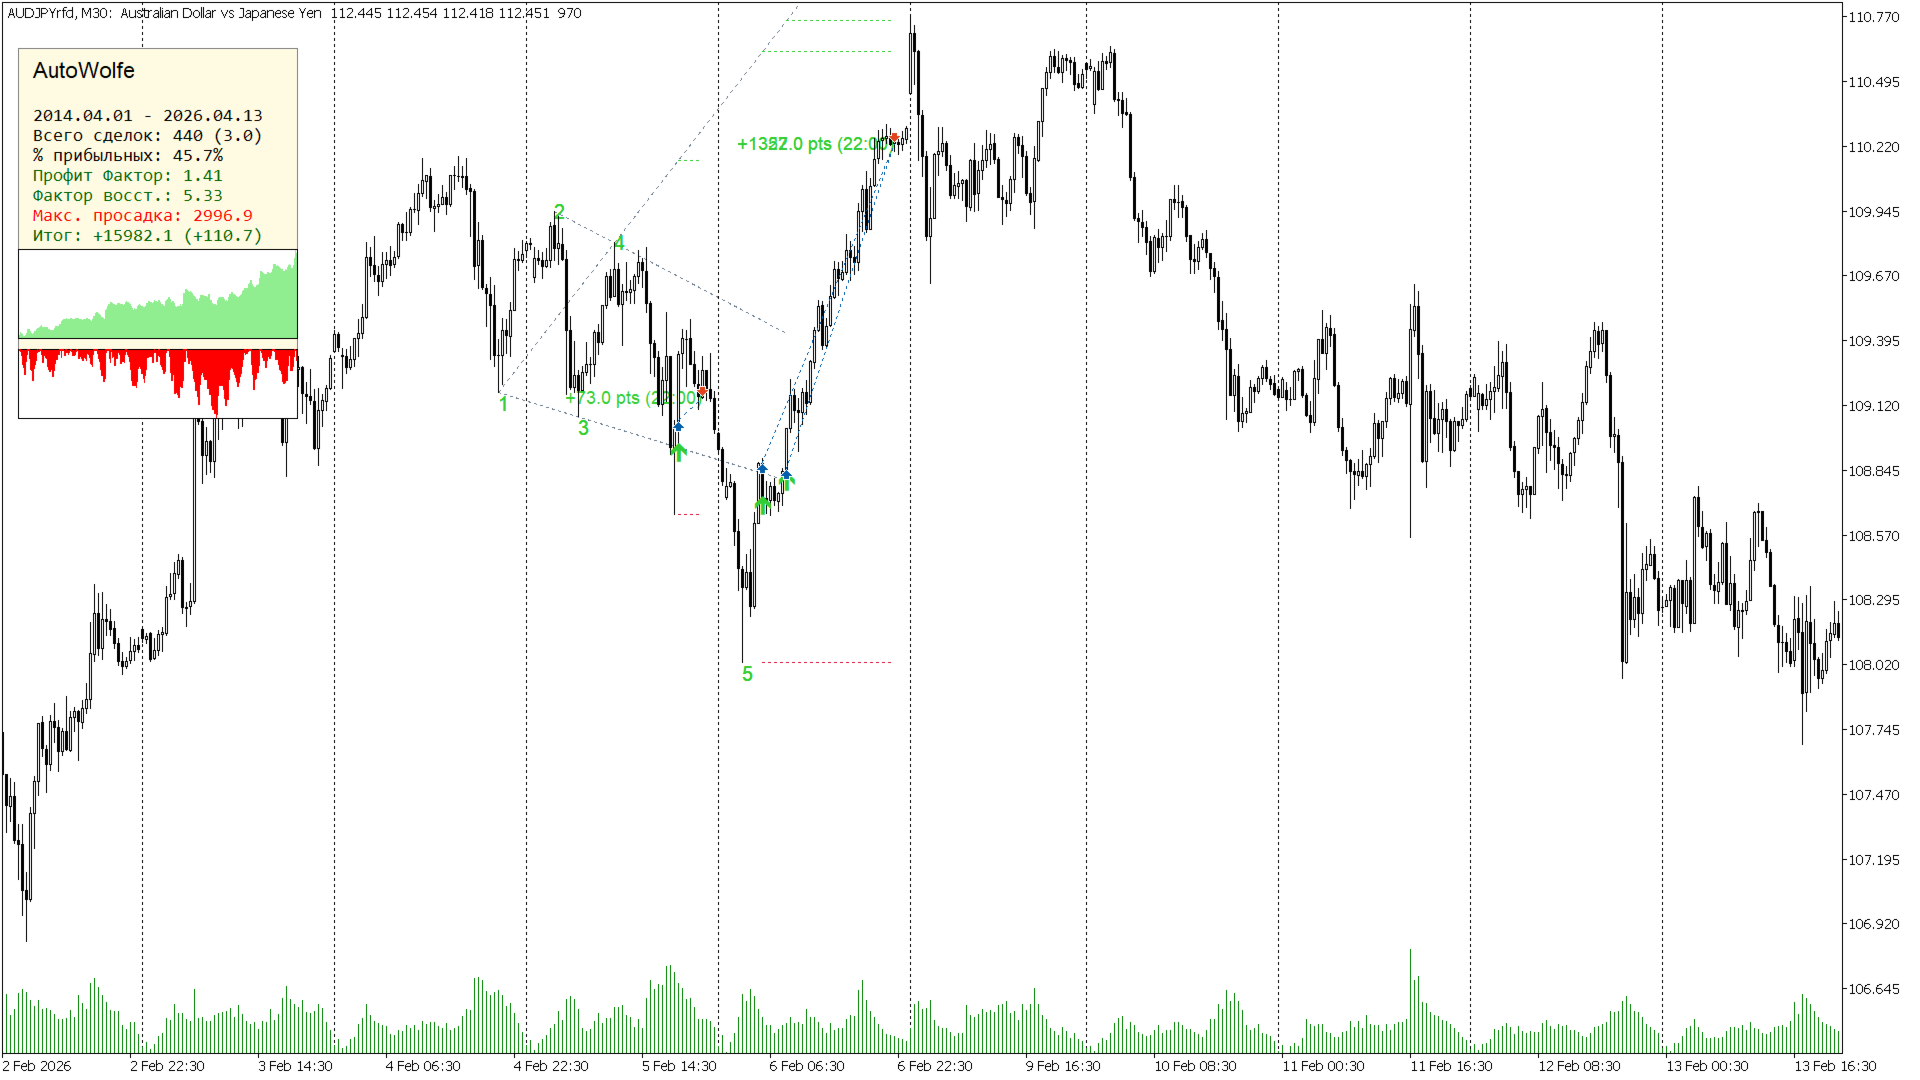
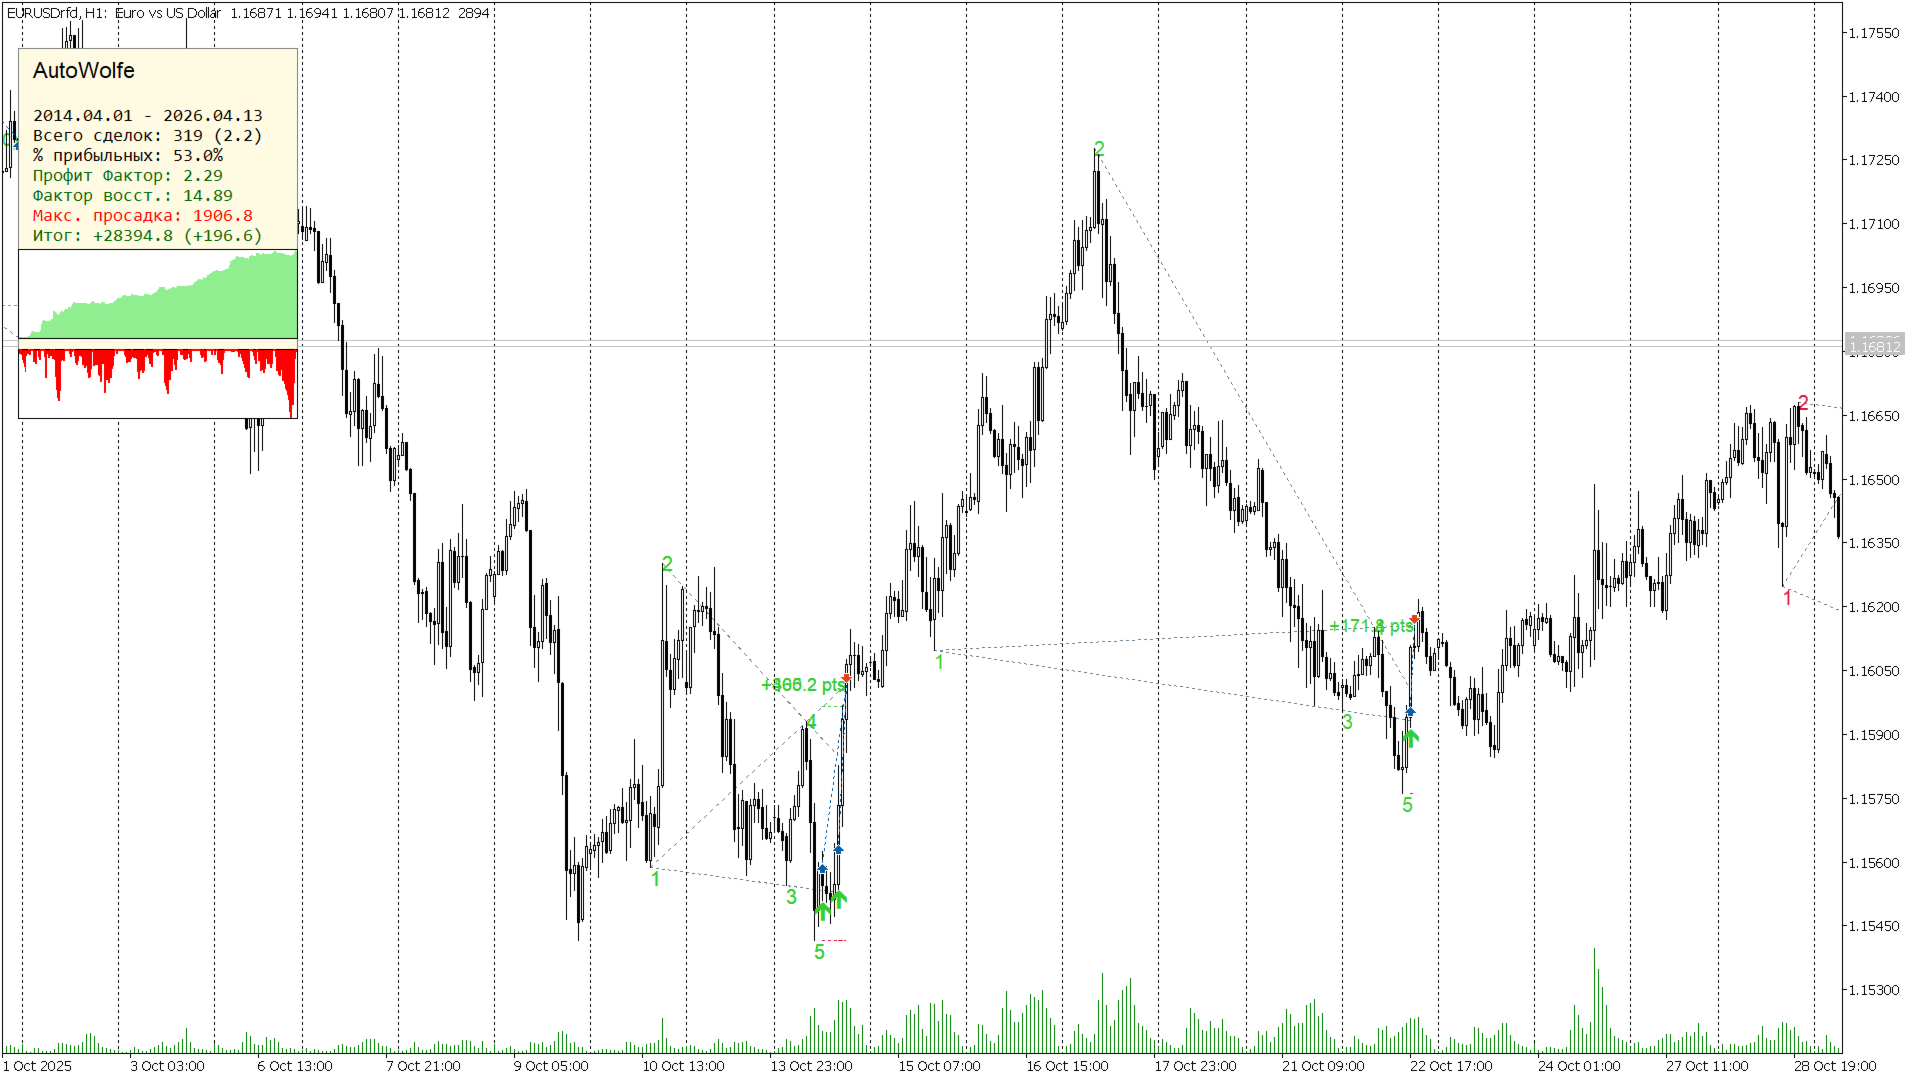
단순한 화살표 지표와 달리, 이 도구는 적절한 자금 관리(Money Management)를 통합하여 실제 거래의 수학적 시뮬레이션을 수행합니다. 초기 예치금과 거래당 위험(%)을 설정하면 내장 엔진이 복리(재투자)를 고려하여 자본(Equity)의 변동을 계산합니다.
지표가 제공하는 주요 기능:
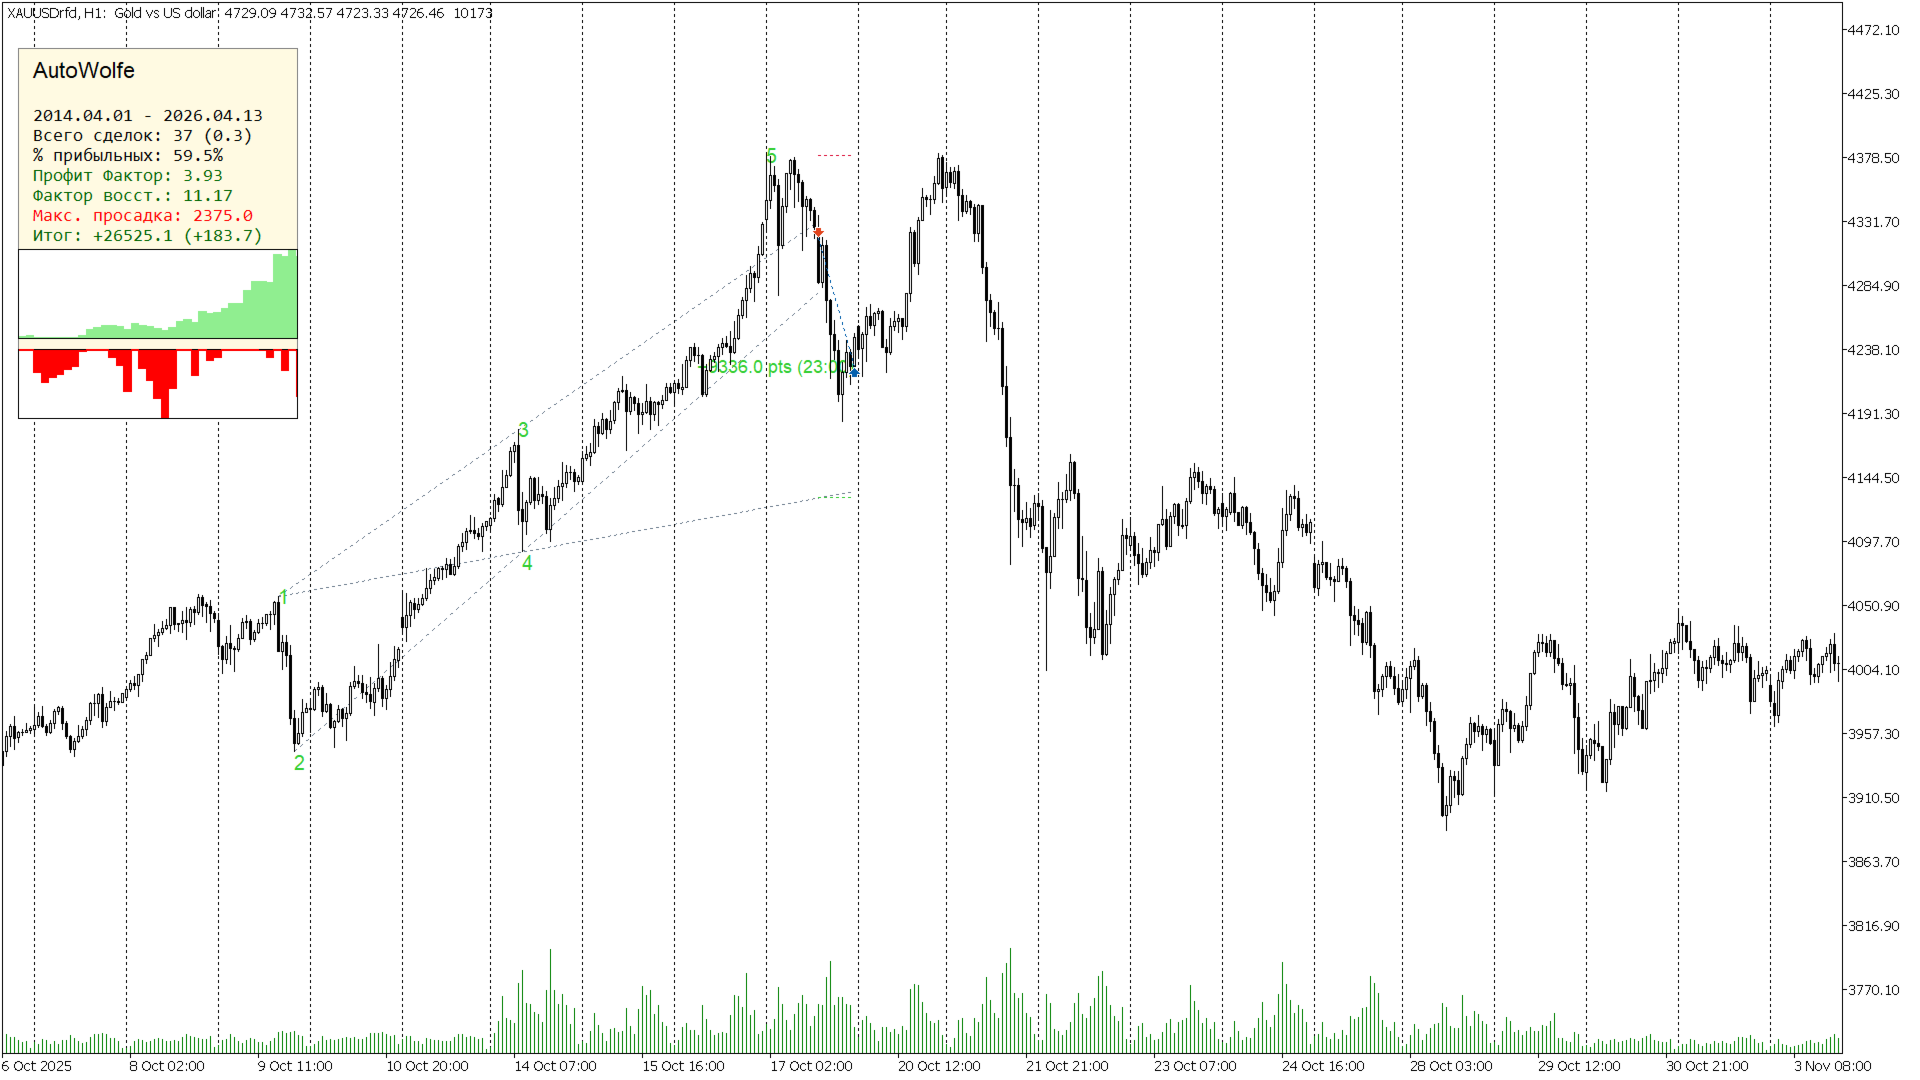
• 스마트 검색 및 거래 관리: 3가지 진입 모드(클래식 단일 진입 또는 1-3 라인 터치 시 공격적인 다중 진입). 청산은 계산된 1-4 라인(EPA 목표), 동적 트레일링 스탑 또는 시간 제한(시간 필터 / 최대 유지 봉 수)을 기반으로 실행됩니다.
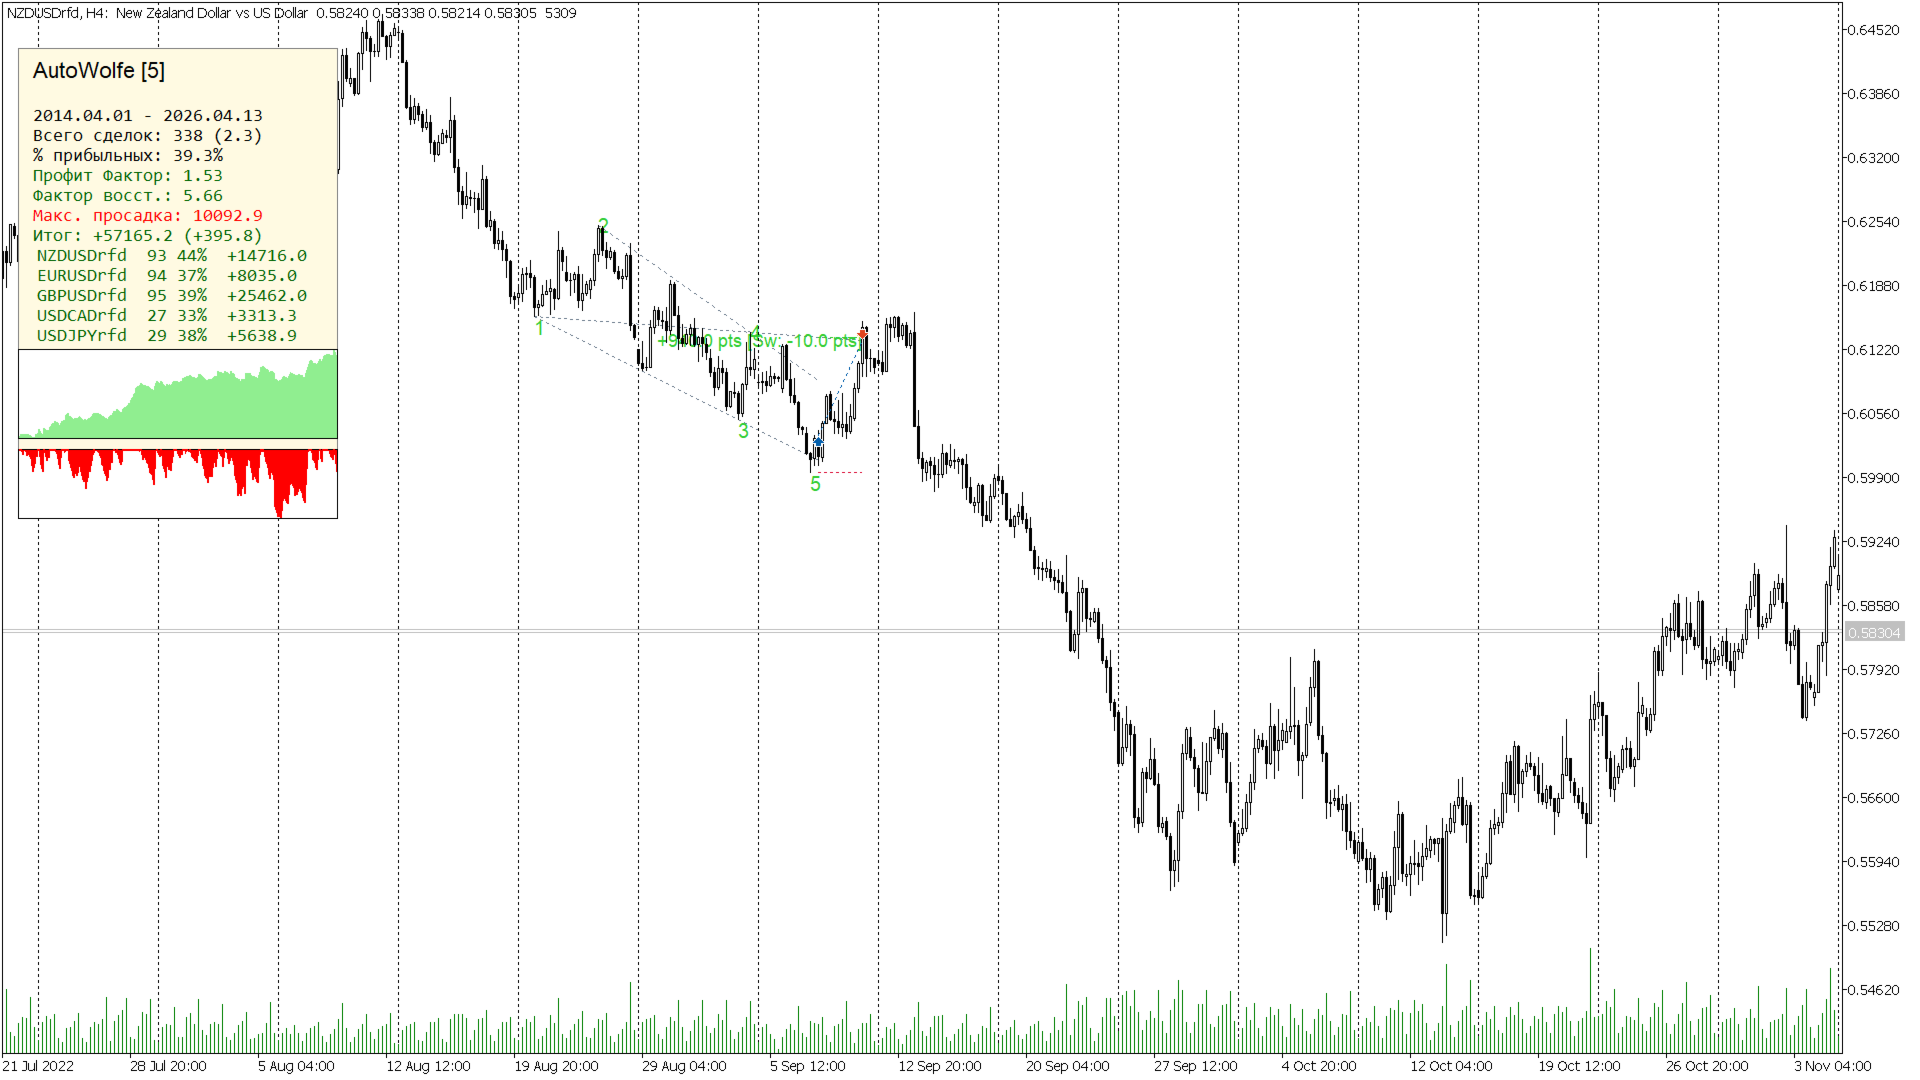
• 고급 분석: 내장된 대시보드는 승률(Win Rate), 수익 계수(Profit Factor), 연평균 성장률( CAGR) 및 최대 낙폭(Max Drawdown)을 퍼센트(%)와 포인트(Points) 로 동시에 즉시 표시합니다. 자본 성장 및 드로다운에 대한 시각적 히스토그램이 차트에 직접 그려집니다.
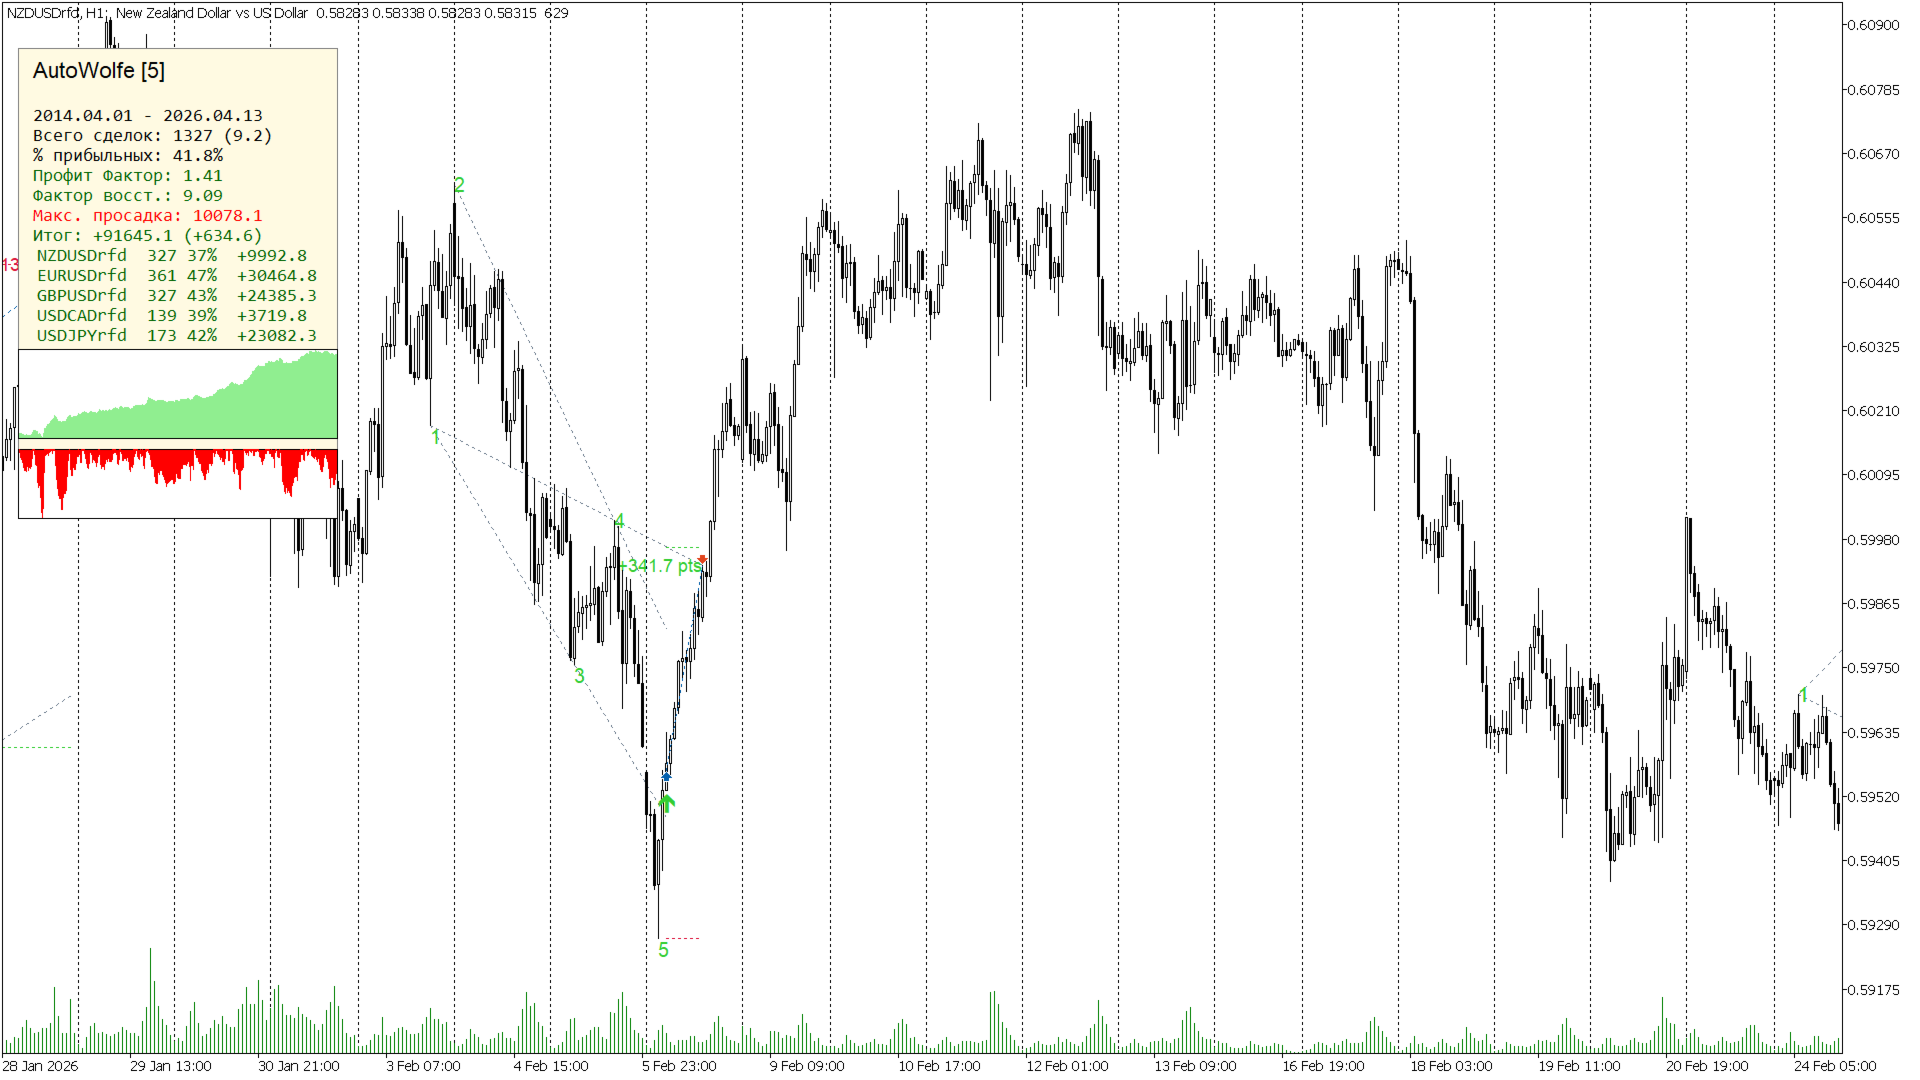
• 포트폴리오 모드: 단일 차트에서 최대 20개의 자산을 분석할 수 있으며 각 심볼별 실적 내역을 제공합니다.
• 통합 및 자동화: 이 지표는 정확한 거래 매개변수(진입가, SL, TP)를 터미널 전역 변수(Global Variables)로 내보내며(EA 제어 가능), 새로운 신호에 대해 푸시/이메일/알림을 전송합니다.
무거운 전략 테스터(Strategy Tester)를 실행할 필요 없이 울프 웨이브 전략의 신뢰성을 시각적 및 통계적으로 평가할 수 있는 완벽한 독립형 연구실입니다.