On Balance Volume Trendline
- 지표
- 버전: 1.3
- 업데이트됨: 18 11월 2021
- 활성화: 10

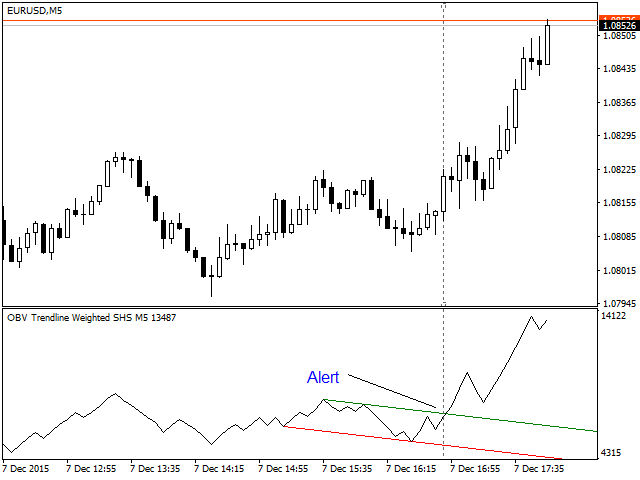
The indicator automatically sets trendlines on the really important points directly on the chart.
Timeframe, color and style of the lines can be adjusted.
Notification of a breakout above or below the line via a smartphone is possible.
Input Parameters
- TimeFrame: Choose timeframe
- AppliedPrice: Choose close , open, high, low, median, typical or weighted price
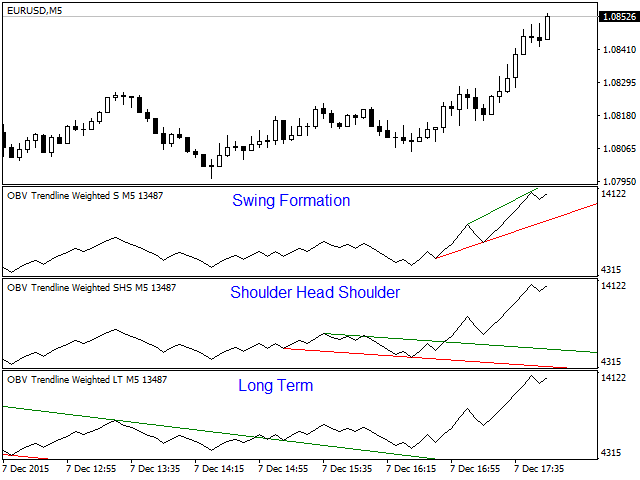
- Formation: Choose swing, Shoulder head shoulder or long term formation
- Alerts: true = alert is on
- SendEmail: Send message to email address
- SendNotifications: Send message to smartphone or tablet
- AlertAtClose: Alert when close cut from last value line
- LineColorHigh: Color for top line
- LineColorLow: Color for bottom line
- LineStyle: Line styles (solid, dash, dot, dash dot, dash dot dot)

Super Indikator