Cycle Wave Oscillator MT4
- 지표
- 버전: 1.0

CYCLE WAVE OSCILLATOR indicator is an indicator based on cyclical price fluctuations.
This indicator can help you determine overbought and oversold levels, and help you predict price trends within the cycle.
MT5 Version here!
You can combine it with our indicators below to make your trading decisions more accurate:
Feature:
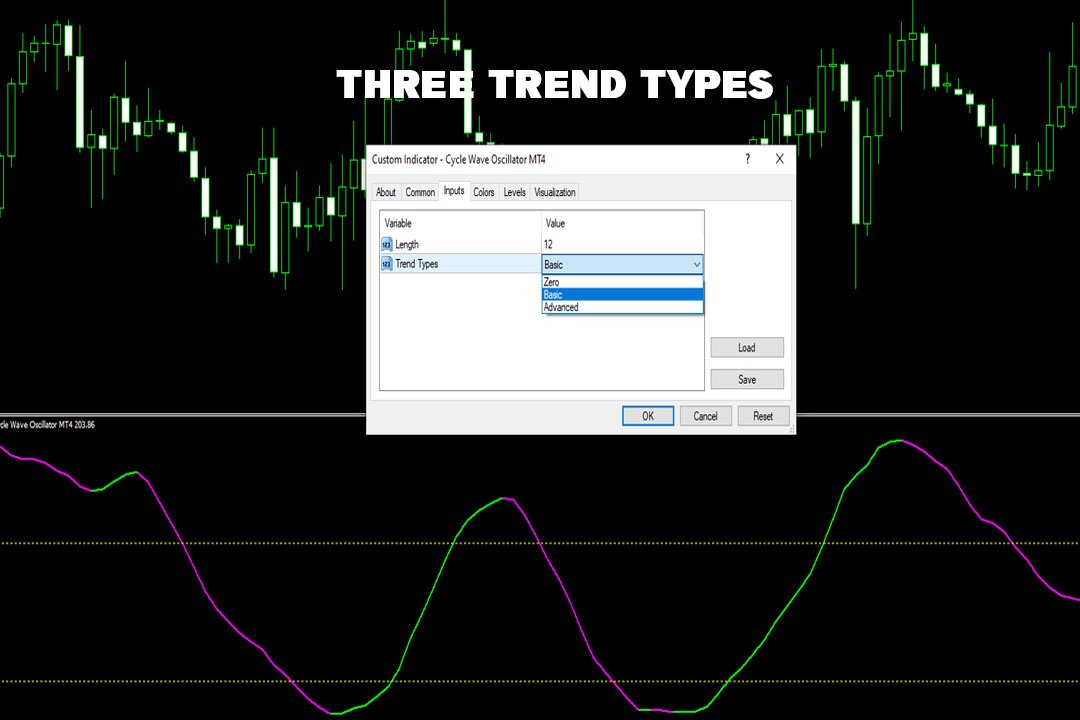
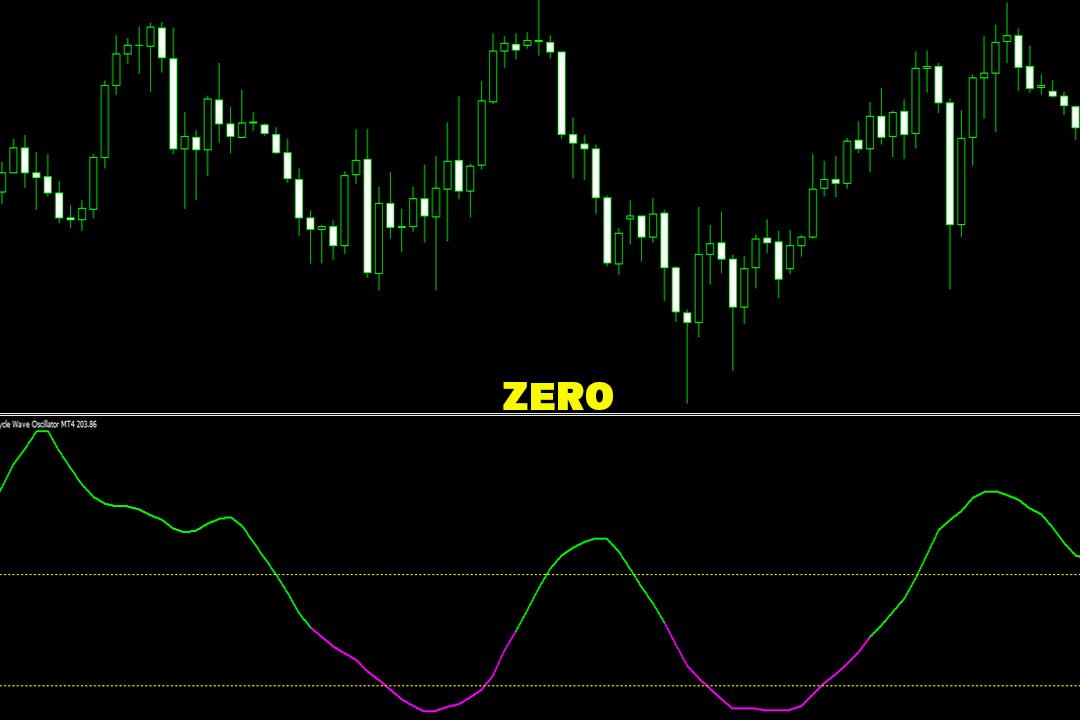
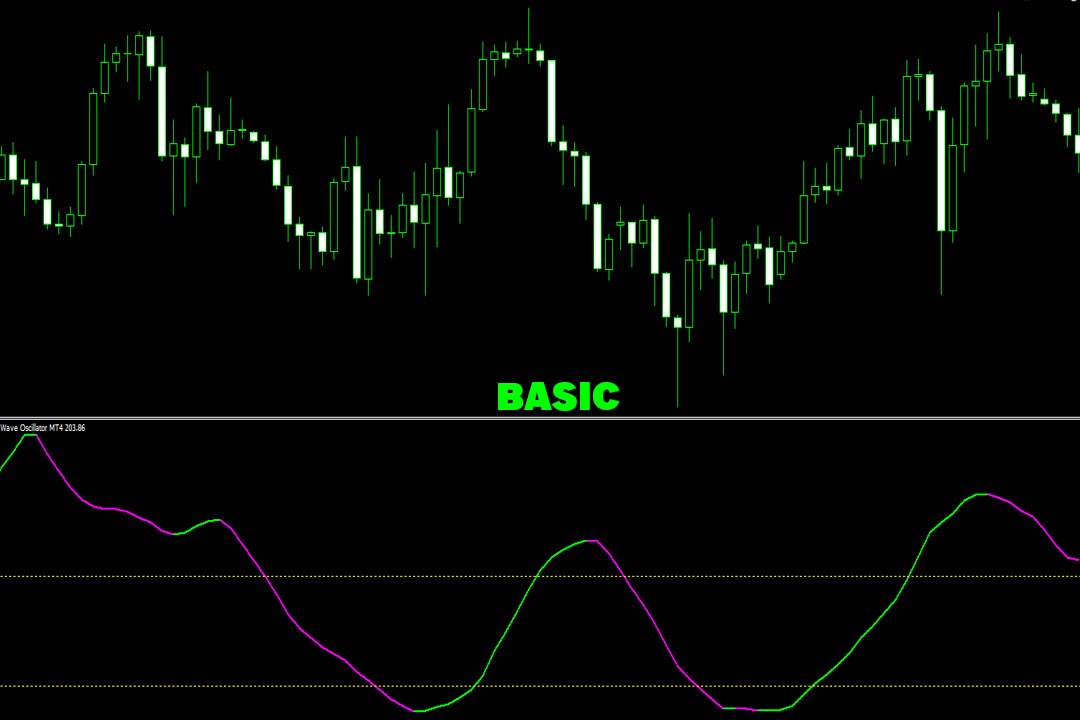
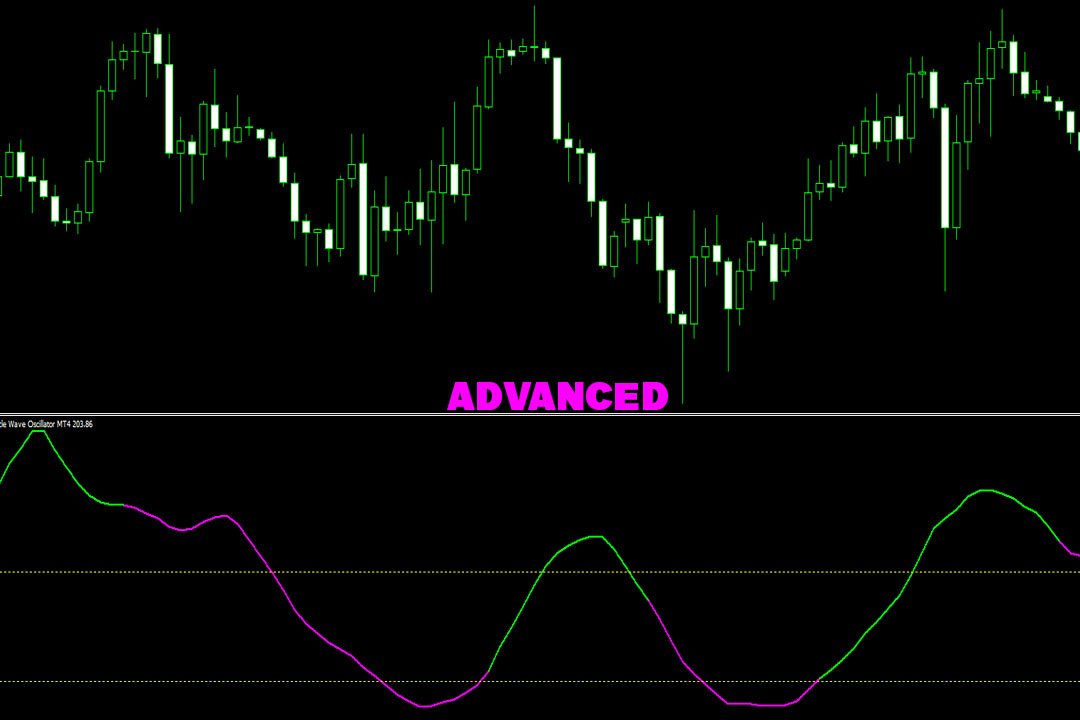
- Three Trend Types:
+ Zero
+ Basic
+ Advanced