Golden Move 2
- 지표
- 버전: 1.9
- 업데이트됨: 15 11월 2024
- 활성화: 10

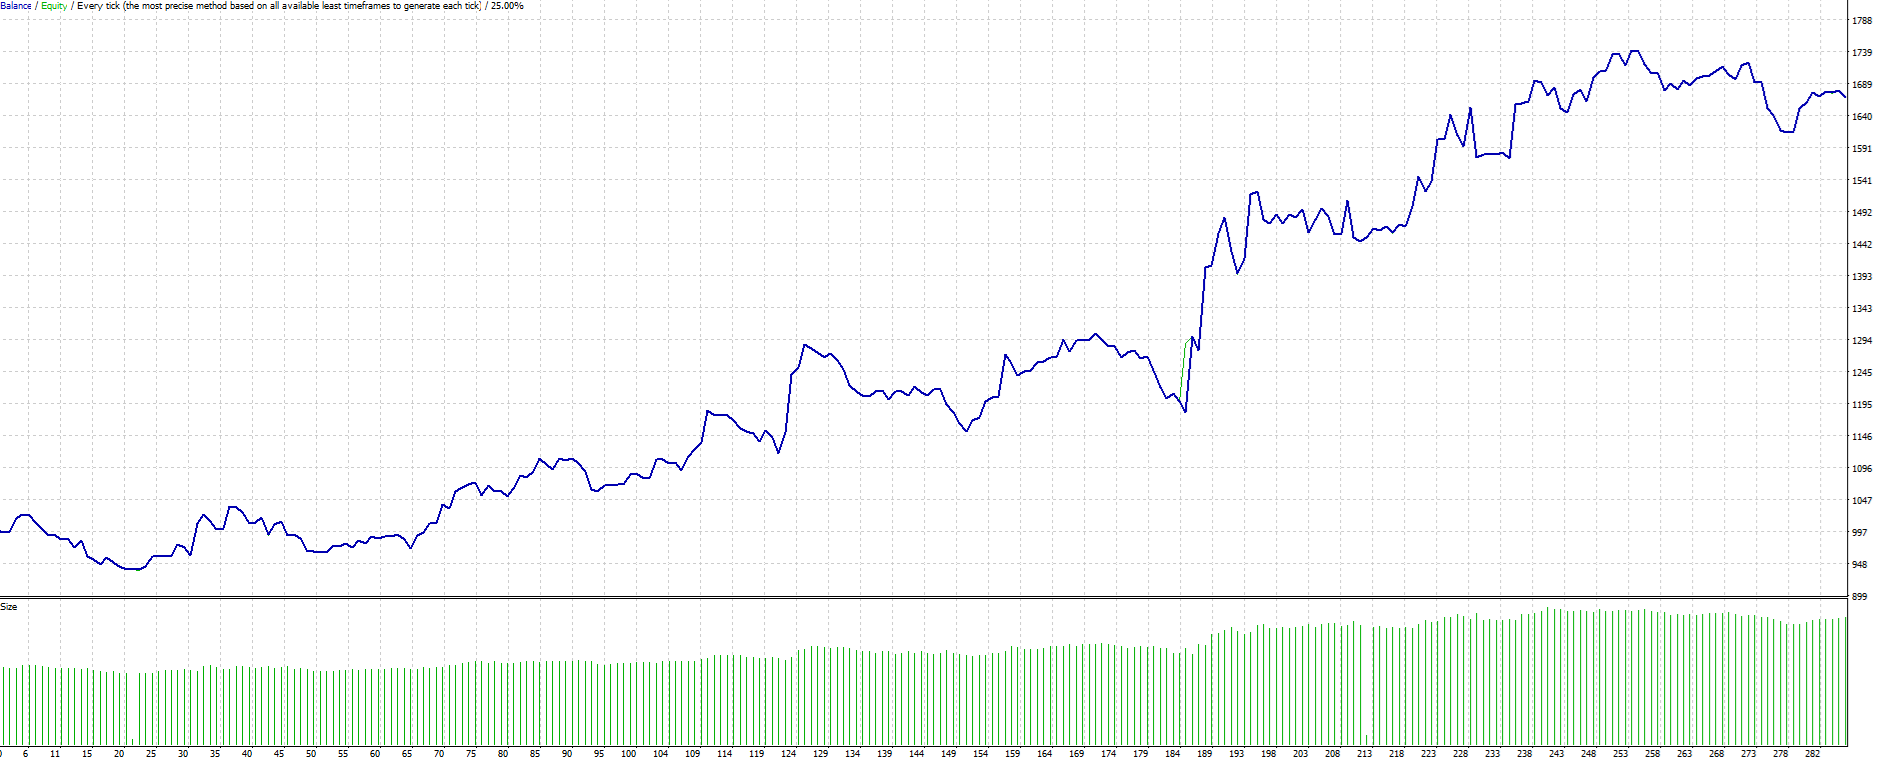
The best indicator out there, try it yourself!
Please leave your positive comments and reviews!
Settings:
AlertConfirmation: truns on and off alerts
CalculatedBars: how many bars will be calculated
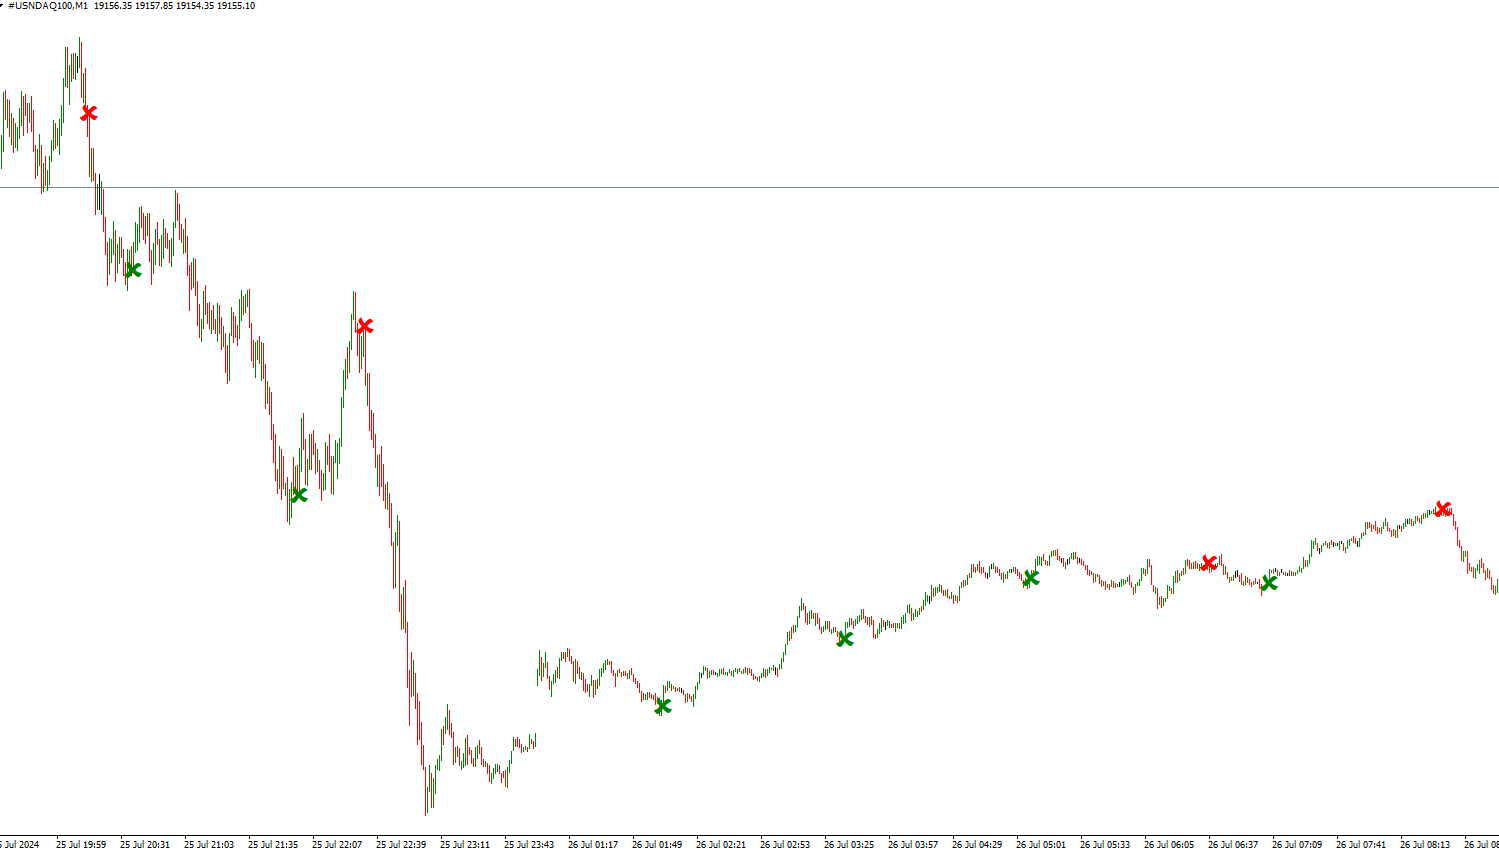
Distance : arrow distance
Buffers:
Buffer0 (Arrow Buy)
Buffer1 (Arrow Sell)
Buffer2 (Empty)
Buffer3 (Empty)
Buffer4(Buy value == 1)
Buffer5(Sell value ==1)