ASPCT Boom Crash Candle Reversal

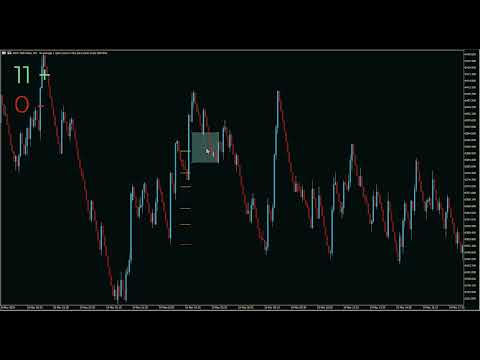
🚀 Indicator for Boom and Crash Synthetic Indices

The indicator will be sold in a limited quantity.

🔍 We present a specialized technical indicator designed exclusively for Boom and Crash synthetic indices offered by Deriv broker. This tool is tailored for traders who prefer a methodical approach to trading with clearly defined price levels.

📊 Indicator Functionality:
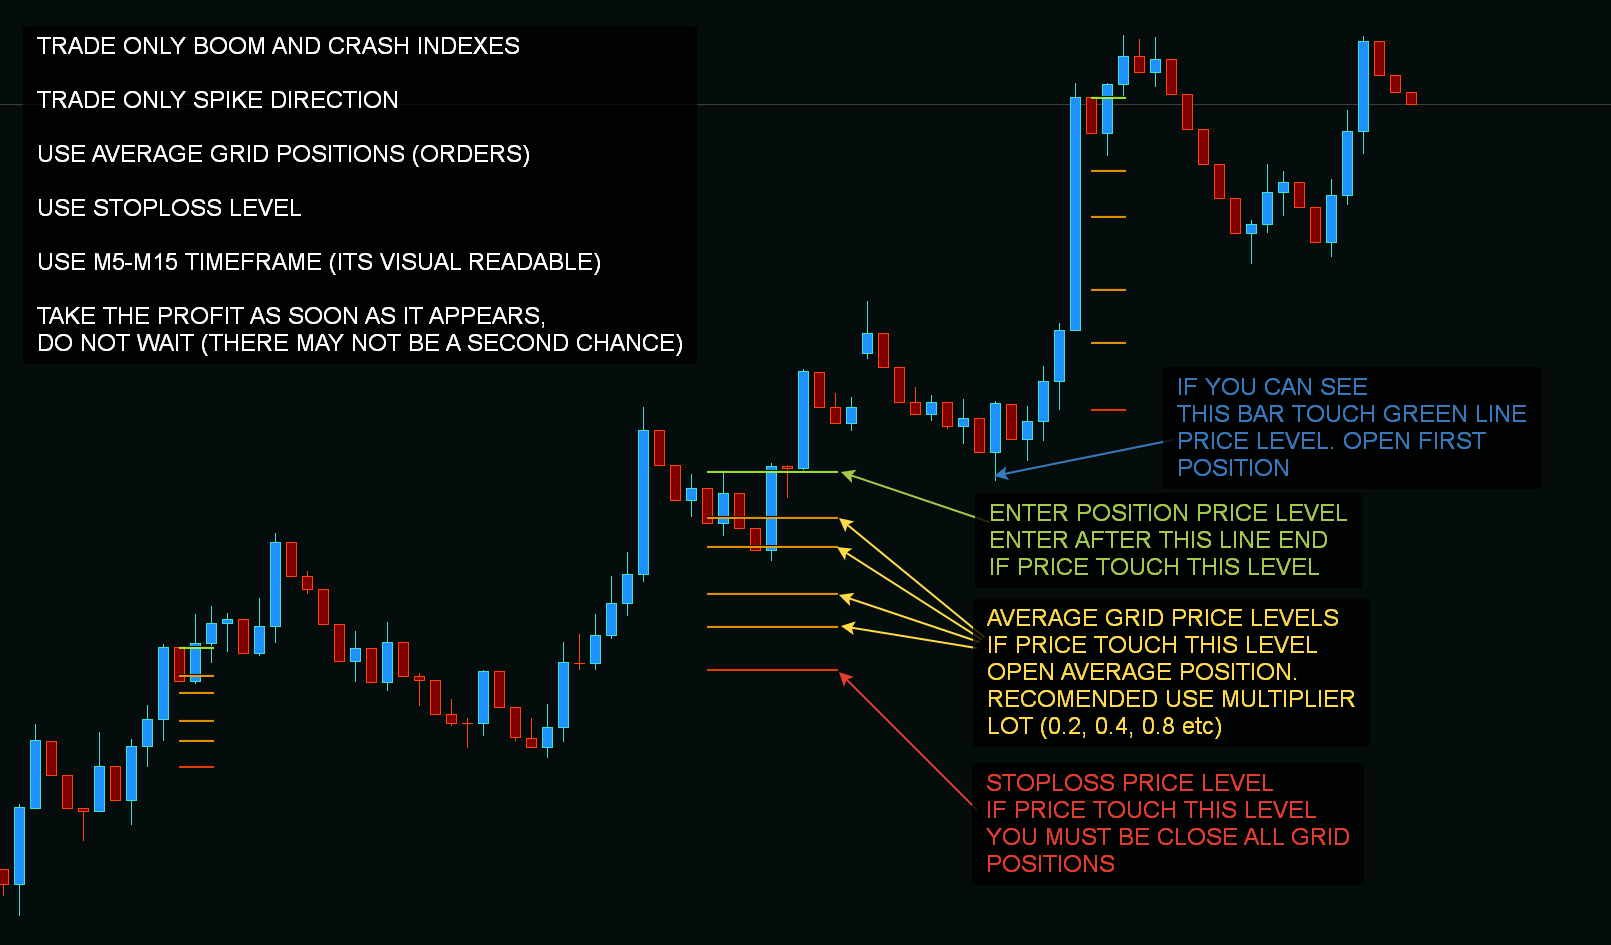
• Displays key price levels for position entry
• Indicates levels for position averaging
• Determines optimal stop-loss levels
• Optional alerts for timely notification of new price grid formation

⏱️ Signal Frequency: 1 to 5 signals per day on each of the 6 available indices, potentially offering up to 30 trading opportunities daily.

📈 Versatility: The indicator is applicable to any timeframe. The choice of time interval exclusively affects the convenience of visual analysis without altering the number of generated signals.

🔧 Recommended Trading Methodology:
1. Follow the direction of spikes when opening positions
2. Set stop-loss in accordance with the levels indicated by the indicator
3. Utilize an averaging strategy with position size increase at levels specified by the indicator
4. Upon reaching the profit zone, consider closing the position, taking into account potential market volatility

🎓 Educational Materials: For a deeper understanding of the indicator's operation, detailed screenshots and video materials, including graphical backtests, are provided.

⚙️ Configuration: The indicator requires minimal setup, including color scheme selection and the number of historical bars for analysis.

🧪 Testing: Before engaging in live trading, it is strongly recommended to conduct thorough testing of the indicator in your trading terminal's strategy tester.

⚠️ Risk Management: It is crucial to adhere to risk management principles and trade only with capital that, if lost, would not significantly impact your financial situation. The indicator's author bears no responsibility for potential financial losses or incorrect application of this analytical tool.

🔬 This indicator is the result of meticulous analysis and development aimed at optimizing trading decisions in the specific market conditions of synthetic indices. However, it's important to understand that any technical tool requires competent application and does not guarantee trading success.

📚 We recommend thoroughly studying all aspects of working with the indicator and integrating it into your trading system only after fully understanding its functionality and potential limitations.
추천 제품
Pivot meter
Theophane Dohou
새로운 트레이딩 도구: 트레이드를 최적화하세요! 저는 여러분에게 질문 없이 쉽게 거래할 수 있도록 제가 개발한 완전히 새로운 도구를 소개하게 되어 기쁩니다! 기존의 지표들과 달리, 이 도구는 가격 변동만을 추적하지 않습니다. 대신, 통화 간의 상관관계를 깊이 분석하고, 시장에 진입할 전략적 시점을 포착하는 데 도움을 줍니다. 작동 방식은 다음과 같습니다: 제로 = 거래 없음: 지표가 제로인 동안은 시장 조건이 좋지 않다는 의미이며, 저는 시장에 참여하지 않습니다. 경고는 4에서 발동: 만약 통화 중 하나가 4에 도달하면, 이 도구는 경고를 보내며 4개의 통화 쌍에서 거래할 수 있는 좋은 조건이 마련되었음을 알려줍니다. 상관관계 분석: 기존의 지표와 달리, 이 도구는 통화 간의 상관관계에 기반을 둡니다. 예를 들어, 한 통화가 달러와 상관관계가 있으면 1을 표시하고, 두 개의 통화가 상관관계가 있으면 2를 표시합니다. 4 이상이면 여러 통화가 달러에 비해 약세라는 의미이며,
The EA strategy This EA has a built-in combined Bollinger Bands Trend indicator, MACD and MA that checks the prices trends everytime and opens and closes new orders at the right time; Recommended for beginner traders because the default input values are optimized to work with acconts with ballance as low as US$ 300 ; It protects your profit because it is provided with Trailing Stop Loss, Minimum Equity Percentage to allow any trade, Maximum Spread alowed and you can also define the bad time to t
VTrende Pro
Andrii Diachenko
5 (1)
VTrende Pro - MTF indicator for trend trading with a display panel for MT5 *** Videos can be translated into any language using subtitles (video language - Russian) Although the signals of the VTrende Pro indicator can be used as signals of a full-fledged trading system, it is recommended to use them in conjunction with the Bill Williams TS. VTrende Pro is an extended version of the VTrende indicator. Difference between Pro version and VTrende: - Time zones - Signal V - signal 1-2 waves -    S
Spike detector tred
Odete Argelio Simbine
Spike DETECTOR Trend EA  Advanced Automated Trading for Boom & Crash Markets Description: Spike DETECTOR Trend EA is a state-of-the-art Expert Advisor designed specifically for Boom & Crash indices. Using advanced trend detection algorithms, market structure analysis, and smart filters, it identifies high-probability spikes with unmatched precision. Ideal for both scalping and trend-following strategies, this EA ensures consistent performance under high-volatility conditions. Key Features: Smar
ENGLISH DESCRIPTION (MQL5 Standard Optimized) Product Name: Marble Tempest Runemaker (MT5) [Subtitle: Rolling Momentum | Volatility Filter | Cryo-Stasis Safety] Introduction Marble Tempest Runemaker is a unique "Cyclic Decoding" trading system that treats market price as a rolling object influenced by gravity (Trends) and storms (Volatility). It combines the structural precision of "The Marble" (Parabolic SAR) with the momentum-decoding power of "The Rune" (CCI), all filtered through "The Tempes
Introduction to the Manual Backtesting Indicator on MQL5 The MetaTrader platform provides an excellent backtesting tool for evaluating Expert Advisors (EAs). However, when it comes to manually backtesting a strategy to assess its effectiveness, this tool has some limitations: You cannot manually draw zones or trend lines while in backtesting mode. You cannot switch timeframes to check time alignment. For example, if my strategy requires additional confirmation from a higher timeframe (HTF), this
Trend Turn
Ivan Simonika
The implementation of the Trend Turn trend indicator is simple - in the form of lines of two colors. The indicator algorithm is based on standard indicators as well as its own mathematical calculations. The indicator will help users determine the direction of the trend. It will also become an indispensable advisor for entering the market or closing a position. This indicator is recommended for everyone, both beginners and professionals. How to interpret information from the indicator. We sell
PipFinite Impulse PRO MT5
Karlo Wilson Vendiola
4.88 (16)
Are You Tired Of Getting Hunted By Spikes And Whipsaws? Don't become a victim of the market's erratic moves.. Do Something About It! Instantly make smarter decisions with Impulse Pro's precise balance of filters and accurate statistics. Timing Is Everything In Trading To learn more, please visit www.mql5.com/en/blogs/post/718212 Anticipate the next big move before it unfolds in 3 Simple Steps! Advantages You Get Early impulse detection algorithm. Flexible combination to different trading s
" Easy Trend Scalper MT5 " 지표는 추세 방향 내에서 스캘핑 거래를 위해 설계되었습니다. 표시기의 작동 원리. 이 지표는 시장이 어느 방향으로 움직이는지를 판단합니다. 빨간색 큰 화살표는 강세 방향을 나타냅니다. 파란색 큰 화살표 - 하락 방향을 나타냅니다. 강세 또는 약세 추세 내에서는 작은 화살표 형태로 스캘핑 신호를 생성하는 알고리즘이 있습니다. 주황색 화살표는 구매를 위한 신호입니다. 파란색 - 판매를 위한 신호입니다. 모든 거래 수단 및 모든 기간에서 사용할 수 있습니다. 추세 방향 변화와 진입 신호가 나타날 때 여러 유형의 알림을 제공합니다. 다시 그리지 않고도 작동하며 2~5개 캔들의 가격 방향을 예측할 수 있습니다. 화살표 형성 모드는 현재 캔들 또는 캔들 마감 시 수동으로 변경할 수 있습니다. 두 가지 경우에는 다음 캔들이 시작되어도 이전 캔들의 화살표는 다시 그려지지 않습니다. 원하는 도구에 맞게 구성해야 하는 매개변수도 수동으로 변경할
Flag Pattern pro is a   Price Action (PA)   analytical tool that scans the   continuation patterns   known as   "Flag and Pennant Patterns"   . Flag and Pennant patterns are continuation patterns characterized by a move in a previous trend direction after a shallow retracement usually below 50% of the original move . Deep retracements can however be sometimes found at the 61.8 % levels. The original move is know as the   flag pole   and the   retracement   is called the flag. Indicator Fundam
Nemesisfx boom and crash
Shandrey Naswil Petersen
trade boom and crash with trend arrows no repaint arrows direction of use  if you buy boom stoploss below arrow  if you sell crash stoploss above arrow please note that you need to follow trend to have perfect trades only use on m15   allow candles to close before taking trades please make sure you find this indicator useful as it has a 80% win rate on m15 h1 and h4 make good trades
Tabajara Rules II The Best for MT5
Samuel Manoel De Souza
4.9 (10)
Tabajara Rules for MT5 , based on Professor André Machado’s Tabajara Setup, indicates the market direction using moving averages when there are candles aligned with the direction of the moving average. The indicator contains the color rule applied to the candles and the moving average. It allows changing the parameters: period and smoothing method of the moving average. It also allows changing the colors of the candles (borders and filling) and of the moving average. Professor André Machado’s
FREE
Stormer RSI 2
Ricardo Rodrigues Lucca
This strategy was learned from Stormer to be used on B3. Basically, 15 minutes before closing the market, it will check RSI and decided if it will open an position. This strategy do not define a stop loss. If the take profit reach the entry price it will close at market the position. The same happens if the maximal number of days is reached. It is created to brazilian people, so all configuration are in portuguese. Sorry Activations allowed have been set to 50.
Aurus Apex
Dmitriq Evgenoeviz Ko
Aurus Apex — A Next-Generation Intelligent Trading Terminal Aurus Apex is more than just an advisor; it's a fully-fledged trading ecosystem that combines classic technical analysis, modern trade support algorithms, and fundamental data filtering. Designed for professionals who value deep customization, it remains as friendly as possible to beginners thanks to the "Plug & Play" concept: by default, the robot is configured for extremely conservative operation - one order per market with strict St
Professional Averaging Calculator - Essential Risk Management Tool for Every Trader Whether you're a beginner learning position averaging or a professional managing complex grid strategies, this calculator is your must-have tool. Beginners instantly see how averaging works, understand maximum loss scenarios, and learn proper risk management before entering trades - no more "I didn't know I could lose that much" surprises. Professionals save time and eliminate calculation errors with instant simu
Universal Soul Reaper
Pieter Gerhardus Van Zyl
Universal Soul Reaper is an atmospheric market-flow oscillator designed to interpret price behavior as a cycle of spiritual energy. Instead of reacting to raw price alone, it visualizes the state of the market’s soul —revealing when momentum is awakening, stabilizing, or fading. The indicator operates in a separate window and presents three interwoven entities: the Ectoplasmic Veil , the Spirit Boundary , and the Soul Core . Together, they form a living framework that helps traders sense pressu
Future Trend Channel은 트렌드 방향을 식별하고 잠재적인 가격 움직임을 예측하기 위해 설계된 동적이고 시각적으로 직관적인 지표입니다. 원래 ChartPrime이 TradingView용으로 개발한 이 도구는 MetaTrader 5에 맞게 조정되어 유사한 기능을 트레이더에게 제공합니다. 스윙 트레이더, 데이 트레이더 또는 장기 투자자이든 상관없이 Future Trend Channel은 트렌드 강도를 시각화하고 반전을 예측하며 진입/청산 지점을 최적화하는 데 도움을 줍니다. 주요 특징: 모든 시간대 호환 - Forex, 주식, 상품 및 암호화폐를 포함한 모든 시간대와 금융 상품에서 작동 스마트 트렌드 감지 - SMA, ATR 및 HL2(고가-저가 평균)를 결합하여 강세 및 약세 트렌드 채널을 동적으로 표시 미래 가격 예측 - 현재 트렌드 기울기에 따라 잠재적인 미래 가격 수준을 예측하여 트레이딩 계획 수립 지원 명확한 시각적 신호 - 강세 및 약세 신호는 트렌드 확인을 표시
DYJ TradingView
Daying Cao
5 (1)
DYJ TRADINGVIEW는 등급 신호 카운트 및 분석 도구를 사용하여 글로벌 시장에서 진입 기회를 찾는 다중 지표 등급 시스템입니다. DYJ TRADINGVIEW에는 시장 분석을 위한 10가지 내장 지표가 있습니다. 지표 기반 분석은 많은 거래자가 수행할 거래와 거래를 시작하고 종료할 위치에 대한 결정을 내리는 데 사용합니다. 우리는 서로를 잘 보완할 수 있는 몇 가지 다른 유형을 사용합니다. 귀하의 시장을 추적하기 위해 저희를 사용하십시오. 더 정확한 거래를 찾을 수 있습니다. 등급에 참여하는 추세 지표에는 DYJ POWERSIGNAL, ADX, SMA, 볼린저 밴드가 있습니다. 등급에 참여하는 오실레이터에는 MACD, RSI, Stochastic, Alligator가 있습니다. 시그널의 개수가 3개 이상일 때 시그널을 매수 또는 매도하는 동일한 방향을 나타내는 3개의 지표가 있을 때 시장 거래에 진입하기 시작합니다. 입력 [일반] ViewName = "DYJ
Zone to Zone Indicator for MT5 Unleash the full potential of your trading strategy with the "Zone to Zone" indicator for MetaTrader 5. This advanced tool provides unparalleled precision and versatility, making it an essential addition to any trader's toolkit. Key Features: MT5 Compatibility : Seamlessly integrates with the MetaTrader 5 platform for a smooth and efficient trading experience. Accurate Historical Resistance/Support Zones : Effortlessly draw and identify key resistance and support
This indicator helps to visualize the Bollinger Band status of 28 pairs. With the feature of color panel, alert, and notification features, user can catch the potential Bollinger Bounce opportunities from 28 main pairs on one Dashboard quickly. Dashboard Bollinger Band is an intuitive and handy graphic tool to help you to monitor all 28 pairs and provide trading signals based on the Bollinger Bounce Rules (Overbought/Oversold and Bollinger Band Cross). Color legend clrOrange: price is above the
ORB Displacement
Jeffrey Quiatchon
ORB Displacement London Sweep Bias · NY Displacement · Order Block & FVG Zone Entry Signal "The market tells you its direction every single morning. Asian range. London sweep. NY displacement. You just need to know how to read it." What Is ORB Displacement? Every trading day follows the same institutional rhythm. The Asian session builds a quiet range. London opens and sweeps one side of it — taking out retail stops and building the liquidity needed for the real move. Then New York opens, displ
Manyal trading system, CovEchoTrend Robot, focuses on reliability and flexibility. By employing statistical analysis methods to study the relationships between the base indicator and market patterns, the system enables a deeper understanding of market processes. Intelligent pattern analysis: The application of statistical data processing helps identify key trend reversal points more accurately, signaling significant market shifts. Informed decision-making is based on the intersection of indicato
Golden Dominator
Dmitriq Evgenoeviz Ko
Golden Dominator — an adaptive scalping expert advisor for XAUUSD Golden Dominator is a fully automated trading expert advisor for MetaTrader 5, designed specifically for trading gold ( XAUUSD ) on the H1 timeframe. The advisor uses a multi-level analytical model that combines momentum, volatility, and adaptive market filtering to identify short-term trading opportunities. The algorithm is designed for stable and controlled trading in changing market dynamics, including periods of increased vola
High Probability Reversal Arrow Indicator The indicator looks for trend exhaustion areas, and plots Buy/Sell arrow after on confirmation of trend exhaustion. Signals can also   be shown as popup alerts, or be sent as e-mail or mobile phone notification. Trades can be taken on breakout of the signal candle. Inputs Signal Type: Aggressive/Normal History Bars : Can be set to 0 (zero) to show all historical signals, or can be set to a limited number of bars for faster execution. Show Alert : True/Fa
Introduction to Fractal Pattern Scanner Fractal Indicator refers to the technical indicator that makes use of the fractal geometry found in the financial market. Fractal Pattern Scanner is the advanced Fractal Indicator that brings the latest trading technology after the extensive research and development work in the fractal geometry in the financial market. The most important feature in Fractal Pattern Scanner is the ability to measure the turning point probability as well as the trend probabil
Noize Absorption Index
Ekaterina Saltykova
Noize Absorption Index - is the manual trading system that measures the difference of pressure between bears forces and bulls forces. Green line - is a noize free index that showing curent situation. Zero value of index shows totally choppy/flat market.Values above zero level shows how powerfull bullish wave is and values below zero measures bearish forces.Up arrow appears on bearish market when it's ready to reverse, dn arrow appears on weak bullish market, as a result of reverse expectation.
CS Bollinger
MIKHAIL VINOGRADOV
CS Bollinger – 볼린저 밴드를 기반으로 한 신호 지표로, 주요 지지 및 저항 수준을 신속하게 파악하고 시각적인 거래 신호를 제공합니다. 개선된 수준 전환 로직을 통해 차트에서 자동으로 레벨을 조정하며, 가격 반전이 확인될 때 신호 화살표를 표시합니다. 이를 통해 트레이더는 시장 진입 및 이탈을 위한 최적의 순간을 빠르게 찾을 수 있습니다. 또한 개인의 거래 전략에 맞춰 유연한 설정이 가능하며, 초보자부터 숙련된 트레이더까지 폭넓게 사용할 수 있습니다. 매개변수 기본값 설명 BollingerPeriod 5 볼린저 밴드 계산 기간. 평균을 계산할 캔들의 수를 정의합니다. BollingerDeviation 5 밴드 상단과 하단 라인을 계산하는 데 사용되는 편차 계수 CheckZeroBar false 신호 생성 시 가장 최근 캔들(0번 캔들)의 확인 활성화 여부 ColorResistance clrDeepPink 위에서 아래로 전환하는 저항선의 색상 Colo
HMA Trend Professional MT5
Pavel Zamoshnikov
4.25 (4)
Improved version of the free HMA Trend indicator (for MetaTrader 4) with statistical analysis. HMA Trend is a trend indicator based on the Hull Moving Average (HMA) with two periods. HMA with a slow period identifies the trend, while HMA with a fast period determines the short-term movements and signals in the trend direction. The main differences from the free version: Ability to predict the probability of a trend reversal using analysis of history data. Plotting statistical charts for analyzi
A Simple Moving Average (SMA) is a statistical indicator used in time series analysis. This indicator represents the arithmetic mean of a sequence of values over a specific period of time. SMA is used to smooth short-term fluctuations in data, helping to highlight the overall trend or direction of changes. This aids analysts and traders in better understanding the general dynamics of the time series and identifying potential trends or changes in direction.  More information you can find in Wiki 
Buy Signals
Heet Chandubhai Patel
Buy Signal Indicator This indicator generates a Bu y Signal when a potential upward movement is detected. A G reen Arrow appears below the price chart, indicating a possible entry point for a long position. The signal helps traders identify moments of strength in the market. TIP:- USE 1 HOUR OR BIGGER TIMEFRAMES FOR BETTER RESULTS. TRAIL STOP LOSS BY USING NEAREST SWING HIGHS AND LOWS. NOTE:- THIS INDICATOR GIVES ONLY BUY SIGNALS FOR SELL SIGNAL USE MY OTHER INDICATOR. 
이 제품의 구매자들이 또한 구매함
Azimuth Pro
Ottaviano De Cicco
5 (4)
LAUNCH PROMO Azimuth Pro price is initially set at 299$ for the first 100 buyers. Final price will be 499$ . THE DIFFERENCE BETWEEN RETAIL AND INSTITUTIONAL ENTRIES ISN'T THE INDICATOR — IT'S THE LOCATION. Most traders enter at arbitrary price levels, chasing momentum or reacting to lagging signals. Institutions wait for price to reach structured levels where supply and demand actually shift. Azimuth Pro maps these levels automatically: swing-anchored VWAP, multi-timeframe structure lines, an
AriX
Temirlan Kdyrkhan
1 (4)
AriX Indicator for MT5 A powerful trend-following and signal-evaluation tool AriX is a custom MT5 indicator that combines Moving Averages and ATR-based risk/reward logic to generate clear buy/sell signals. It visualizes dynamic SL/TP levels, evaluates past trade outcomes, and displays win/loss statistics in a clean on-chart panel. Key features include: Buy/Sell signals based on MA crossovers ATR-based SL/TP1/TP2/TP3 levels with visual lines and labels Signal outcome tracking with real-time stat
OmniSync Projection
Antonio-alin Teculescu
5 (1)
Chronos Fractal Engine is an innovative price projection indicator for MetaTrader 5, designed to transform your technical analysis by intelligently identifying and projecting historical price patterns. Built upon an advanced correlation algorithm and the fractal principles of the market, this powerful tool visualizes potential future price movements, giving you a unique edge in your trading decisions. What is Chronos Fractal Engine? At its core, the Chronos Fractal Engine employs a sophisticat
우선적으로, 이 거래 도구는 전문적인 거래에 이상적인 비-다시 그리기 및 지연되지 않는 지표입니다.  온라인 강좌, 사용자 매뉴얼 및 데모. 스마트 가격 액션 컨셉트 인디케이터는 신규 및 경험 많은 트레이더 모두에게 매우 강력한 도구입니다. Inner Circle Trader Analysis 및 Smart Money Concepts Trading Strategies와 같은 고급 거래 아이디어를 결합하여 20가지 이상의 유용한 지표를 하나로 결합합니다. 이 인디케이터는 스마트 머니 컨셉트에 중점을 두어 대형 기관의 거래 방식을 제공하고 이동을 예측하는 데 도움을 줍니다.  특히 유동성 분석에 뛰어나 기관이 어떻게 거래하는지 이해하는 데 도움을 줍니다. 시장 트렌드를 예측하고 가격 변동을 신중하게 분석하는 데 탁월합니다. 귀하의 거래를 기관 전략에 맞추어 시장의 동향에 대해 더 정확한 예측을 할 수 있습니다. 이 인디케이터는 시장 구조를 분석하고 중요한 주문 블록을 식별하고 다양
ARIPoint
Temirlan Kdyrkhan
ARIPoint is a powerful trading companion designed to generate high-probability entry signals with dynamic TP/SL/DP levels based on volatility. Built-in performance tracking shows win/loss stats, PP1/PP2 hits, and success rates all updated live. Key Features: Buy/Sell signals with adaptive volatility bands Real-time TP/SL/DP levels based on ATR Built-in MA Filter with optional ATR/StdDev volatility Performance stats panel (Success, Profit/Loss, PP1/PP2) Alerts via popup, sound, push, or email Cu
RelicusRoad Pro MT5
Relicus LLC
5 (24)
RelicusRoad Pro: 퀀트 시장 운영 체제 70% 할인 평생 이용권 (한정 시간) - 2,000명 이상의 트레이더와 함께하세요 왜 대부분의 트레이더는 "완벽한" 지표를 가지고도 실패할까요? 진공 상태에서 단일 개념 만으로 거래하기 때문입니다. 문맥 없는 신호는 도박입니다. 지속적인 승리를 위해서는 컨플루언스(중첩) 가 필요합니다. RelicusRoad Pro는 단순한 화살표 지표가 아닙니다. 완전한 퀀트 시장 생태계 입니다. 독점적인 변동성 모델링을 사용하여 가격이 이동하는 "공정 가치 로드"를 매핑하고, 단순 노이즈와 실제 구조적 돌파를 구분합니다. 추측은 그만두세요. 기관급 로드 로직으로 거래를 시작하세요. 핵심 엔진: "Road" 알고리즘 시스템의 중심에는 시장 상황에 실시간으로 적응하는 동적 변동성 채널인 Road Algo 가 있습니다. 세이프 라인(평형) 과 가격이 수학적으로 반전될 가능성이 높은 확장 레벨 을 투영합니다. Simple Road: 일반적인 시장을 위
" Dynamic Scalper System MT5 " 지표는 추세 파동 내에서 스캘핑 방식으로 거래하도록 설계되었습니다. 주요 통화쌍 및 금에서 테스트되었으며, 다른 거래 상품과의 호환성이 가능합니다. 추가적인 가격 변동 지원을 통해 추세에 따라 단기 포지션 진입 신호를 제공합니다. 지표의 원리 큰 화살표는 추세 방향을 결정합니다. 작은 화살표 형태의 스캘핑 신호를 생성하는 알고리즘은 추세 파동 내에서 작동합니다. 빨간색 화살표는 상승 방향을, 파란색 화살표는 하락 방향을 나타냅니다. 민감한 가격 변동선은 추세 방향으로 그려지며, 작은 화살표의 신호와 함께 작용합니다. 신호는 다음과 같이 작동합니다. 적절한 시점에 선이 나타나면 진입 신호가 형성되고, 선이 있는 동안 미결제 포지션을 유지하며, 완료되면 거래를 종료합니다. 권장되는 작업 시간대는 M1~H4입니다. 화살표는 현재 캔들에 형성되며, 다음 캔들이 이미 시작되었더라도 이전 캔들의 화살표는 다시 그려지지 않습니다. 입
TPA True Price Action indicator reveals the true price action of the market makers through 100% non-repainting signals strictly at the close of a candle! TPA shows entries and re-entries, every time the bulls are definitely stronger than the bears and vice versa. Not to confuse with red/green candles. The shift of power gets confirmed at the earliest stage and is ONE exit strategy of several. There are available now two free parts of the TPA User Guide for our customers. The first "The Basics"
CGE Trading Suite
Carl Gustav Johan Ekstrom
5 (1)
CGE Trading Suite delivers the analytical edge typically reserved for professional trading desks. The platform integrates a full suite of analytical tools into one seamless workflow: dynamic grid mapping, liquidity behavior analysis, ECM, trend lines, MIDAS, trade cycles, and directional channel projections. Together, these provide a unified view of market structure and momentum. Directional clarity is further enhanced by the capital flow index, which measures currency basket strength to identif
Ultimate SMC Indicator
Hicham Mahmoud Almoustafa
1 (1)
Ultimate SMC PRO – Smart Money Concepts Indicator (Order Blocks, FVG, Liquidity, BOS) for MetaTrader 5   After purchasing the product, you will receive an additional copy for free. Just contact me after your purchase. Ultimate SMC PRO is a professional trading indicator designed to visualize Smart Money Concepts directly on the chart. The indicator combines several institutional trading tools in one system to help traders identify potential high-probability trading zones. ULTIMATE SMC INDICATO
Pointer Trend Switch — precision trend reversal indicator Pointer Trend Switch is a high-precision arrow indicator designed to detect key moments of trend reversal based on asymmetric price behavior within a selected range of bars. It identifies localized price impulses by analyzing how far price deviates from the opening level, helping traders find accurate entry points before a trend visibly shifts. This indicator is ideal for scalping, intraday strategies, and swing trading, and performs equa
ARIScalping
Temirlan Kdyrkhan
ARIScalp is a powerful trading companion designed to generate high-probability entry signals with dynamic TP/SL/DP levels based on volatility. Built-in performance tracking shows win/loss stats, PP1/PP2 hits, and success rates all updated live. Key Features: Buy/Sell signals with adaptive volatility bands Real-time TP/SL/DP levels based on ATR Built-in MA Filter with optional ATR/StdDev volatility Performance stats panel (Success, Profit/Loss, PP1/PP2) Alerts via popup, sound, push, or email Cus
Moon Cycle
Navdeep Singh Kaur
Jean Meeus 천문 알고리즘을 사용하여 거래 차트에 달의 위상을 표시하는 기술적 지표입니다. 전문 천문대와 동등한 과학적 정밀도로 달의 주기를 나타내는 연속 곡선을 제공합니다. MT5의 모든 심볼과 시간대에 호환되며, 외환, 상품, 지수, 주식 거래에서 사용할 수 있습니다. 현재 달의 위상, 조명 백분율, 기술적 분석용 참조 수준을 표시하는 정보 패널을 포함합니다. 색상 및 스타일 설정은 완전히 사용자 정의 가능합니다. 정밀한 천문 계산을 기반으로 실시간 달 위상 데이터를 제공하여, 거래자들이 객관적으로 달의 정보를 시장 분석에 통합할 수 있도록 합니다. 과학적 정밀도와 금융 시장 분석을 결합한 전문가용 도구입니다. ............................................
Matreshka
Dimitr Trifonov
5 (2)
Matreshka self-testing and self-optimizing indicator: 1. Is an interpretation of the Elliott Wave Analysis Theory. 2. Based on the principle of the indicator type ZigZag, and the waves are based on the principle of interpretation of the theory of DeMark. 3. Filters waves in length and height. 4. Draws up to six levels of ZigZag at the same time, tracking waves of different orders. 5. Marks Pulsed and Recoil Waves. 6. Draws arrows to open positions 7. Draws three channels. 8. Notes support and re
Native Channels
BeeXXI Corporation
5 (1)
This indicator recognizes all support and resistance levels. A number of unique high-performance techniques have been applied, which made the existence of this indicator possible. All formed channels are naturally visible: horizontal linear linear parabolic cubic (Polynomial 3 degrees - Wave) This is due to a bundle of approximating channels. The formed channels form "standing waves" in a hierarchical sequence. Thus, all support and resistance levels are visible. All parameter management is i
Cyclic Impulse MT5 — 이 기술 지표는 차트 구조를 분석하여 주기적인 가격 움직임을 식별합니다. 이를 통해 주기적인 가격 움직임의 반전과 진입 신호를 찾을 수 있습니다. 지표 작동 방식 주기적인 하락 움직임이 감지되면 캔들 마감 후 파란색 하락 막대가 생성됩니다. 현재 캔들에서 잠시 깜빡일 수 있으며, 신호는 아직 확정되지 않았습니다. 파란색 화살표는 가격 차트에 중복 표시됩니다. 주기적인 상승 움직임이 감지되면 캔들 마감 후 빨간색 상승 막대가 생성됩니다. 현재 캔들에서 잠시 깜빡일 수 있으며, 신호는 아직 확정되지 않았습니다. 주황색 ​​화살표는 가격 차트에 중복 표시됩니다. 모든 차트, 시간 프레임, 거래 상품에 사용 가능합니다. 다양한 알림 유형을 제공합니다. 가격 차트에 추가 화살표를 표시합니다. 과거 차트에는 다시 그려지지 않으며, 캔들 마감 시에만 작동합니다. 캔들이 마감되더라도 화살표나 막대는 사라지지 않습니다. 사용 및 매개변수 설정이 간편하며,
Transaction Speed MT5
Ivan Stefanov
5 (3)
이 지표는 시장에서 관심이 나타나는 영역 을 강조 표시한 후, 주문이 누적되는 영역 을 보여줍니다. 이는 **대규모 오더북(호가창)**처럼 작동합니다. 이것은 거대한 자금 을 위한 인디케이터입니다. 성능은 탁월하며, 시장에서 어떤 관심이 있든 반드시 포착할 수 있습니다 . (이것은 완전히 새로 작성되고 자동화된 버전 입니다 – 이제 수동 분석은 필요하지 않습니다.) **거래 속도(Transaction Speed)**는 새로운 개념의 인디케이터로, 시장에 대규모 주문이 언제, 어디에 쌓이는지를 보여주며 , 그 이점을 분석합니다. 매우 초기 단계에서 트렌드 전환 을 감지할 수 있습니다. FX 시장에서 흔히 사용하는 "거래량(volume)"은 오해입니다. 실제로는 시간당 가격 변화량 이므로, 올바른 용어는 거래 속도 입니다. 우리가 어떻게 사고하고, 행동하며, 분석하느냐 가 가장 중요합니다. 분석 패러다임의 전환 은 필수적입니다. 이 인디케이터는 외환 시장에서의 볼륨 개념을 논리적으로
TrendMaestro5
Stefano Frisetti
note: this indicator is for METATRADER4, if you want the version for METATRADER5 this is the link:  https://www.mql5.com/it/market/product/108106 TRENDMAESTRO ver 2.5 TRENDMAESTRO recognizes a new TREND from the start, he never makes mistakes. The certainty of identifying a new TREND is priceless. DESCRIPTION TRENDMAESTRO identifies a new TREND in the bud, this indicator examines the volatility, volumes and momentum to identify the moment in which there is an explosion of one or more of these da
Weis Wave with Alert MT5
Trade The Volume Waves Single Member P.C.
4.94 (17)
Rental/Lifetime Package Options and Privileges  Rent Monthly Six Months   Yearly/Lifetime Weis Wave with Speed with Alert+Speed Index x x x Manual  x x x Quick Set up Video x x x Blog x x x Lifetime Updates x x x Setup and Training Material x x Discord Access Channel "The SI traders"          x Rectangle Break Alert Tool      x How to trade with it:    http://www.tradethevolumewaves.com   ** If you purchase please contact me to setup your  : Training Room and  complete manual access.  Wei
1. Tool Description The   Dynamic Liquidity HeatMap Profile   is an advanced technical indicator originally designed by BigBeluga (Pine Script) and ported to MQL5. Unlike a standard Volume Profile which shows where volume   has   occurred, this tool attempts to visualize where liquidity (limit orders and stop losses) is   likely waiting   (resting liquidity). It works by identifying pivots (local highs and lows) weighted by volume and ATR.   Crucially, if price moves through a level, that liquid
MetaForecast M5
Vahidreza Heidar Gholami
5 (3)
MetaForecast는 가격 데이터의 조화를 기반으로 모든 시장의 미래를 예측하고 시각화합니다. 시장이 항상 예측 가능한 것은 아니지만 가격에 패턴이 있다면 MetaForecast는 가능한 정확하게 미래를 예측할 수 있습니다. 다른 유사한 제품과 비교했을 때, MetaForecast는 시장 동향을 분석하여 더 정확한 결과를 생성할 수 있습니다. 입력 매개변수 Past size (과거 크기) MetaForecast가 미래 예측을 생성하기 위한 모델을 만드는 데 사용하는 막대의 수를 지정합니다. 모델은 선택한 막대 위에 그려진 노란색 선으로 표시됩니다. Future size (미래 크기) 예측해야 할 미래 막대의 수를 지정합니다. 예측된 미래는 핑크색 선으로 표시되며 그 위에 파란색 회귀선이 그려집니다. Degree (차수) 이 입력은 MetaForecast가 시장에서 수행할 분석 수준을 결정합니다. Degree 설명  0 차수 0의 경우, "Past size" 입력에 모든 봉우리와
Introduction to X3 Chart Pattern Scanner X3 Cherart Pattern Scanner is the non-repainting and non-lagging indicator detecting X3 chart patterns including Harmonic pattern, Elliott Wave pattern, X3 patterns, and Japanese Candlestick patterns. Historical patterns match with signal patterns. Hence, you can readily develop the solid trading strategy in your chart. More importantly, this superb pattern scanner can detect the optimal pattern of its kind. In addition, you can switch on and off individu
Rtc ML Ai Predictor
Muhammad Faisal Sagala
Rtc ML Ai | Predictor CORE MACHINE LEARNING ENGINE Adaptive ML Market Predictor – Multi-Bar Trend & Candle Forecast What This Indicator Does This indicator is a  real-time market prediction engine  designed to analyze price behavior and estimate  future market tendencies . Unlike conventional indicators, this system  does not rely on static parameters or historical curve-fitting , but adapts its internal state dynamically during live market operation. Instead of using static rules, the indic
Jita Indicator Pro
Jimmy Mwaba
1 (1)
Jita Indicator Pro MT5 | All Timeframes Professional Trend Agreement System – Premium Edition ($500) What Is Jita Indicator Pro? Jita Indicator Pro is a structured trend-confirmation system designed for serious traders who value precision, alignment, and controlled signal behavior. It combines: Advanced band-based trend direction logic ATR-driven structural trigger engine Dual-confirmation agreement system Locked history update design This indicator prints signals only when multiple conditions
Polar Volumetric is not just an indicator; it is a complete trading ecosystem designed for serious traders, Prop Firm candidates, and Scalpers. It fuses three powerful concepts into one clean chart: Adaptive Trend , Momentum Oscillator , and Real-Time Volume Data . KEY INNOVATION: Unified Calculation Engine Unlike standard volume indicators that show different data on different charts, Polar Volumetric uses a proprietary Unified Engine . This ensures that the Volume Delta you see on the Sc
Elliott Wave Trend MT5
Young Ho Seo
4 (4)
Elliott Wave Trend was designed for the scientific wave counting. This tool focuses to get rid of the vagueness of the classic Elliott Wave Counting using the guideline from the template and pattern approach. In doing so, firstly Elliott Wave Trend offers the template for your wave counting. Secondly, it offers Wave Structural Score to assist to identify accurate wave formation. It offers both impulse wave Structural Score and corrective wave Structure Score. Structural Score is the rating to sh
물론입니다. 아래는 제공해주신 텍스트의 한국어 번역입니다: MT4용 천문학 지표 소개: 귀하의 최상급 하늘 트레이딩 동반자 트레이딩 경험을 천체의 높이로 끌어올리기 준비가 되셨나요? MT4용 천문학 지표를 소개합니다. 이 혁신적인 도구는 복잡한 알고리즘의 힘을 활용하여 탁월한 천문학적 통찰과 정밀한 계산을 제공합니다. 정보의 우주를 손에 담다:   천문학적 데이터의 보물함을 드러내는 포괄적인 패널을 살펴보세요. 행성의 지오/헬리오센트릭 좌표, 태양/지구 거리, 크기, 길이, 별자리, 황도 좌표 및 적도 좌표, 심지어 수평 좌표 등 각각이 정밀하게 계산되고 아름답게 제시됩니다. 지표에 의해 생성된 수직선은 시간 값에 해당하여 트레이딩 여정에 우주적인 시각을 부여합니다. 행성 라인과 관계:   수정 가능한 스케일과 각도로 차트를 장식하는 행성 라인의 마법을 경험해보세요. 직관적인 컨트롤 패널을 통해 각 행성의 라인의 가시성을 손쉽게 전환할 수 있습니다. 쥰션이나 섹스타일, 사분각, 삼분
AX Forex Indicator MT5
MQL TOOLS SL
5 (1)
The AX Forex Indicator MT5 is a sophisticated trading tool designed to provide traders with a comprehensive analysis of multiple currency pairs. This   powerful indicator   simplifies the complex nature of the forex market, making it accessible for both novice and experienced traders. AX Forex Indicator uses   advanced algorithms   to detect trends, patterns and is an essential tool for traders aiming to enhance their forex trading performance. With its robust features, ease of use, and reliabl
설명 ICSM(Impulse-Correction SCOB Mapper)은 가격 움직임을 분석하고 유효한 충격, 수정 및 SCOB(Single Candle Order Block)을 식별하는 지표입니다. 유연하고 정보가 풍부하며 사용하기 쉽고 가장 유동성이 높은 관심 영역에 대한 트레이더의 인식을 크게 향상시키기 때문에 모든 유형의 기술적 분석과 함께 사용할 수 있는 강력한 도구입니다. 설정 일반 | 시각 색상 테마 - ICSM의 색상 테마를 정의합니다. SCOB | 시각 SCOB 표시 - SCOB를 활성화/비활성화합니다; SCOB 표시 방법 - SCOB 표현을 위한 스타일 옵션 목록을 나타냅니다; SCOB 색상 - SCOB의 색상을 정의합니다; ICM | 시각 ICM 라인 표시 - ICM(Impulse-Correction Mapper) 라인을 활성화/비활성화합니다; IC 트렌드 표시 - 차트 하단의 색상 구분선을 통해 충격-수정 트렌드 시각화를 활성화/비활성화합니다;
Overview TriParity AfterShock PRO Scanner는 MetaTrader 5용 재량형 대시보드 인디케이터입니다. 본 설명에서 triad는 세 개의 통화쌍 또는 종목 간의 관계를 의미합니다. Scanner는 여러 triad와 여러 시간 주기를 하나의 패널에서 검토하며, 트레이더가 관찰 목록을 보다 구조적으로 정리할 수 있도록 돕습니다. 그 목적은 차트 과부하를 줄이고, 후보를 나란히 비교하며, 더 자세히 검토할 가치가 있는 조건을 강조하는 것입니다. 이 제품은 삼각 차익거래를 실행하지 않습니다. 진정한 삼각 차익거래는 세 개의 레그를 거의 동시에 실행해야 하며, 매우 낮은 지연 시간과 매우 작은 거래 비용이 필요합니다. Scanner는 패리티 조정 이후에도 일시적으로 남아 있을 수 있는 왜곡 상태를 재량적으로 검토하기 위해 설계되었습니다. Functions Scanner는 선택된 triad를 여러 시간 주기에 걸쳐 분석하고 NOWCAST를 통해 현재 상태를 표시
제작자의 제품 더 보기
Good day! I present to you a trading technical indicator for Deriv broker synthetic indices. This indicator ONLY works with the following indices: Boom 300 Index Boom 500 Index Boom 1000 Index Crash 300 Index Crash 500 Index Crash 1000 Index The indicator was created to give signals to open medium-term trades in the direction of Spikes. But you can open trades in the opposite direction to Spikes, at your own risk. Trade only on M1. Other TFs do not guarantee the correct operation of the indica
ASPCT Boom Crash Omniscope Description ASPCT Boom Crash Omniscope is a scalping indicator designed to analyze and visualize price movements on the Boom and Crash indices. The indicator tracks six different indices: Boom 1000, Boom 500, Boom 300, Crash 1000, Crash 500 and Crash 300. Peculiarities Display signals for six different Boom and Crash indices Using color indicators to indicate different market conditions Separate indicator window with buttons for quick switching between symbols Works ex
필터:
리뷰 없음
리뷰 답변