Niveis DX Media Movel MT4
- 지표
- 버전: 1.0

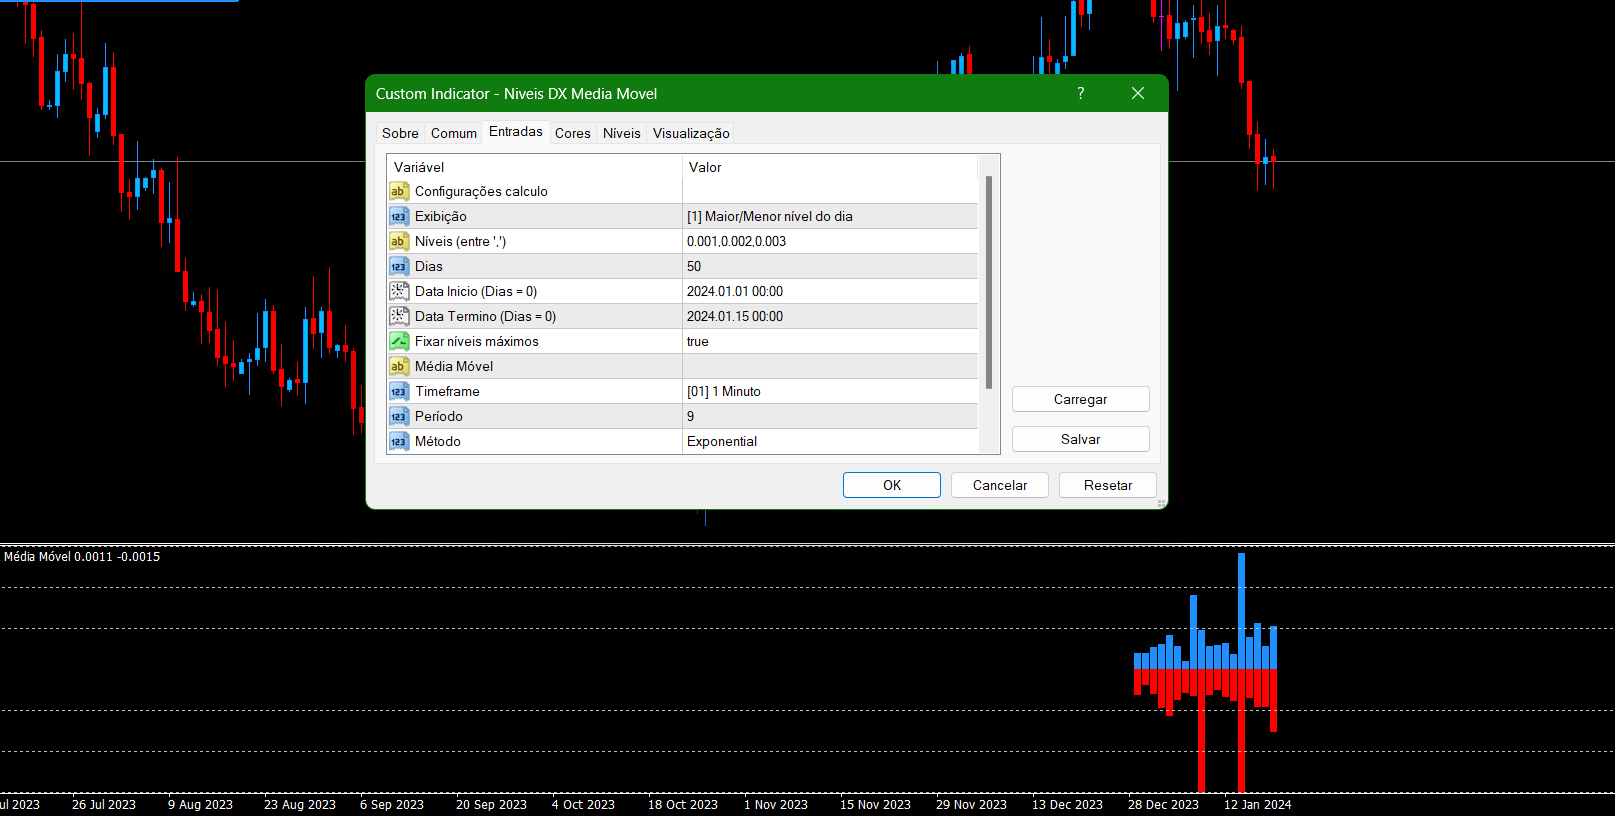
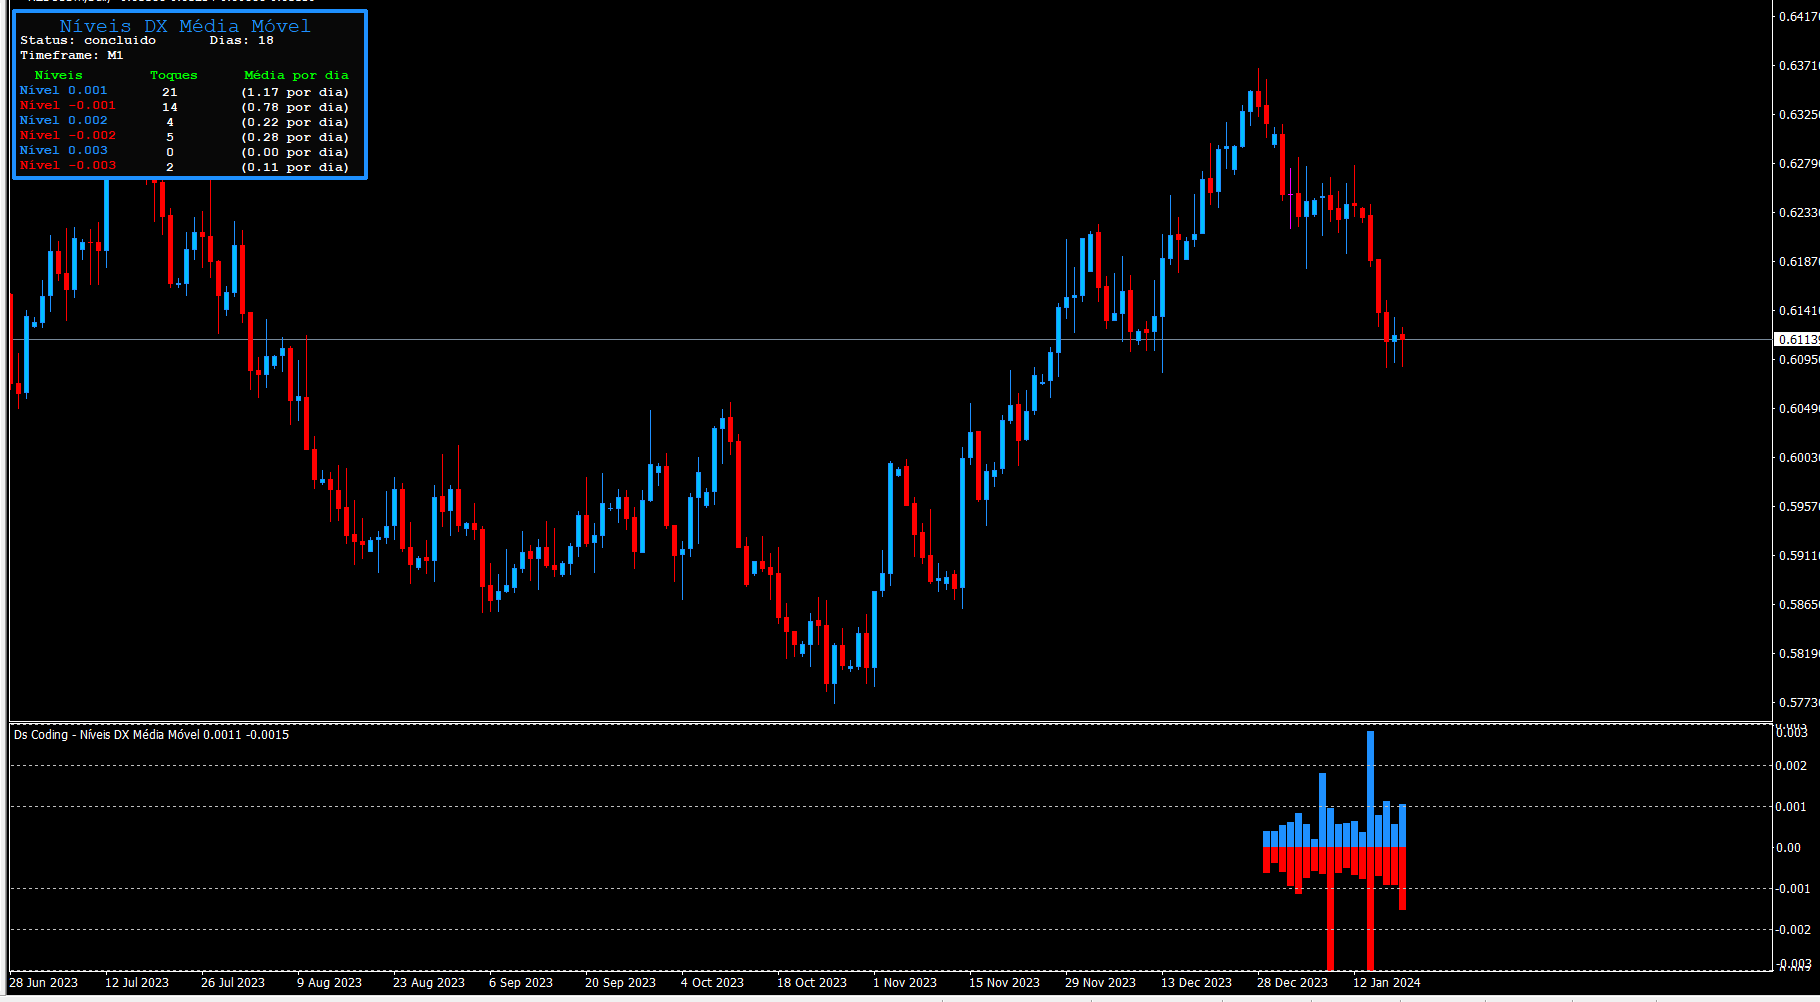
O indicador é uma ferramenta desenvolvida para o MetaTrader, projetada para auxiliar na análise detalhada do comportamento do preço em relação a uma média móvel específica. Ao ser anexado ao timeframe diário, o ele realiza cálculos e monitora, em timeframes menores, quantas vezes o preço toca determinados níveis de afastamento durante o dias além de calcular a média dos toques.
MT5: https://www.mql5.com/pt/market/product/111710
MT5: https://www.mql5.com/pt/market/product/111710