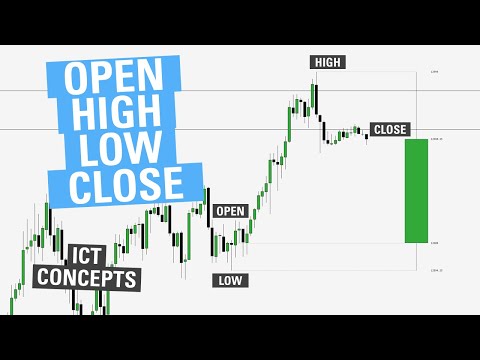
ICT Power of 3
- 지표
- 버전: 1.4
- 업데이트됨: 11 2월 2025
- 활성화: 5

One of the most powerful and important ICT concepts is the Power of 3.
It explains the IPDA (Interbank Price Delivery Algorithm) phases. PO3 simply means there are 3 things that the market maker's algorithm do with price:
Accumulation, Manipulation and Distribution
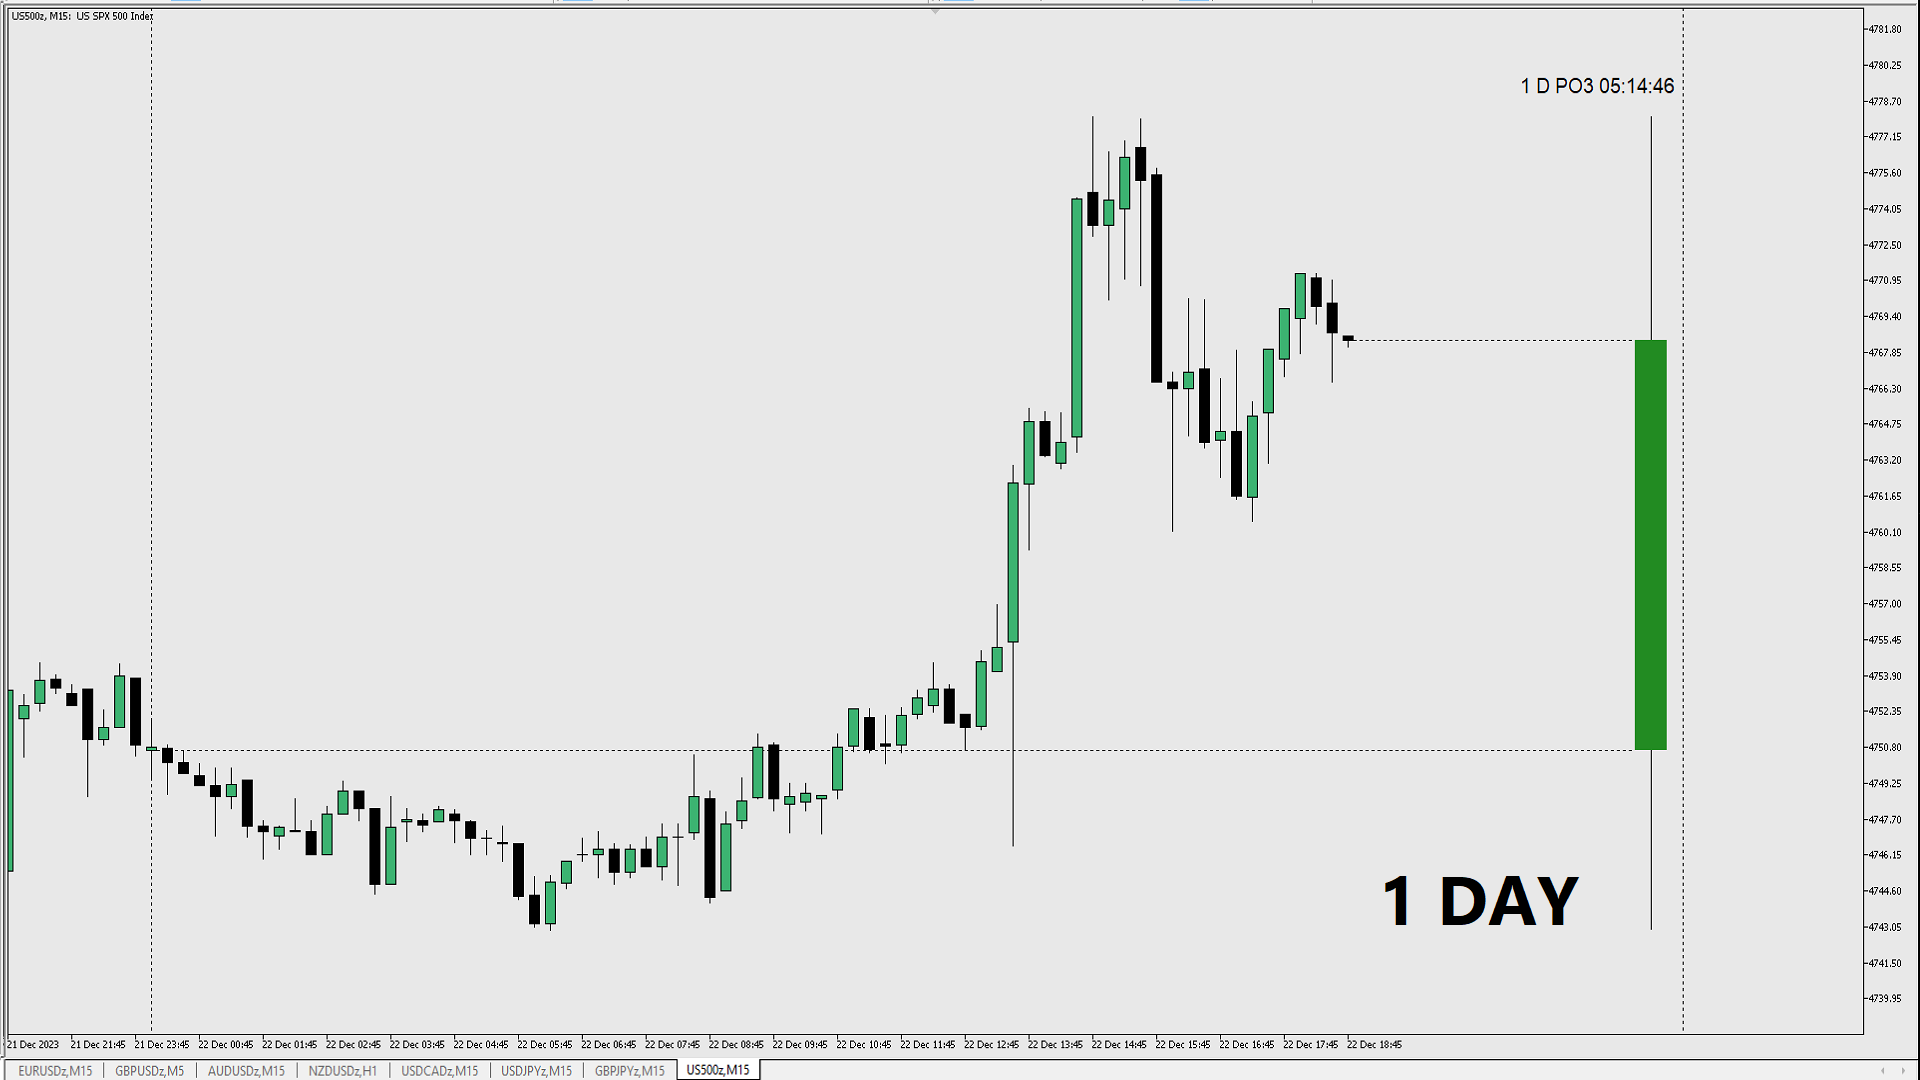
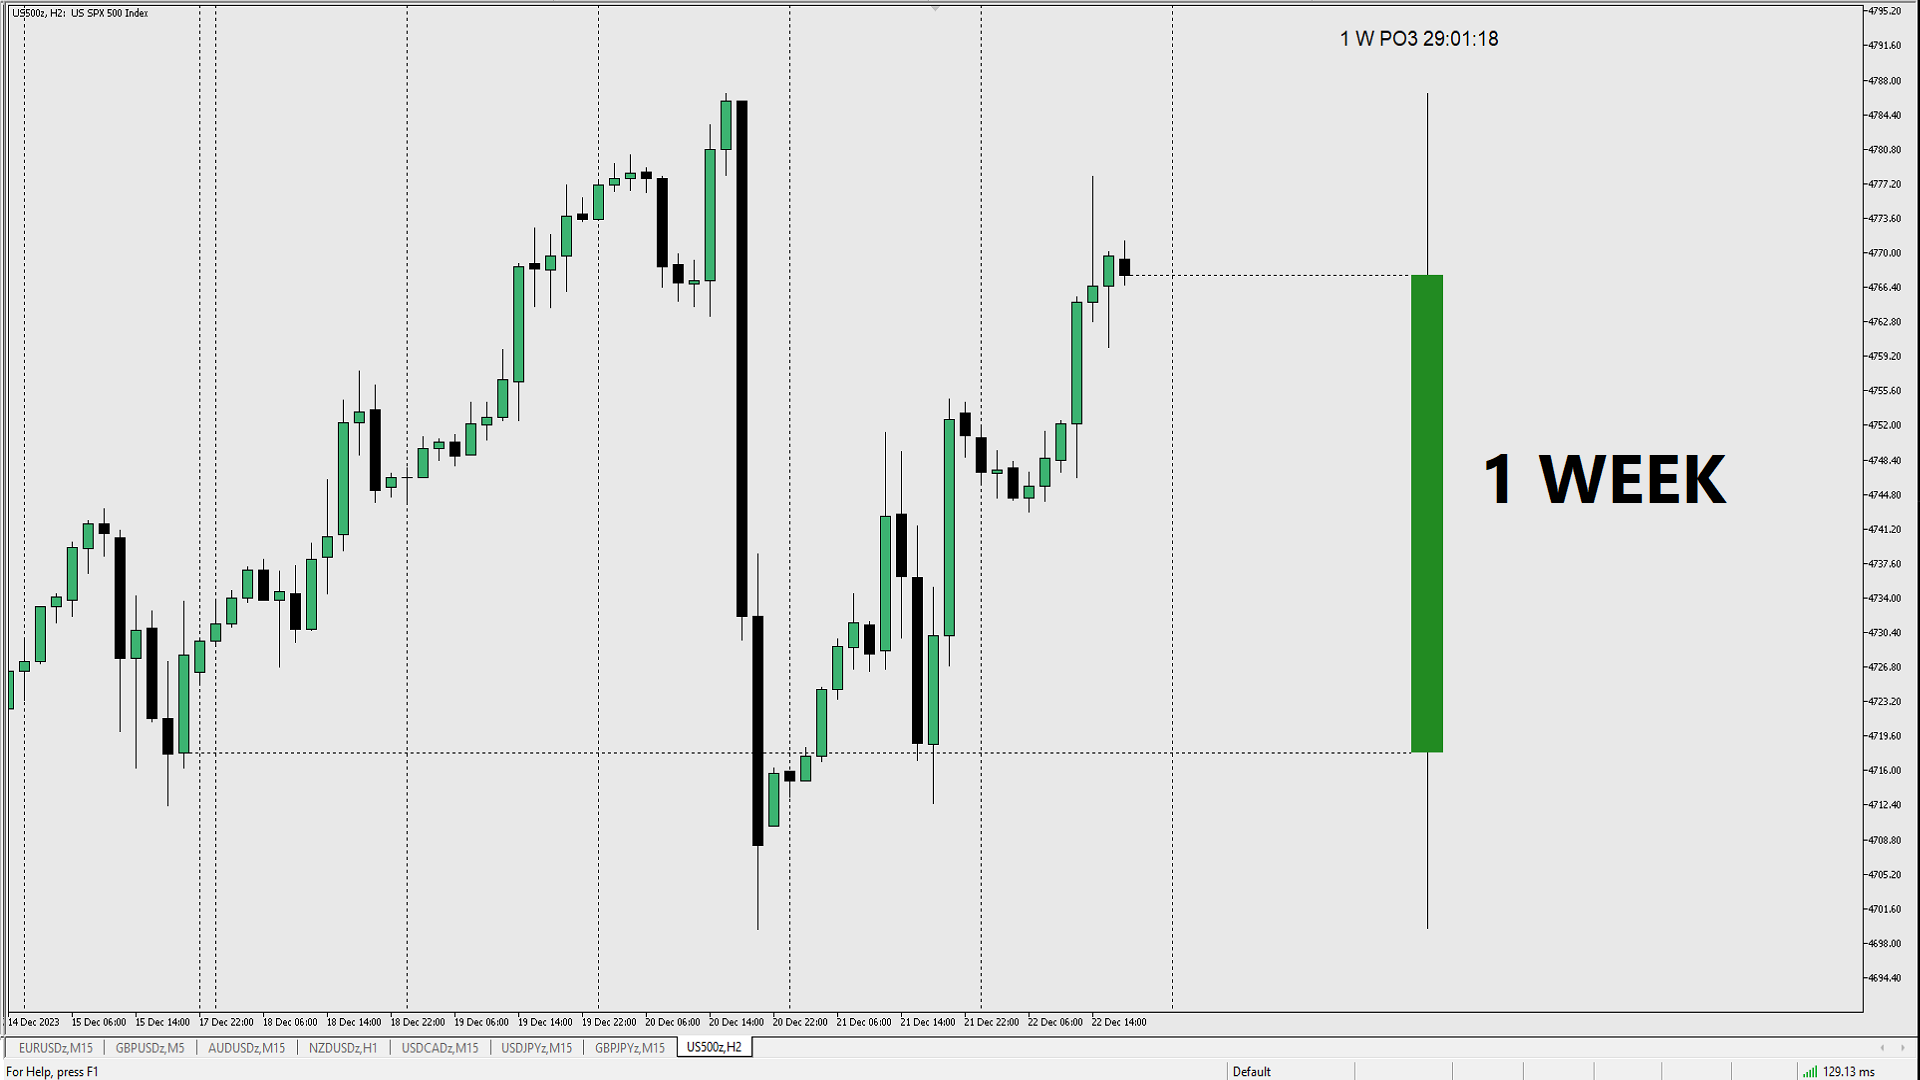
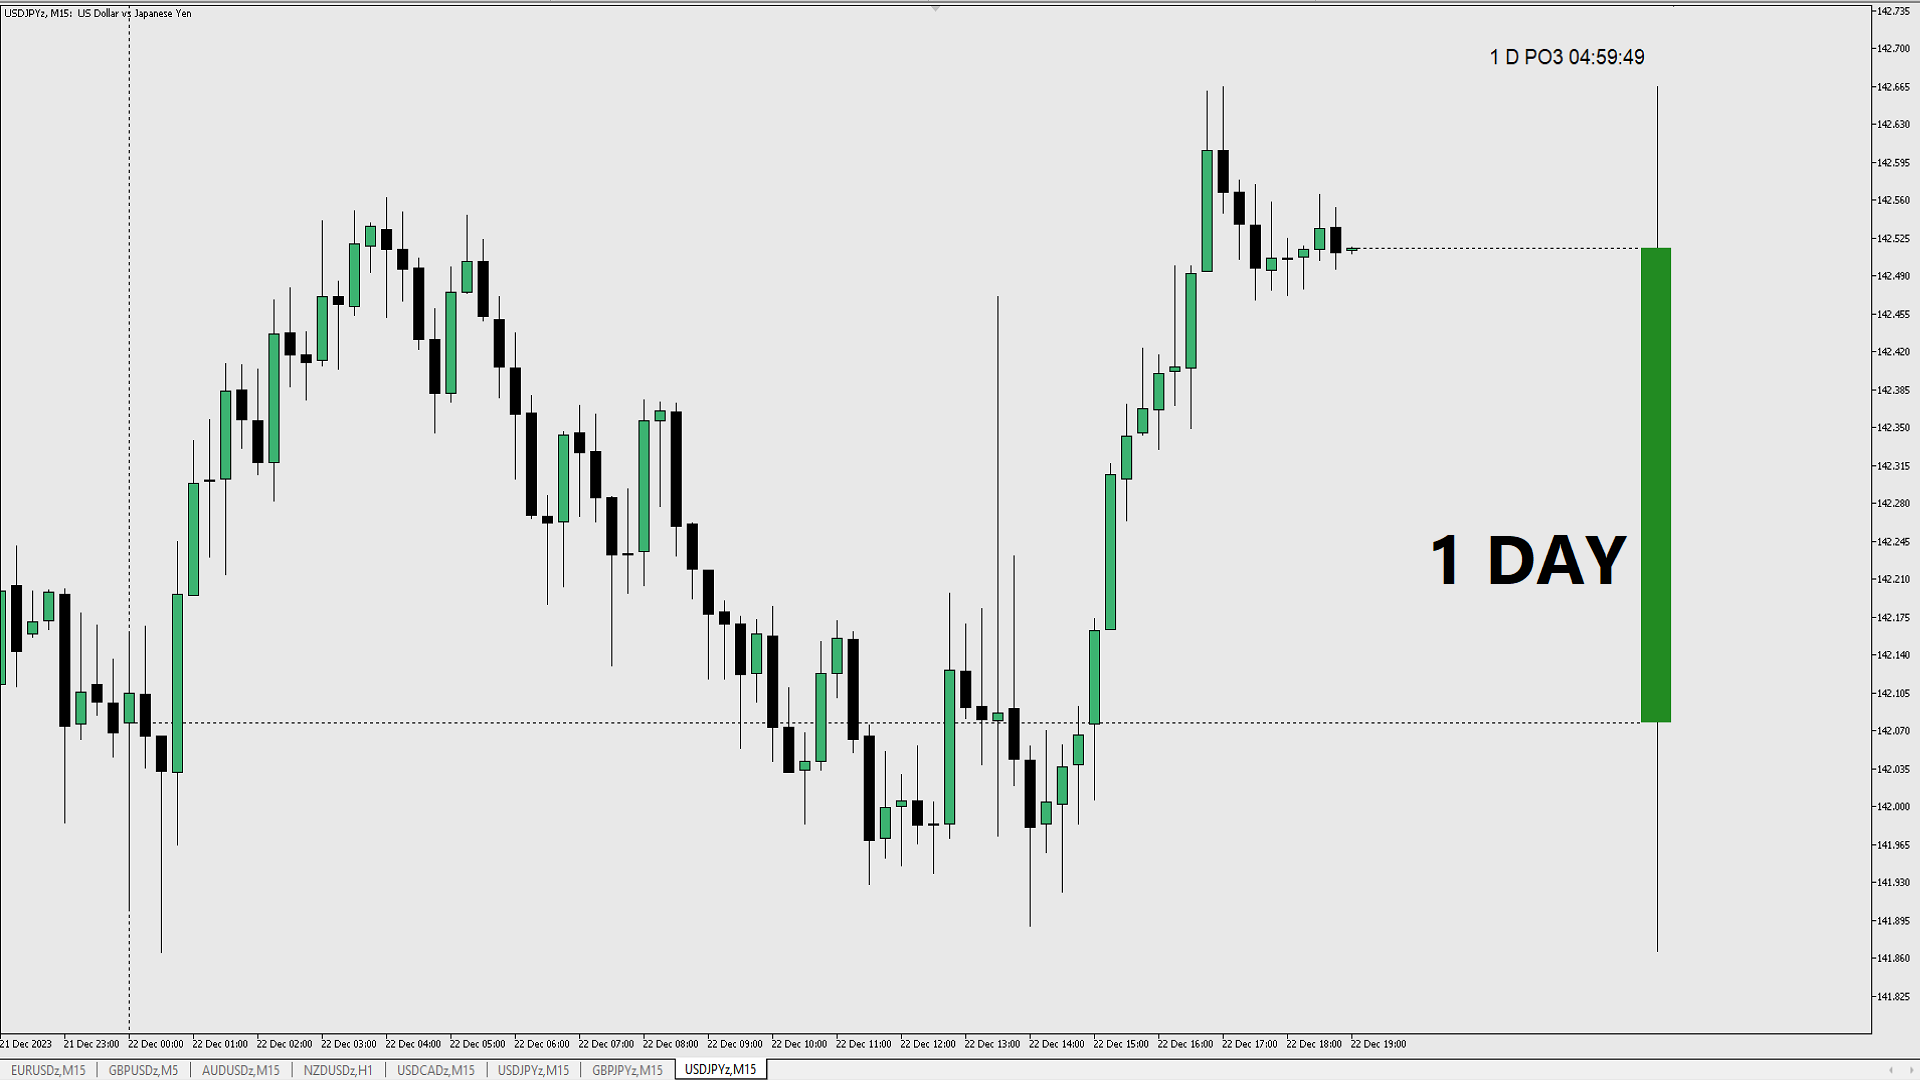
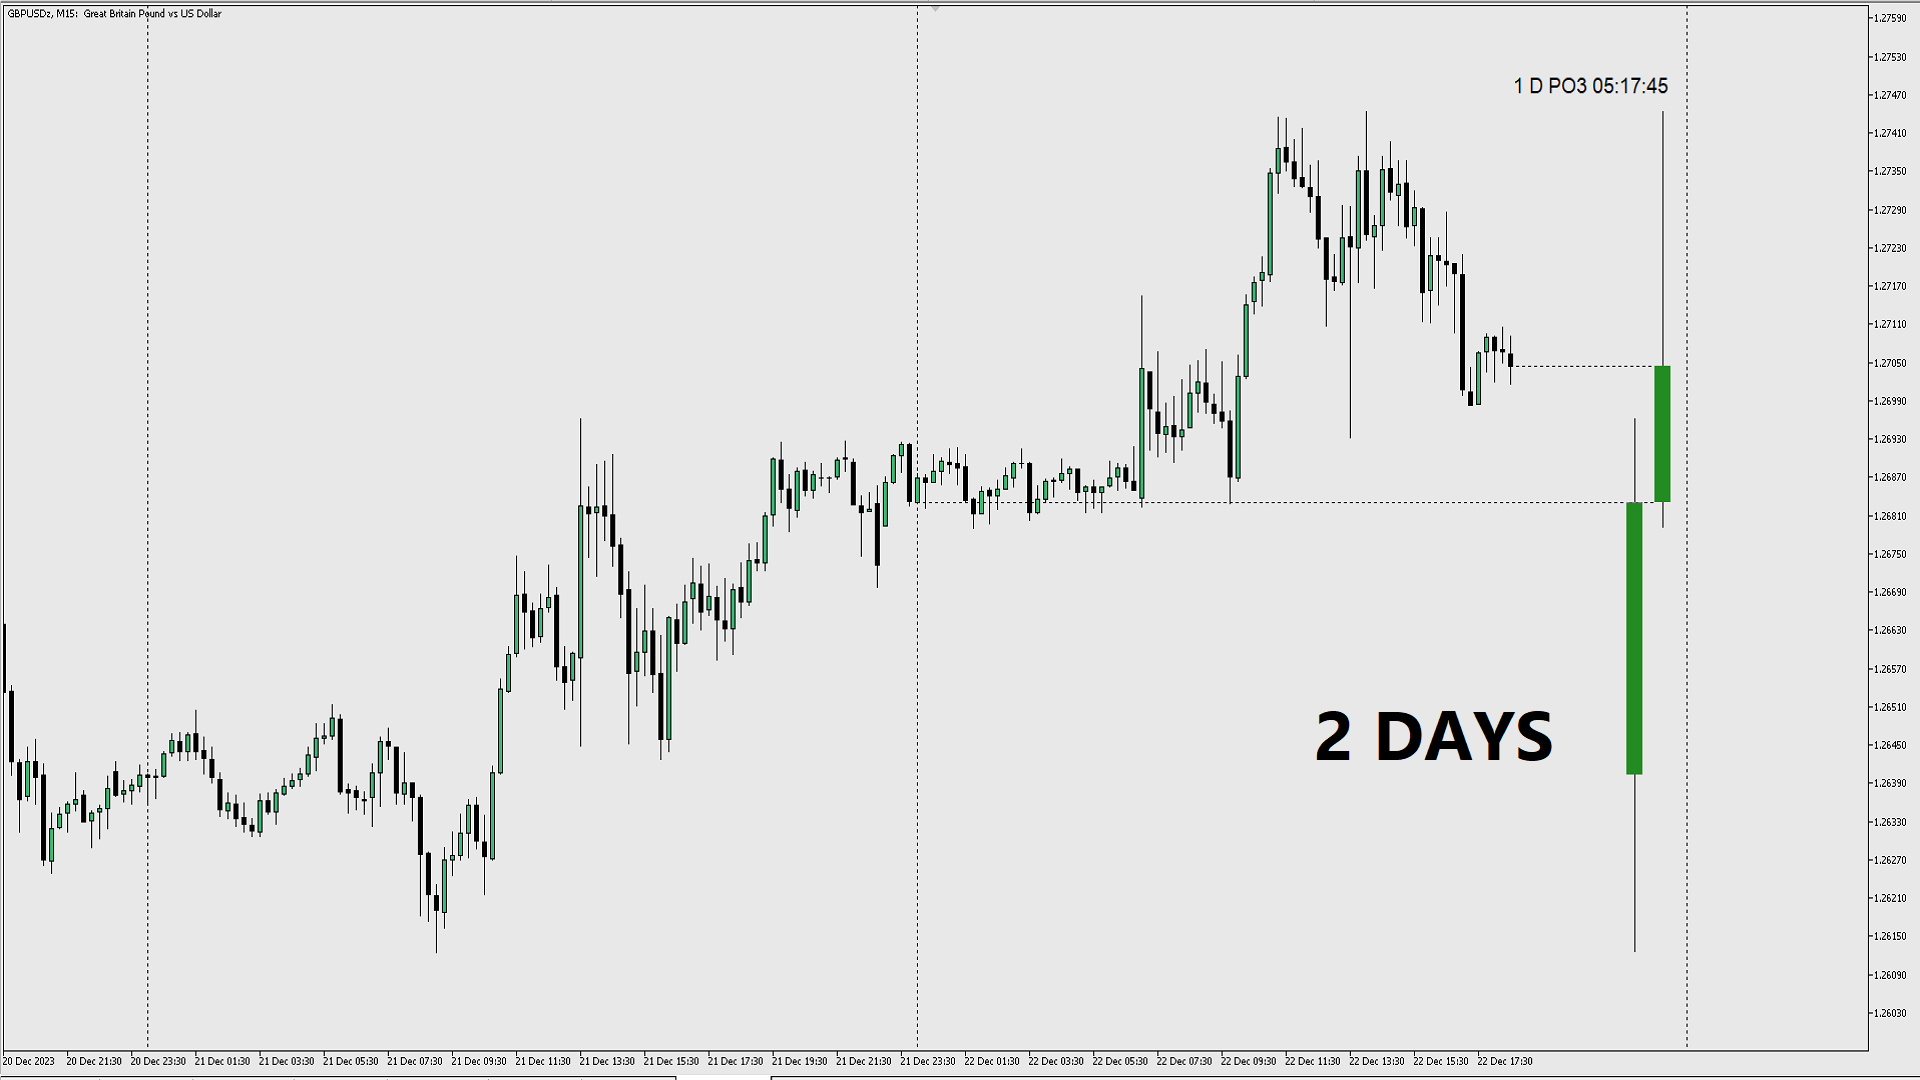
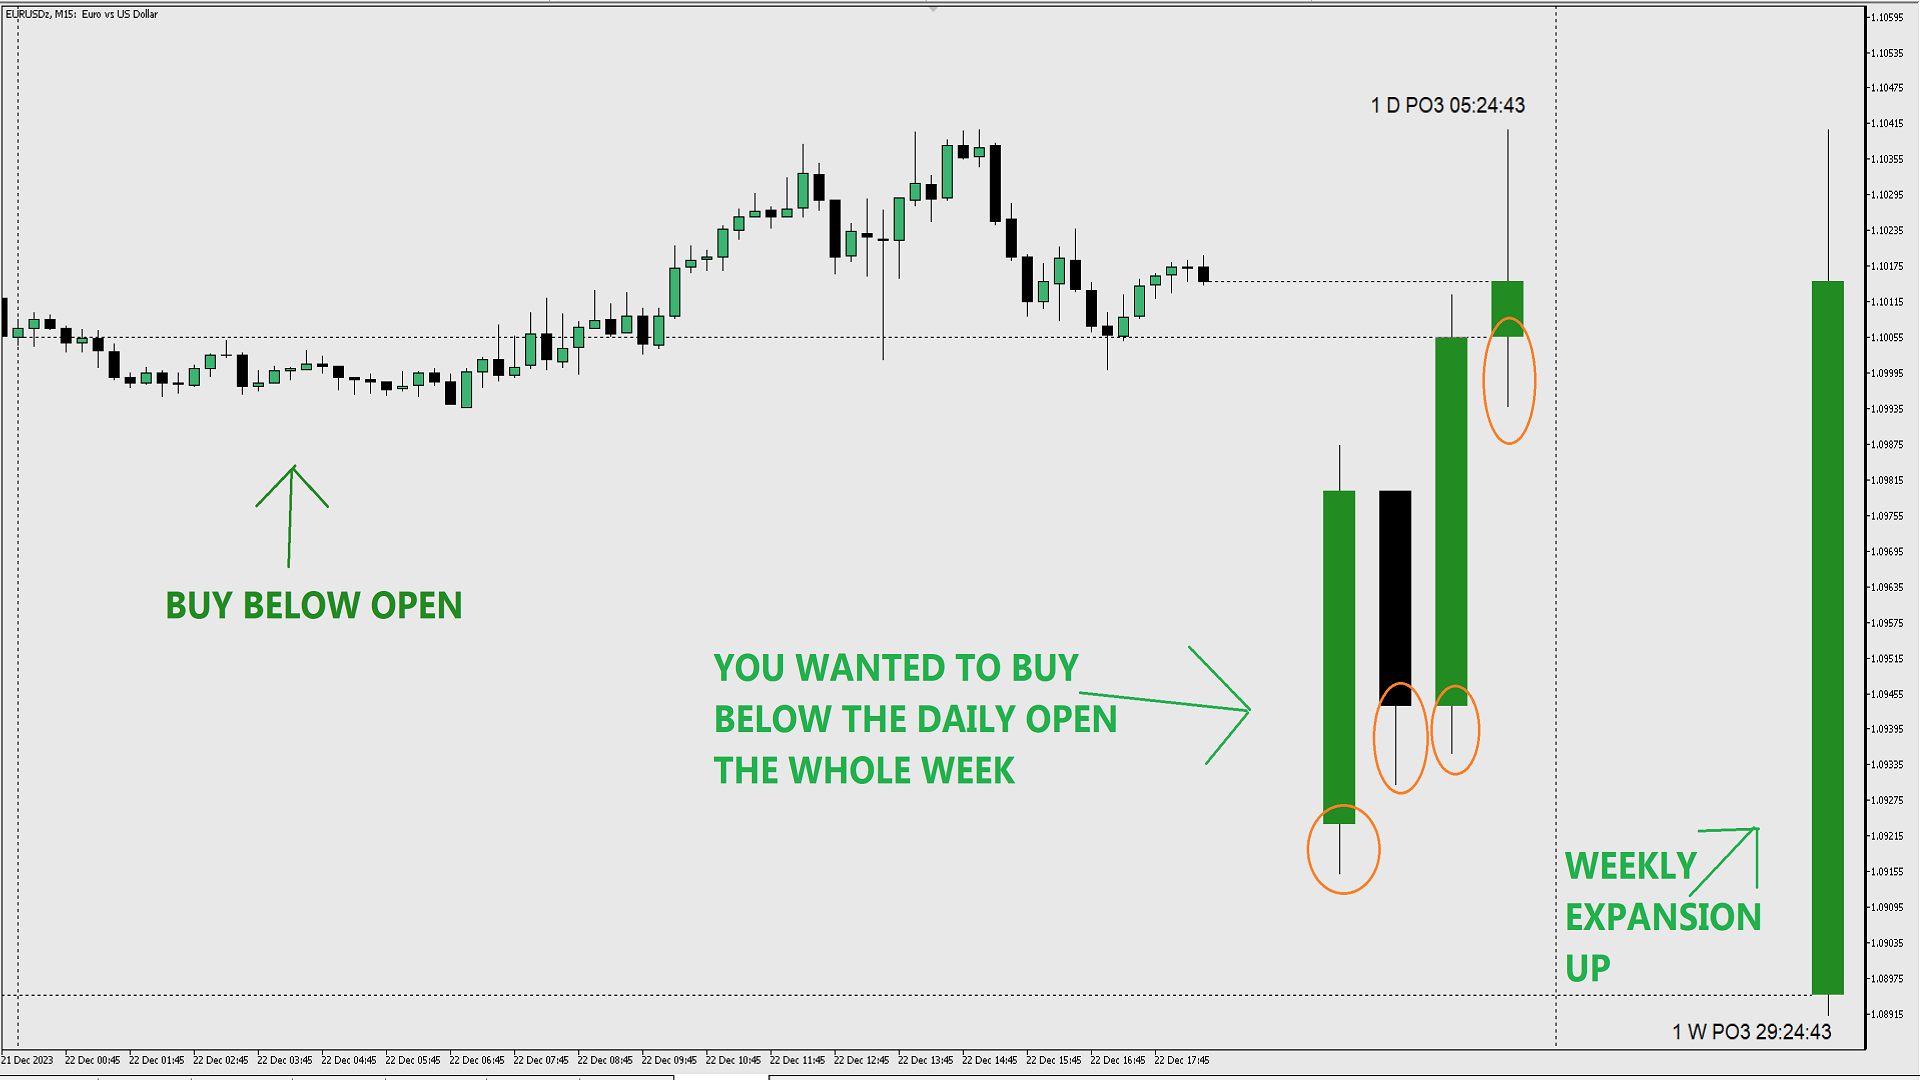
ICT tells us how its important to identify the weekly candle expansion and then try to enter above or below the daily open, in the direction of the weekly expansion.
This handy indicator here helps you keep track of the weekly and daily candles without having to check multiple charts. You can choose to print a daily, weekly and even a monthly candle in your LTF chart. Helps you to visualize in the LTF where you are in the HTFs, helps you visualize the Judas Swing.
You can also choose how many HTF bars you want to see in your LTF chart with the "Max History Bars" input.
All settings are self explanatory, I have added a "GMT offset" setting if you want to use the NY Midnight open (the "true" IPDA open). For example if your broker server time is GMT 0, then you leave this input at 0 if you wanna match your broker's daily open. If you want the daily candle to start at NY Midnight then you would set this input with -4 (for UTC -4), or -5 (for UTC -5).
MT5 Version
https://www.mql5.com/en/market/product/110406?source=Site
사용자가 평가에 대한 코멘트를 남기지 않았습니다