MetaTrader 5용 Expert Advisor 및 지표 - 34

피닉스 뉴스 카운트다운 캘린더 (MT5)
메타트레이더 5용 실시간 경제 뉴스 카운트다운 패널. 다가오는 고영향 이벤트를 정확한 카운트다운 타이머와 함께 표시하여 트레이더가 변동성 급등 시 리스크를 관리할 수 있도록 지원합니다.
목적
경제 뉴스 발표는 예상치 못한 변동성, 슬리피지, 손실을 초래합니다. 고영향 이벤트에 무턱대고 진입하면 기술적 설정과 리스크 관리가 즉시 무효화될 수 있습니다.
피닉스 뉴스 카운트다운 캘린더는 예정된 경제 이벤트를 수집하여 브로커 서버 시간과 동기화합니다. 패널은 실시간으로 업데이트되는 카운트다운 타이머와 함께 다가오는 뉴스 이벤트를 표시하여, 변동성이 발생하기 전에 트레이더가 포지션을 준비하거나 일시 중지하거나 청산할 수 있도록 합니다.
설치
MQL5 마켓에서 다운로드하여 차트에 부착하세요. 캘린더 패널이 즉시 표시되며 별도 설정 없이 사용 가능합니다.
요구 사항
MetaTrader 5 빌드 3280 이상. 차트에서 실행해야 하는 전문가
FREE
Product Description The RR & Panel Manager v4 is a professional trade management utility designed for MetaTrader 5. It is not an auto-trading bot that opens trades for you; rather, it is a visual assistant that activates as soon as you open a manual trade. It serves two main purposes: Risk/Reward Visualization: It instantly draws visual boxes on the chart showing your Stop Loss (Risk) and Take Profit (Reward), including intermediate targets (TP1, TP2, TP3) and the monetary value (USD)
FREE

ORB Guardian – 오프닝 레인지 브레이크아웃 + Prop Firm 보호
Prop Firm 챌린지와 규칙적인 데이 트레이딩을 위한 빠르고 안정적인 EA.
마틴 없음. 그리드 없음. 100% 규칙 기반. 왜 ORB Guardian인가? • 전문 트레이딩 저널과의 거래 자동 동기화
• 자동 Opening Range Breakout
• 단일 신호 또는 확인 모드
• Prop Firm 보호(일/주/월/전체 손실 제한)
• 제한 또는 목표 도달 시 자동 중단
• 추세·변동성 필터
• 요일·시간 필터
챌린지 통과 안정성 중심 설계
• 단일 주문
• 고정 리스크
• 위험한 숨은 전략 없음
• USDJPY, XAUUSD, US30 지원 주요 기능
• 사용자 정의 Opening Range
• Breakout / Reverse 모드
• Prop Firm 안전 모듈
• 주간/월간 보고서
• 실시간 대시보드 추천
• M5–M15
• 최소 500 USD
• FTMO, MFF, FundedN

이 트레이딩 로봇은 금(XAU)과 외환(Forex) 시장에서 자동 거래를 수행하도록 설계되었습니다. 시장 트렌드, 자산 상관관계 및 거시경제 요소를 분석하여 최적의 매수 및 매도 지점을 찾습니다. 주된 목표는 리스크를 최소화하면서 포트폴리오 리밸런싱을 통해 수익을 극대화하는 것입니다. 주요 기능 실시간 시장 분석
금과 통화 가격을 지속적으로 모니터링하고 트렌드를 분석하여 패턴을 식별하고 전략을 조정합니다. 포트폴리오 리밸런싱
안전한 자산(USD/CHF, USD/JPY), 원자재 관련 통화(AUD/USD, NZD/USD), 주요 유동성 높은 페어(EUR/USD, GBP/USD)를 고려하여 균형 잡힌 자산 배분 전략을 적용합니다. 상관관계를 활용한 거래
금 가격과 강한 상관관계를 보이는 통화 페어를 찾아 트레이딩 전략에 반영합니다. 예를 들어, 호주 달러(AUD)는 금과 함께 움직이는 경향이 있고, 미국 달러(USD)는 반대로 움직이는 경우가 많습니다. 진입 및 청산 최적화
이동
FREE

The Period separators indicator separates time periods, specified by user.
It supports all timeframes, greater or aliquot to current timeframe. In case of the incorect timeframe, the indicator modifies it to closest correct value. Additional bonus - the separation of non-standard time periods - MOON, MOON/2, MOON/4 (moon phases). The separators are plotted using the indicator's buffers. The indicator uses one graphic object for information about the progress and current bar properties. The graph
FREE

백테스트 설정: 파일 과 가이드를 받으려면 저에게 연락하세요. 지금까지 판매된 1 복사본은 단 1개입니다. 각 10 복사본이 판매된 후 가격이 상승합니다. 놓치지 마세요. 다음 가격: 126 시험 버전은 요청 시 제공 됩니다 (저에게 연락하세요).
Myniq는 불필요한 매개변수로 혼란을 주지 않으면서 일관된 실행을 제공하도록 설계되었습니다. 명확성을 염두에 두고 제작되어 복잡한 시스템에서 종종 발생하는 혼란을 제거합니다.
구매 후 보너스 EA를 받으려면 저에게 연락하세요
주요 보호 기능: 최대 손실 한도: 손실 한도를 정의할 수 있으며, 이 한도가 충족되면 모든 거래가 종료되고 EA가 일시 중지됩니다. 뉴스 필터: 위험한 거래를 피하기 위한 옵션 뉴스 필터가 포함되어 있습니다.
실행의 단순함: 복잡한 오버레이나 수십 가지 조건이 없습니다. 단지 XAUUSD의 M15 시간프레임에 EA를 부착하면 나머지는 자동으로 처리됩니다. 모든 포지션을 내부적으로 관리하기 위해서는 하나의 차

이전 버전의 인디케이터 개발 ZigZag WaveSize MT4 ZigZag WaveSize - 표준 ZigZag 인디케이터를 수정하여 포인트, 레벨 및 다양한 경고 로직에 대한 정보 추가
일반적인 개선 사항: MetaTrader 5 코드 적응 그래픽 객체 작업 최적화 새로운 기능: 극점에서의 수평 수준 수준 유형 선택: 수평/광선/세그먼트 유동성 수준 필터 (가격에 의해 돌파되지 않음) 돌파 버퍼: 거짓 돌파에 대한 민감도 설정 레이블 및 기능 설정: 수량, 외관, 오래된 레이블 삭제 구조 돌파 알림 (BoS) 움직임 성격 변경 알림 (ChoCH) 최적화: 극값 업데이트 로직 수정 새로운 객체의 동적 업데이트 바 출현 시 하중 감소 레이블의 중앙 집중 시스템 수정 사항: 배열 범위 초과 수정 레이블의 정확한 위치 지정 중복 파라미터 제거
ZigZag WaveSize 인디케이터를 귀하의 트레이딩 시스템의 보완재로 사용하세요 또한 시장에서의 나의 다른 제품도 시도해 보세요
FREE

MT5용 NAS100 Auto SL 및 TP 메이커를 소개합니다:
메타트레이더 5에서 나스닥 100 시장을 탐색하는 트레이더에게 없어서는 안될 보조 도구인 NAS100 Auto SL 및 TP 메이커로 손절 및 테이크프로핏 설정을 다시는 놓치지 마세요. 이 도구는 손절 및 테이크프로핏 레벨을 자동으로 관리할 수 있는 원활한 솔루션을 찾는 분들을 위해 설계되었습니다.
주요 특징:
손쉬운 자동화:
스톱로스 및/또는 테이크프로핏 없이 나스닥 100 거래를 자동으로 모니터링합니다.
사용자가 구성한 설정에 따라 레벨을 동적으로 조정합니다.
다양한 주문 유형:
나스닥 100의 시장가 및 지정가 주문 모두와 호환됩니다.
메타트레이더 5에서 사용할 수 있는 다양한 주문 유형을 지원합니다.
맞춤형 구성:
사용자 친화적인 매개변수 설정으로 추적 기본 설정 및 손절/익절 수준을 사용자 지정할 수 있습니다.
유연한 범위:
실행되는 특정 NAS100 상품 또는 거래되는 모든 상품에 대해 손절 및 테이크프
FREE
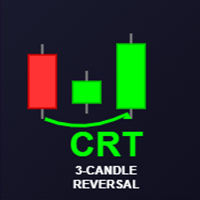
CRT Bomb Indicator - MT5 GBPUSD The CRT Bomb is a professional trading indicator that detects high-probability 3-candle reversal patterns (CRT - Candle Reversal Technique) across all timeframes and symbols. VPS is recomended so that you dont miss any CRT setups as they form , for entries you can use your manual analysis for confirmation like FVG, OBS etc Works on GBPUSD ONLY BUY THE FULL VERSION WORKING ON ANY INSTRUMENT HERE https://www.mql5.com/en/market/product/155393 Key Features: Identif
FREE

Breakout Monitor is a powerful trading tool designed to track price action within your custom-drawn zones. Simply draw a rectangle on your chart to define your consolidation or key levels, and the indicator will do the rest. It highlights the price range clearly and monitors it in real-time, ensuring you never miss a significant market move. When the price breaks through your defined boundaries, the indicator sends an instant Push Notification directly to your mobile phone in a clear, actionable
FREE

MidasZigzag EA This EA is an automated trading system specifically developed for GOLD (XAUUSD) trading. It employs a breakout strategy based on the ZigZag indicator and is optimized for 15-minute timeframe trading.
Recommendations: Currency Pair: XAUUSD (GOLD) Timeframe: M15 (15-minute) Minimum Deposit: $500 Account Type: ECN, Raw, or Razor with very low spreads Brokers: IC Markets, Pepperstone, Exness, and other low-spread brokers Important: Using a LOW SPREAD account is crucial for optimal
FREE

기능
가격에 대한 거래량 확인 지표입니다. 주로 EURUSD에 적용되며, 다른 통화 쌍은 작동하지 않거나 계산에 오랜 시간이 걸릴 수 있습니다. 원활한 사용을 위해 "차트 경계를 오른쪽 경계에서 이동" 옵션을 활성화합니다(스크린샷에 표시됨). 새로운 막대가 나타날 때 데이터가 재설정됩니다.
변수 COlOR: 지표 색상 설정 WIDTH: 지표 너비 설정 PERIOD: 데이터 계산을 위한 기간 설정
‐----‐-------------------------------------------------------------------------------------------------------------------------------------------------
FREE

Volatility Pattern EA – VIX75 for Deriv Synthetics Trade Volatility 75 Index (VIX75) on Deriv MT5 with confidence using this advanced forex robot .
Recommended timeframe: 30 minutes (M30) for optimal synthetic indices trading . This Expert Advisor is built on pattern recognition combined with machine learning models specifically designed for Deriv synthetics . It has been tested extensively on VIX75 volatility trading over the past 3 years and has shown consistent performance in automated tradi

ICT Quant Flow is an automated trading system that blends modern ICT concepts with a clean quantitative execution model. Instead of relying on randomness or aggressive lot manipulation, the EA follows a structured process: understand where price is trying to go, wait for efficient retracements, and manage risk with discipline. The goal is consistency, not noise. The strategy focuses on three core areas: market structure, Fair Value Gaps and liquidity behaviour. ICT Quant Flow analyses recent swi
FREE

놀라운 Clear Horizon
브레이크아웃 박스 전략: 가격 통합 및 브레이크아웃을 활용하는 지능형 거래 시스템. 최근 가격 범위를 기반으로 동적인 지지 및 저항 박스를 그리고, 시장이 좁은 구역에서 벗어날 때 거래를 실행합니다. 이 논리는 수동 거래자가 종종 놓치는 고속 움직임을 목표로 합니다.
특별 출시 가격 한정된 시간 동안, Clear Horizon는 99 에 제공됩니다. 표준 가격은 곧 $150 USD 로 조정될 예정입니다. 그 가치의 일부 가격으로 고성능 전문가 조언자를 소유할 수 있는 이 기회를 놓치지 마세요.
왜 Clear Horizon를 선택해야 하나요? 숨겨진 및 클래식 MACD 다이버전스를 자동으로 감지 프롭 펌 챌린지와 개인 거래 계좌 모두에 적합 내장된 자본 보호 규칙으로 최소한의 구성만 필요 대부분의 브로커 및 계좌 유형과 호환
빠른 시작 가이드 사용자 가이드: https://www.mql5.com/en/blogs/post/762793

Please Good Review on this indicator, and i will maybe produce more indicators, Coming soon, EA base on this indicators
Linear Weighted Moving Average with HLCC applied price, and Bollinger bands with LWMA as applied price. Interesing Buy and Sell arrow based on this indicator , non Lag indicator as arrow will appear 1 candle after crossed...............
FREE

Candle Time Countdown is a professional MT5 indicator developed to displays in real-time the countdown showing the remaining time until candle close across multiple timeframes simultaneously. The indicator features intelligent color-coded visual feedback where each timeframe's text dynamically changes to bright lime green for bullish candles and red for bearish candles, with each timeframe updating independently based on its own candle direction.
Key Features Multi-Timeframe Support: M1, M5, M1
FREE

ISTANA FX – Expert Advisor for XAUUSD ISTANA FX is an automated Expert Advisor designed for trading XAUUSD (Gold). The EA focuses on controlled position management and predefined trading conditions to help traders execute trades automatically without manual intervention. General Description ISTANA FX operates fully automatically and manages positions based on internal logic and market conditions. The EA is intended for traders who prefer hands-free trading with clearly defined rules. The Expert

Hydra Trend Rider is a non-repainting, multi-timeframe trend indicator that delivers precise buy/sell signals and real-time alerts for high-probability trade setups. With its color-coded trend line, customizable dashboard, and mobile notifications, it's perfect for traders seeking clarity, confidence, and consistency in trend trading. Setup & Guide: Download MT4 Version here. To learn how to use the Indicator: Indicator Manual & Guide - Read Here
Exclusively for you: It's your chance to st
Boom and Crash Range Detector: Your Secret Weapon for Trading Spikes! Introducing the Boom and Crash Range Detector , a powerful tool designed to revolutionize your trading experience. Developed using a strategy composed and optimized with the help of a machine learning model, the system is built on vast amounts of historical data that have been analyzed to perfection. The result? A highly accurate system that identifies where those lucrative spikes are likely to occur. Here’s why this needs to

SMART SD ARROW INDICATOR
Trade Smarter, Not Harder: The Smart SD Arrow Indicator That Paints Clear Buy & Sell Signals Right On Your Chart!
Finally, an All-in-One Supply & Demand Tool That Doesn’t Just Draw Zones—It Gives You Precise, Actionable Entry Arrows. Stop Analyzing, Start Executing.
Dear Trader,
Let's be honest. You've tried indicators that draw complicated zones all over your chart. They look smart, but when it's time to pull the trigger, you're left with the same old question:
FREE

Time your Entry and Exits with Average True Range (ATR) Trailing Stops ATR Trailing Stops are primarily used to protect capital and lock in profits on individual trades but they can also be used, in conjunction with a trend filter, to signal entries. The indicator will help make your calculation of stop loss easier as it will be visually aiding you in choosing where to put your stoploss level on the chart by calculating the current value of ATR indicator. For those who are unfamiliar with ATR, i
FREE

Multi Timeframe Chart in Seconds is an indicator that allows traders to visualize price data calculated from custom timeframes directly on a single chart. The indicator supports seconds-based, minute-based, and hour-based calculations and displays the resulting price action as color candles on the active chart.
Additional Resources If you want to add indicators to a non-standard chart , consider the related product: Multi Timeframe Indicators in Seconds
https://www.mql5.com/en/market/product/15
FREE

The Indicator show Daily Pivot Points. It is possible to specify the number of days to display. For forex it doesn't consider the sunday session data. It is possibile to modify the color, style and width for every level. It is better to use this indicator with timeframe not higher than Н1. 4 Levels of support and resistance with also Intermediate Levels that is possible to hide.
FREE
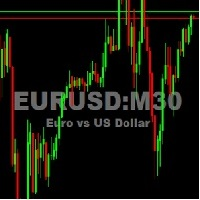
This utility tool shows the ticker symbol, timeframe, and description information as a watermark on the chart. Text resizes automatically according to chart size. It is useful to identify the correct chart when multiple charts are shown on the screen. Want more control over text apperance? Check out our Chart Watermark MT5 Premium utility. See the demonstration video below!
Inputs: Font Size: Initial font size for the ticker symbol and timeframe text (Default; 50). Description text font size
FREE

Market Structure Internal & External (CHoCH/BoS) Описание: Индикатор Market Structure Internal & External (CHoCH/BoS) — это мощный инструмент для анализа структуры рынка (Market Structure - MS) , который автоматически определяет и визуализирует ключевые точки разворота (свинги) и пробои структуры на двух различных временных масштабах/глубинах: Внутренней (Internal) и Внешней (External) . Он использует концепции Change of Character (CHoCH) и Break of Structure (BoS) из методологии Smart Money Con
FREE

50% off. Original price: $60 Support and Resistance zones indicator for MT5 is a multi-timeframe panel and alert that finds support and resistance zones and pivot points for all timeframes of MetaTrader 5 and gives alert when price has interaction with them. Download demo version (works on GBPUSD, EURJPY and NZDUSD symbols) Read the full description of scanner parameters in the blog page . Many unique features in one indicator: Integrating support and resistance zones and pivot points in one in

This tool is designed to visualize the position and trades history and its information, such as the entry and exit points, sizes of the trades, Reward to risk ratio, Risk percent, Profit, Target and stop-loss on the chart. it makes showing trades on the chart more informative and easier to use. it's a strategic tool that enhances your trading experience on MT5 platforms. By providing a clear visual representation of your trades and customizable settings, it empowers traders to make informed deci
FREE

CRUDE OIL BUY/SELL (3 Min) Technical Overview The CRUDE OIL BUY/SELL indicator is designed for short-term traders focusing on crude oil price movements.
It identifies high-probability buying and selling opportunities based on a combination of RSI levels , SMA trend positioning , and candle structure analysis .
This tool is particularly effective on the 3-minute timeframe , providing clear visual signals and alerts for both momentum continuation and potential reversals. How It Works The indicator
What is the Chart Sync Indicator? This custom MQL5 tool enables multi-timeframe chart synchronization, addressing a common pain point in technical analysis: the inconsistencies when switching between chart windows or timeframes. Instead of managing each chart separately, this indicator links them so actions such as panning, zooming, drawing objects, or changing symbols are mirrored across all synced charts of the same symbol. The result is a smoother, unified analysis experience. Key Advantages:
FREE
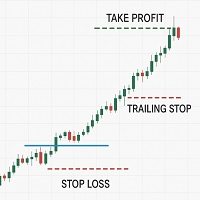
Note: All inputs of this EA are designed in Arabic for easier configuration and management
Auto Smart Trade Manager EA Ar automatically manages trades on MetaTrader 5. Sets Stop Loss (SL) and Take Profit (TP) , supports Trailing Stop to secure profits, and includes Equity Protection . Smart management for all trades or by Magic Number and symbol, with full control over slippage and risk. Trading involves high risk and you may lose part or all of your capital. Use this EA cautiously, and set Sto
FREE

피닉스 캔들스틱 패턴 모니터 (MT5)
MetaTrader 5용 실시간 캔들스틱 패턴 감지 및 모니터링 도구입니다. 여러 심볼에 걸쳐 고전적인 캔들스틱 패턴을 자동으로 식별하고 시각적 대시보드를 통해 포괄적인 패턴 통계를 표시합니다.
개요
피닉스 캔들스틱 패턴 모니터는 도지, 해머, 슈팅 스타, 강세 포위, 약세 포위, 모닝 스타, 이브닝 스타, 세 개의 백병, 세 개의 흑조 패턴을 감지하고 추적합니다. 시스템은 최대 18개의 구성 가능한 심볼을 동시에 스캔하며 모니터링되는 각 상품에 대한 패턴 발생 횟수 통계를 유지합니다.
대시보드는 종목명, 총 패턴 발생 횟수, 최근 감지된 패턴을 깔끔한 그리드 형식으로 표시합니다. 감지된 각 패턴은 차트에 시각적 화살표로 표시되며, 상승/하락 신호에 대한 색상을 사용자 정의할 수 있습니다. 패턴 감지는 바 마감 시점에 실행되어 재그리기 없이 확인된 신호를 보장합니다.
모니터링 대상 종목에서 패턴이 형성될 경우 팝업 알림, 소리 알림,
FREE

Time Range Separator is a useful tool to display a separator period on your platform.
You could go in the properties of the indicator, select the desired range and that's ALL. We believe it is a useful and necessary that we wish to share with you for free all our followers. Input Values: TimeFrame = Period Separator Separator_Color = Vertical Color Line Separator_Style = Vertical Color Style Separator_Width = Vertical Line Width Good trading to all and see you soon. Same indicator for MT4 here
FREE

Attempts to recover losing trades.
If a trade moves in the wrong direction, the Zone Recovery algorithm begins.
An alternating series of Buy and Sell trades at two specific levels take place, with two Exit Points above and beyond these levels.
Once either of the two exit points is reached, all trades close with a combined profit or break even.
To use
1) Place the EA on a chart and select how the first trade will open (Manual/Via EA strategy/Use EA panel/External EA)
2) Configure your recovery

세션 브레이크 아웃 지표 – 세션 기반 거래를 위한 궁극적인 도구 세션 브레이크 아웃 지표 는 트레이더가 시장 세션을 모니터링하고 시간 기반 거래 전략을 효과적으로 활용할 수 있도록 설계된 최첨단 도구입니다. 전문 트레이더는 시간이 외환 시장에서 중요한 역할을 하며, 거래 세션마다 통화 강도와 변동성이 다르다는 것을 이해합니다. 이 강력한 지표를 통해:
시장 세션 추적 – 활성화된 세션과 열린 시장을 즉시 확인. 세션 고점 & 저점 모니터링 – 돌파 및 반전의 주요 수준을 감시. 새로운 돌파 포착 – 세션의 고점 또는 저점이 돌파될 때 실시간 알림 수신. 모든 시간대에 적응 – 지표를 현지 GMT 설정에 쉽게 맞춤. 세션 겹침 시각화 – 아름다운 그래픽 디스플레이로 세션 전환 명확하게 표시. 과거 세션 박스 – 간단한 체크박스로 과거 차트에서 세션 구조 보기. 즉각적인 매수 & 매도 신호 – 돌파가 발생하면 화면 알림 및 화살표 표시. 왜 세션 브레이크 아웃 지표를 선택해야 할까요?
FREE

This indicator combines TRIX (Triple Exponential Moving Average) with a Moving Average, which can be simple, exponential, smoothed or weighted.
This combination is very useful to identify the main trend and when it is changing to a new direction.
The indicator also has signals on the chart that indicates the TRIX crossing with the Moving Average, as well as pop-up alerts and push (in the MT5 app).
Enjoy it!
FREE
CandleStick Patterns Indicator for MT5 — Professional Pattern Scanner Bring proven candlestick analysis into your workflow. This indicator automatically scans your chart and highlights high-quality reversal and continuation patterns, so you can react faster and with more confidence. Check the “More from author” section on the Market page to see our full suite of indicators. What it does Scans historical and live candles from a user-defined lookback range.
Detects and labels major single- and m
If you love this indicator, please leave a positive rating and comment, it will be a source of motivation to help me create more products <3 Key Takeaways VWAP is a trading benchmark that typically is most useful to short-term traders. VWAP is used in different ways by traders . Traders may use it as a trend confirmation tool and build trading rules around it. Also, If prices below VWAP and move above it, c an be used by traders as a sell signal. If prices above VWAP and move below it, ca
FREE

John Bollinger created this indicator in 2010 as a way to read the original indicator (Bollinger Bands) in a more "technical" way, shown as an oscillator. The typical range of the Bollinger Bands %B is 0 - 0.5 - 1.0, where "0" represents the lower band, the "0.5" the middle band, and "1" the upper band. The line on the indicator represents the Closing prices. As simple as that.
SETTINGS
Bollinger Bands period of analysis Standard Deviation multiplier Shift Price type to be analyzed
If you like
FREE
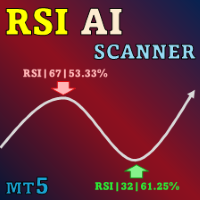
Special offer : ALL TOOLS , just $35 each! New tools will be $30 for the first week or the first 3 purchases ! Trading Tools Channel on MQL5 : Join my MQL5 channel to update the latest news from me MT5용 혁신적인 RSI Kernel Optimized with Scanner를 소개합니다. 이 최첨단 도구는 강력한 커널 밀도 추정(KDE) 알고리즘을 통합하여 전통적인 RSI 분석을 재정의합니다. 이 고급 지표는 실시간으로 시장 트렌드에 대한 인사이트를 제공할 뿐만 아니라, 여러 통화쌍과 시간 프레임을 동시에 스캔할 수 있는 대시보드를 포함하고 있습니다. 이 도구가 당신의 거래 도구 상자에 필수적인 이유를 살펴보겠습니다. See more MT4 version at: RSI Kernel Optimized M

Shaolin Trend Follow v2.1
MetaTrader 5의 EURUSD에 최적화 가볍고 오직 시그널만 제공하는 인디케이터로, 엄격한 탑다운 방식으로 동작합니다. 먼저 H4 차트에서 주요 추세를 확인한 후 M15 차트에서 변동성에 맞춰 조정된 진입 신호를 기다립니다. 자동 주문이나 자금 관리 기능은 없으며, 조건이 충족될 때마다 깔끔한 / 표시만 남겨두어 사용자가 직접 판단해 거래할 수 있습니다. H4 추세 확인 Parabolic SAR + ADX 필터로 확립된 상승 또는 하락 추세만 통과시킵니다. H4에서 추세가 확인될 때만 M15 진입 신호가 활성화됩니다. 변동성 밴드 H4의 ATR로 시장을 낮음·중간·높음 세 가지 변동성 구간으로 분류합니다. 현재 구간에 따라 진입 엔진이 선택적으로 작동합니다. M15 진입 엔진
H4 추세와 변동성 구간이 허용할 때, 다음 조건 중 하나가 충족되면 해당 M15 봉에 (매수) 또는 (매도) 표시를 합니다. 오실레이터 반전
FREE

75% Off until August 30, 2025.
Asset: Gold TimeFrame: Any sample .set file for XAUUSD 1 Minute is in the comment section. You can view EA Live Performance on myfxbook . SMC Candlestick Trader for MT5 is a powerful Expert Advisor built specifically for trading Gold (XAUUSD) on the any timeframe. It identifies 11 different candlestick patterns on higher timeframes (M15, M30 & H1) and executes only high-probability break of structure (BOS) or change of character (CHOCH) trades that are validated b

이 전문가 자문(EA)은 거래 관리를 간소화하도록 설계되었으며, 더욱 효율적인 포지션 관리를 위한 여러 가지 실용적인 버튼을 제공합니다. 특히 여러 진입 지점을 가진 트레이더와 주문을 신속하게 관리해야 하는 트레이더에게 적합합니다. EA의 명확한 인터페이스와 직관적인 제어 기능은 복잡한 설정 없이 일괄 작업을 간편하게 수행하여 수동 개입으로 인한 오류를 줄여줍니다.
주요 기능은 다음과 같습니다.
단기 거래에서 위험을 신속하게 확보하는 데 이상적인 5포인트 손익분기점을 한 번의 클릭으로 설정합니다.
일중 스윙 트레이딩에 이상적인 10포인트 손익분기점을 한 번의 클릭으로 설정합니다.
BTC/USD와 같은 변동성이 높은 시장에 이상적인 1000포인트 손익분기점을 한 번의 클릭으로 설정합니다.
소액이지만 안정적인 수익을 달성하기 위해 모든 미결제 포지션의 손익분기점에 이익실현을 자동으로 설정하고, 2핍 스프레드를 선택적으로 적용할 수 있습니다.
모든 미결제 포지션을 한 번의 클

슈퍼트렌드 다중 통화 EA MT5 는 여러 통화쌍과 시간 프레임에 걸쳐 광범위하게 백테스트된 강력한 이중 강력한 슈퍼트렌드 지표 전략을 구현합니다. 이 전문가 조언자(EA)는 그리드 복구, 헤징 옵션, 마틴게일 전략(모두 사용자가 설정 가능하며 기본값으로는 비활성화됨) 등 포괄적인 거래 기능을 제공합니다. 돌파, 반전, 추세 추종 등 정밀한 진입 방식과 함께, 지표 기반, 시간 기반, 수익 기반 등의 유연한 청산 규칙을 제공하며, 손실 제한 기능, 스프레드/슬리피지 필터, 시스템 리소스를 적게 사용하면서도 지연 없는 거래 실행이 가능한 고성능 인디케이터도 포함됩니다. 이 시스템은 거래 시간 제어를 위한 요일/시간 필터를 제공하며, 백테스트를 통해 성능을 검증할 수 있습니다. 실시간 대시보드를 통해 현재 포지션, 계좌 자산, 시스템 지표를 확인할 수 있으며, 직관적인 입력 메뉴를 통해 손쉽게 설정할 수 있습니다. 모든 설정 항목에 대한 상세 설명서가 제공됩니다. 자세한 설명서 :

맞춤형 오실레이터를 사용하여 가격 반전을 예상하면서 단기 시장 변동을 거래하는 완전 자동화된 고급 도구입니다. 플러그인 가능한 자동 로트 계산, 내장 중첩 복구 알고리즘, 주문 간 조정 가능한 단계 전략. MT4 버전 -> 여기 / 문제 해결 -> 여기 이점: 수동 주문을 추가할 수 있는 자동화 시스템 고정 및 조정 가능한 동적 피치 조정 가능한 중첩 복구 알고리즘 한 방향 또는 양방향 거래 가능 반대 방향으로 이동할 때 평균화를 사용합니다. 플러그형 자동 볼륨 계산 모든 유형의 알림을 보낼 수 있는 내장 기능 입력 매개변수: 주요 설정 Size_of_the_first_order - 첫 번째 주문의 크기를 정의하는 변수
Enable_Autolot_calculation - 보증금 변경 시 위험 설정을 저장할 수 있는 기능입니다.
Autolot_deposit_per_0.01_lots - 오토롯 사용 시 0.01랏당 예치금
Maximum_size_of_orders - 한 주문

The Volume Weighted Moving Average (VWMA) is calculated based on Prices and their related Volumes giving importance to those candles with more Volume. During periods of almost equal volume distributed along the observed period (commonly, in low volume periods) the VWMA will be graphically similar to a Simple Moving Average. Used along other moving averages a VWMA could be used as an alert, filter or whatever your imagination could think of...
HOW TO "READ" THIS INDICATOR As any Moving Average.
FREE

SnapBack EA – Mean Reversion Trading System Version 1.10 SnapBack EA is a robust mean-reversion Expert Advisor for MetaTrader 5, leveraging popular technical indicators to spot potential pullback opportunities in ranging markets. Strategy Overview Enters trades based on extreme price levels combined with momentum confirmation Buy on oversold conditions; Sell on overbought setups Strict one position at a time rule (no hedging, no grid, no martingale) Fixed Stop Loss and Take Profit for discipline
FREE

VTrende Pro - MTF indicator for trend trading with a display panel for MT5 *** Videos can be translated into any language using subtitles (video language - Russian)
Although the signals of the VTrende Pro indicator can be used as signals of a full-fledged trading system,
it is recommended to use them in conjunction with the Bill Williams TS.
VTrende Pro is an extended version of the VTrende indicator. Difference between Pro version and VTrende:
- Time zones
- Signal V - signal 1-2 waves
- S

Copy trades with ease using the MetaTrader5 trade copier - the quickest and easiest way to copy transactions between different MetaTrader 5 accounts! This innovative tool allows you to locally copy trades in any direction and quantity, giving you full control over your investments.
Attention!
You need to download the Trade Copier Slave mq5 file as well to run this EA. Download it from here https://www.mql5.com/en/market/product/96541
Designed to work on both Windows PC and Windows VPS, this
FREE

The RSI Engine EA 는 SPLpulse가 개발한 MetaTrader 5 (MT5) 플랫폼용 자동 거래 로봇입니다. 핵심 기능은 상대강도지수(RSI) 지표의 신호를 기반으로 거래 전략을 실행하는 것입니다. 이 EA는 고도로 설정 가능하여 사용자가 여러 RSI 기반 진입 전략을 선택하고, 확인 필터를 적용하며, 특정 위험 매개변수로 거래를 관리할 수 있습니다. 거래 전략 및 신호 EA의 로직은 주로 사용자가 선택할 수 있는 진입 및 청산 전략에 의해 구동됩니다. 진입 신호 사용자는 거래 신호를 생성하기 위해 다음 방법 중 하나 이상을 선택할 수 있습니다. RSI 다이버전스 (기본 전략): 기본적으로 활성화된 주요 전략은 RSI 다이버전스 기반 거래입니다. EA는 지난 60개의 바(설정 가능)를 스캔하여 가격 움직임과 RSI 지표가 반대 방향으로 움직일 때를 식별하며, 이는 종종 임박한 반전을 신호합니다. 강세 다이버전스 (매수 신호): 가격이 새로운 저점을 기록했지만 RSI
FREE

The fact that round number levels have a significant influence on the market cannot be denied and should not be overlooked. These psychological levels are used by both retail Forex traders and major banks that deal in Forex. Very simple and effective indicator and most importantly free. ////////////////////////////////////////////////////////////////////////////////////////////////////////////////////////////////////////////////////////////// The program does not work in the strategy tester.
FREE
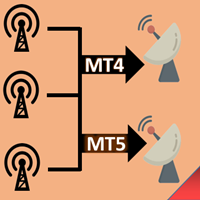
복사기->편리하고 빠른 인터페이스 상호작용으로 사용자가 바로 사용 가능 ->>>> Windows 컴퓨터 또는 VPS Windows에서 사용하는 것이 좋습니다. 기본 기능: 복사 거래의 일반적인 상호작용 속도는 0.5초 미만입니다. 신호 소스를 자동으로 감지하고 신호 소스 계정 목록을 표시합니다. 심볼 자동 매칭, 다양한 플랫폼에서 일반적으로 사용되는 거래 심볼의 95%(다른 접미사와 같은 특수한 경우)가 자동으로 매칭되며, 기본적으로 수동 설정이 필요하지 않으며 심볼 매핑 테이블을 두 번 클릭하여 해당 심볼을 변경할 수 있습니다. (매핑 테이블에는 빠른 심볼 검색 기능이 있습니다) 4가지 lot 계산 모드(1. 승수 2. 고정 lot 3. 적응형 위험 4. 신호 적응형 위험 ) 특수 로트 모드: 로트 크기는 손절매 자본 위험에 따라 계산될 수 있습니다.(손절매가 너무 작을 수 있고 계산된 로트 크기가 너무 클 수 있으므로 주의해서 사용하세요) 다중 플랫폼, 다중 신

Highly configurable Macd indicator.
Features: Highly customizable alert functions (at levels, crosses, direction changes via email, push, sound, popup) Multi timeframe ability Color customization (at levels, crosses, direction changes) Linear interpolation and histogram mode options Works on strategy tester in multi timeframe mode (at weekend without ticks also) Adjustable Levels Parameters:
Stochastic RSI Timeframe: You can set the lower/higher timeframes for Stochastic RSI. Stochastic RSI
FREE

Display Order box list from Trading box Order Management tool. Find contacts and manual links on my profile . This dashboard gives you an edge in forex trading because in few seconds you can decide which pair and timeframe is worth to watch more closely. This is how you will not be distracted by all other forex pairs that you trade, and you will not miss great opportunities to trade the best price.
Trading Dashboard (order box overview panel and Trading box Order management extension) Tra
FREE
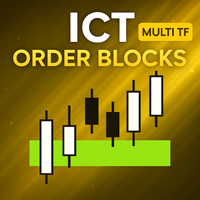
[ MT4 Version ] [ Kill Zones ] [ SMT Divergences ] How to trade using Order Blocks: Click here User Interface Performance: During testing in the strategy tester, the UI may experience lag. Rest assured, this issue is specific to the testing environment and does not affect the indicator's performance in live trading. Elevate your trading strategy with the Order Blocks ICT Multi TF indicator, a cutting-edge tool designed to enhance your trading decisions through advanced order block analysis

차세대 전문 어드바이저인 퀀텀 핍스 AI에 오신 것을 환영합니다! 이 가격에는 2/5 개만 판매됩니다. 그 이후에는 로봇의 성능이 실제 계정에 적합한지 확인하기 위해 자동으로 가격이 올라갑니다. 구매 후 저에게 연락하여 무료 인디케이터 (65$ 이상 가치)를 받으세요. 퀀텀 핍스 AI는 외환 시장에서 수익을 내도록 세심하게 설계된 최첨단 전문가 어드바이저입니다. 이 지능형 시스템은 여러 차트주기에 대한 세심한 분석과 머신러닝의 힘을 결합한 다양한 지표를 사용하여 어떤 상황에서도 시장에 적응할 수 있는 능력을 제공합니다. 퀀텀 핍스 AI를 차별화하는 것은 탁월한 적응력으로, 어떤 시장 상황에서도 짧은 추세를 더 정확하게 활용하여 수익을 낼 수 있다는 점입니다. 또한 가장 지능적인 방법으로 원하는 방향으로 진행되지 않는 거래를 청산하는 지능형 시장 종료 알고리즘이 내장되어 있습니다 / 버전 MT 4 . 자세한 내용은 매뉴얼 가이드를 참조하시기 바랍니다. 이 로봇은 마틴 게

출시 프로모션: 199 $에 단 2권만 구매 가능 최종 가격: 999$ 신규: 지금 구매하고 1EA를 무료로 받으세요! (거래 계좌 2개용) 라이브 결과: https://www.mql5.com/en/signals/1836525 high risk account
당사의 외환 거래 로봇인 Apex Trader 제품군에 최근 추가된 제품을 소개합니다 . 전문 고문을 만드는 데 수년간의 경험을 사용하여 개발된 Apex Trader는 외환 시장을 위한 강력한 거래 도구입니다. 개발자로서 저는 이 로봇을 연구하고 만드는 데 많은 시간과 자원을 투자했습니다. 저는 Apex Trader가 모든 시장 조건에 적응할 수 있도록 평균 회귀 및 추세 추종을 포함한 다양한 전략을 사용하고 있습니다. 그 결과 가장 까다로운 시장 조건도 처리할 수 있는 로봇이 탄생했습니다.
Apex Trader는 AUDCAD, AUDNZD 및 NZDCAD 통화 쌍 거래를 전문으로 하며, 다양한 이익실

This indicator visually highlights the Asian, London, and New York trading sessions on your chart using colored rectangles. It automatically calculates and displays the high, low, and price range (in pips) of each session for the most recent day. The session ranges are drawn for a configurable lookback period, allowing you to review session price action over multiple previous days. Key features include: Customizable session start and end times for Asian, London, and New York sessions. Colored se
FREE

A unique robot that has been successfully trading on a real account since 2021.
The Gold Dragon trading system is so stable that it has allowed it to survive all market fluctuations, while other systems have failed! Big sale 50% OFF! Price $450. Regular price $799 Real signal: click here Unique set files and all recommendations are provided free of charge. All future updates of the adviser are included in the price. After the purchase, contact me and I will help you install and configure t

Jackal Expert Advisor – 거래 전략 4개월 실시간 운영 구매 후 모든 제품 영구 무료 제공
설정 파일 다운로드
골드 1분 | ECN 계좌: 모든 브로커 호환
Jackal EA는 다중 계층과 지능형 돌파 전략에 기반하며, 고급 위험 및 이익 관리를 결합하여 시장의 동적 환경에 적응합니다. 1. 돌파 트랩 전략 시장 조건이 확인되면, EA는 반대 방향으로 두 개의 보류 주문을 동시에 설정합니다: Buy Stop – 현재 가격 위에 Sell Stop – 현재 가격 아래에 강력한 방향성 움직임이 발생하면 미리 예측하지 않고 즉시 시장에 진입합니다. 2. 스마트 거래 관리 초기 손절매 (SL): 손실을 제한하기 위해 고정된 손절매를 설정합니다. 트레일링 스톱: 거래가 이익 구간에 들어서면, SL이 자동으로 가격을 따라가며 이익을 확보합니다. 무위험 모드: 거래가 설정된 이익 임계값에 도달하면 SL이 진입가 위로 이동되어 최악의 경우에도 순이익으로 종료됩니다.
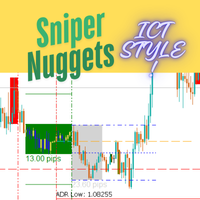
!!!!!!!! Sniper Nuggets !!!!!!!!
Sniper Nuggets is an all-in-one indicator for many things ICT style. It includes the following functionalities: Custom periods : which allow you to set custom daily period start and end times according to your taste. ADR Markers: which plots the average daily range. Worktime: which plots the various boxes on the chart for Asia range (including its high, low and midpoints, standard deviation predictions ), London open, New York open, CME open and London close.
FREE

There are some main characteristicks of my product Symbols: USDJPY- recomended other JPY pairs - please try in backtest Timeframe: M1,M5,M15 Recomended: M5 Money management: Fix TP and SL Past performance: -low drawdowns -stability Check screenshots Backtest 2020- 2024 till now Recomended Lot size settings: Deposit. Lotsize 1000€. 0.01 2000€. 0.02 5000€. 0.05 10000€. 0.1 You can Multiply lot size by 2x (more risky) Recomended other settings: de
FREE

Introducing the "Thinker EA," a state-of-the-art Expert Advisor redefined for precision, adaptability, and efficiency in forex trading. This updated, fully automated EA combines cutting-edge custom indicators, dynamic strategies, and advanced risk management tools to excel in diverse market conditions. Optimized for EURUSD , the Thinker EA delivers exceptional performance on one of the most traded currency pairs. Key Highlights: Enhanced Market Analysis: Real-time trend interpretation powered b

Simple program i created, to help close all your orders instantly when you are busy scalping the market or if you want to avoid news days but still have a lot of orders and pending orders open and can't close them in time.. with this script all you're problems will be solved.
Simple drag and drop and the script automatically does it's thing, quick and easy
also a very good tool to use when scalping
FREE

Product: Phantom Shadow Reversal Engine Version: 3.0 (Elite Edition) Developer: Trade With Thangam
THE ULTIMATE SCALPING TOOL FOR XAUUSD & MAJOR PAIRS
The Phantom Shadow Reversal Engine is not just another indicator; it is a complete trading system designed for precision scalping and day trading.
Instead of relying on lagging signals, this system uses a "Proprietary Shadow Engine" that analyzes Market
FREE

What is SMC Market Structure Pro? SMC Market Structure Pro is an automated trading Expert Advisor for MetaTrader 5 , developed based on Smart Money Concept (SMC) and market structure analysis . The EA is designed to help traders follow the natural flow of the market , focusing on price structure instead of indicators or lagging signals. How Does the EA Work? The EA analyzes market structure changes using pure price action: Detects higher highs & higher lows for bullish structure Detects l
FREE

Volume and RSI-based sniper entry signals for Boom and Crash synthetics feature robust entry alert systems. For more advanced filter signals, consider the Harmonic Hybrid Pro. When trading spikes, three orders are strategically placed to manage risk, with the third order positioned close to the highest probability of a spike. Signals are no longer valid fifteen minutes after the final order, and any losses should be closed promptly. For take profit (Tp), it is advisable to exit shortly after a s
FREE

이 프로젝트를 좋아한다면 5 스타 리뷰를 남겨주세요. 기관 거래 큰 볼륨으로, 그것은 그들을 위해 금지되지 않습니다
특정한 비율 수준에 그들의 위치를 방어하십시오. 이 수준은 당신이 사용할 수 있는 자연 지원 및 저항으로 봉사할 것입니다
무역을 입력하거나 귀하의 위치에 대한 가능한 위험의 인식. 일반적인 사용 비율의 예는 EURUSD의 0.25%와 0.50%입니다.
주, 스크린 샷에서이 예제를 볼 수 있습니다. 이 지표를 사용하면 다음과 같은 비율 변화를 그릴 수 있습니다. 일. 주. 월. 분기. 1 년.
FREE

US30 Pre-Market Breakout EA The US30_PreMarket_Breakout_EA is a high-performance algorithmic trading system designed specifically for the US30 (Dow Jones Industrial Average) index. This Expert Advisor utilizes a pre-market breakout strategy to capture early momentum moves with precision. It is built for efficiency, incorporating dynamic lot sizing, trailing stops, break-even triggers, and time-based exits to maximize profitability while controlling risk. Key Trading Features Pre-Market Breakout

I recommend you to read the product's blog (manual) from start to end so that it is clear from the beginning what the indicactor offers. This multi time frame and multi symbol divergence dashboard indicator sends an alert when one or two different divergences have been identified. It can be used with all time frames from M1 to MN. Maximum 9 time frames can be shown in the dashboard at the same time. It is possible to enable moving average, RSI or Bollinger bands trend filter to filter out on
트레이딩 전략과 기술 지표를 판매하기에 가장 좋은 장소가 왜 MetaTrader 마켓인지 알고 계십니까? 광고나 소프트웨어 보호가 필요 없고, 지불 문제도 없습니다. 모든 것이 MetaTrader 마켓에서 제공됩니다.
트레이딩 기회를 놓치고 있어요:
- 무료 트레이딩 앱
- 복사용 8,000 이상의 시그널
- 금융 시장 개척을 위한 경제 뉴스
등록
로그인
계정이 없으시면, 가입하십시오
MQL5.com 웹사이트에 로그인을 하기 위해 쿠키를 허용하십시오.
브라우저에서 필요한 설정을 활성화하시지 않으면, 로그인할 수 없습니다.